Cloud SOAR Main Menu
Cloud SOAR is a pure web-based application which does not require an additional add-on or client to deploy. The main menu consists of all operational sections of Cloud SOAR, including Incidents, Triage (if enabled), Operations, and incoming Data Sources.

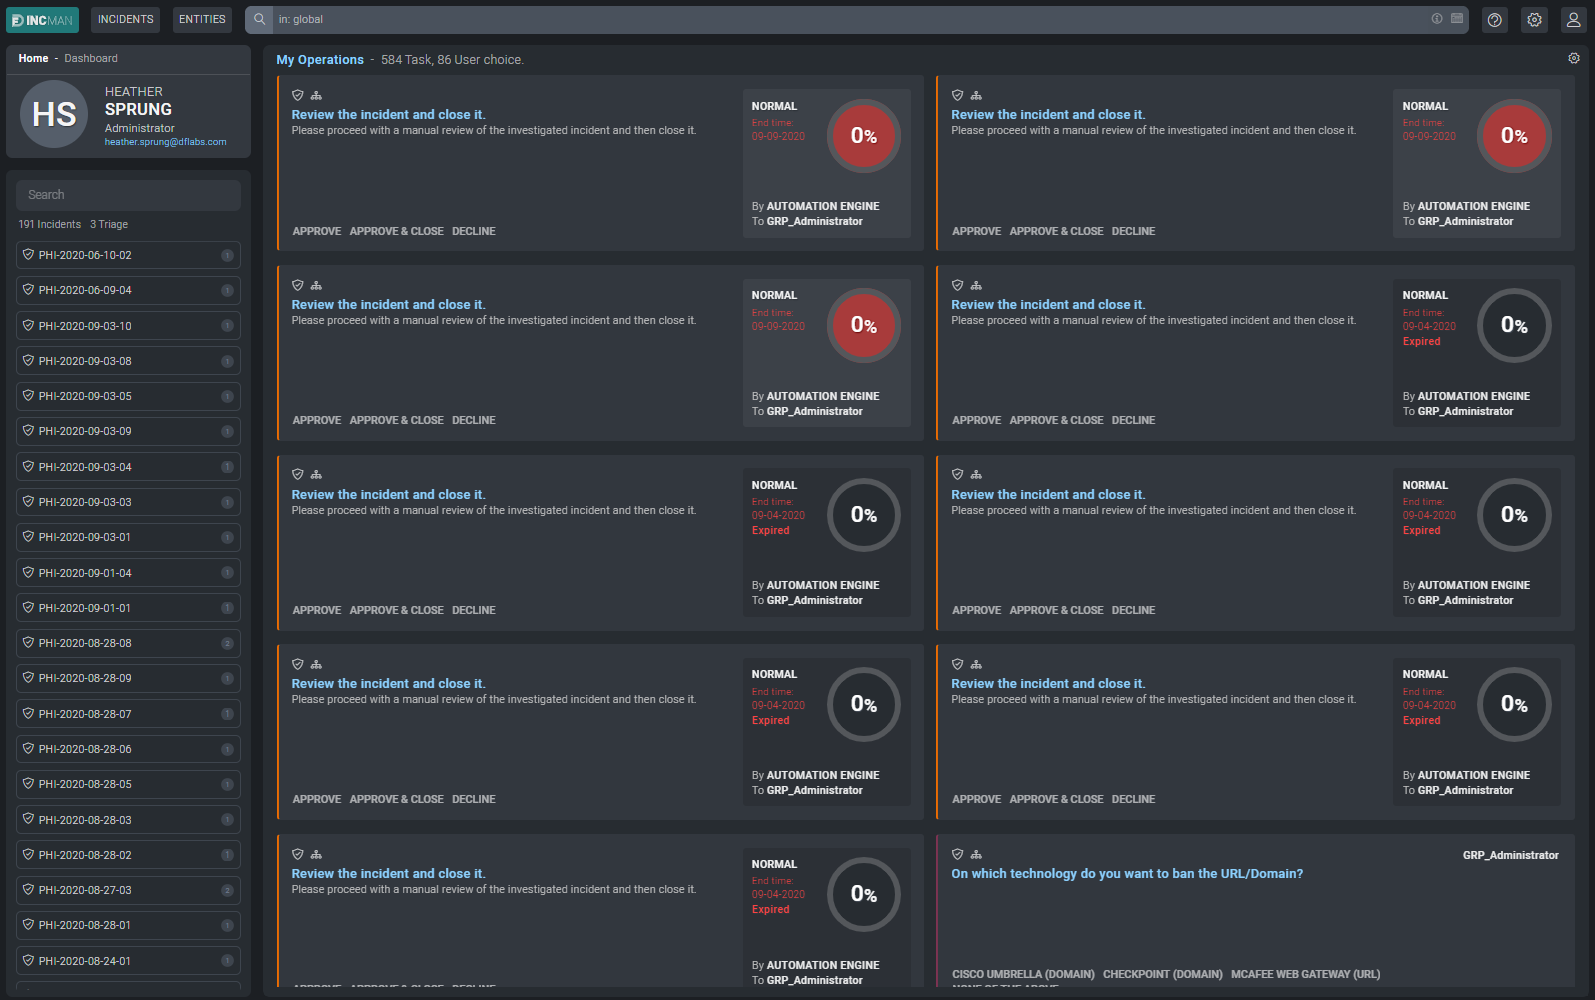
Home
The Home section is where all your current tasks reside. Here you can approve, decline, and close tasks as well as customize this section to display all tasks assigned to a specific user or group.
Dashboards
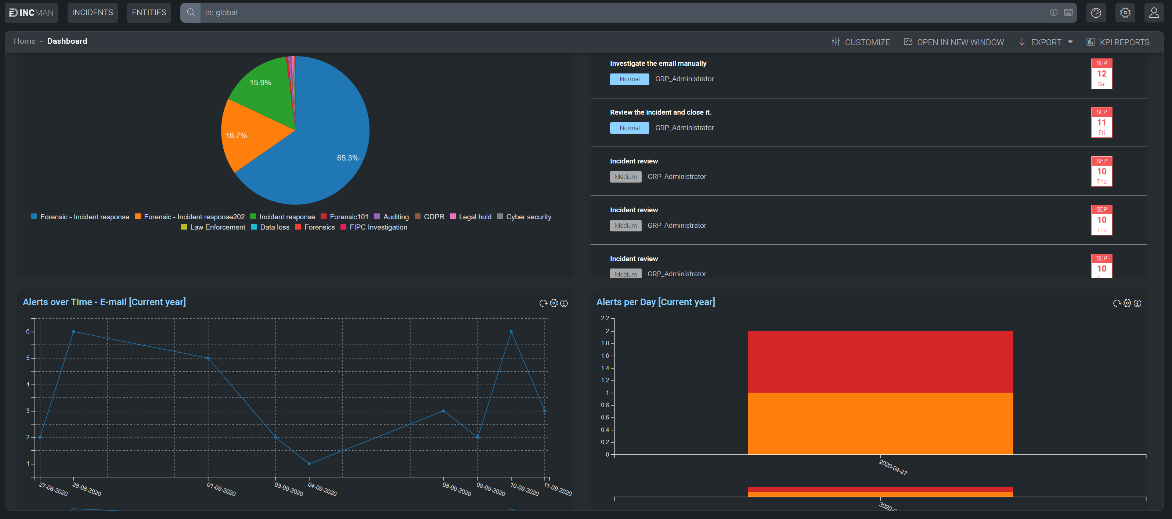
The Cloud SOAR Dashboard layout renders data for quick comprehension using a combination of graphics (e.g., charts, tables, graphs, and visual indicators) called Widgets. The data is helpful to security analysts tasked with incident handling and operational activities and provides supervisors and stakeholders a summary overview from which to derive strategic information.
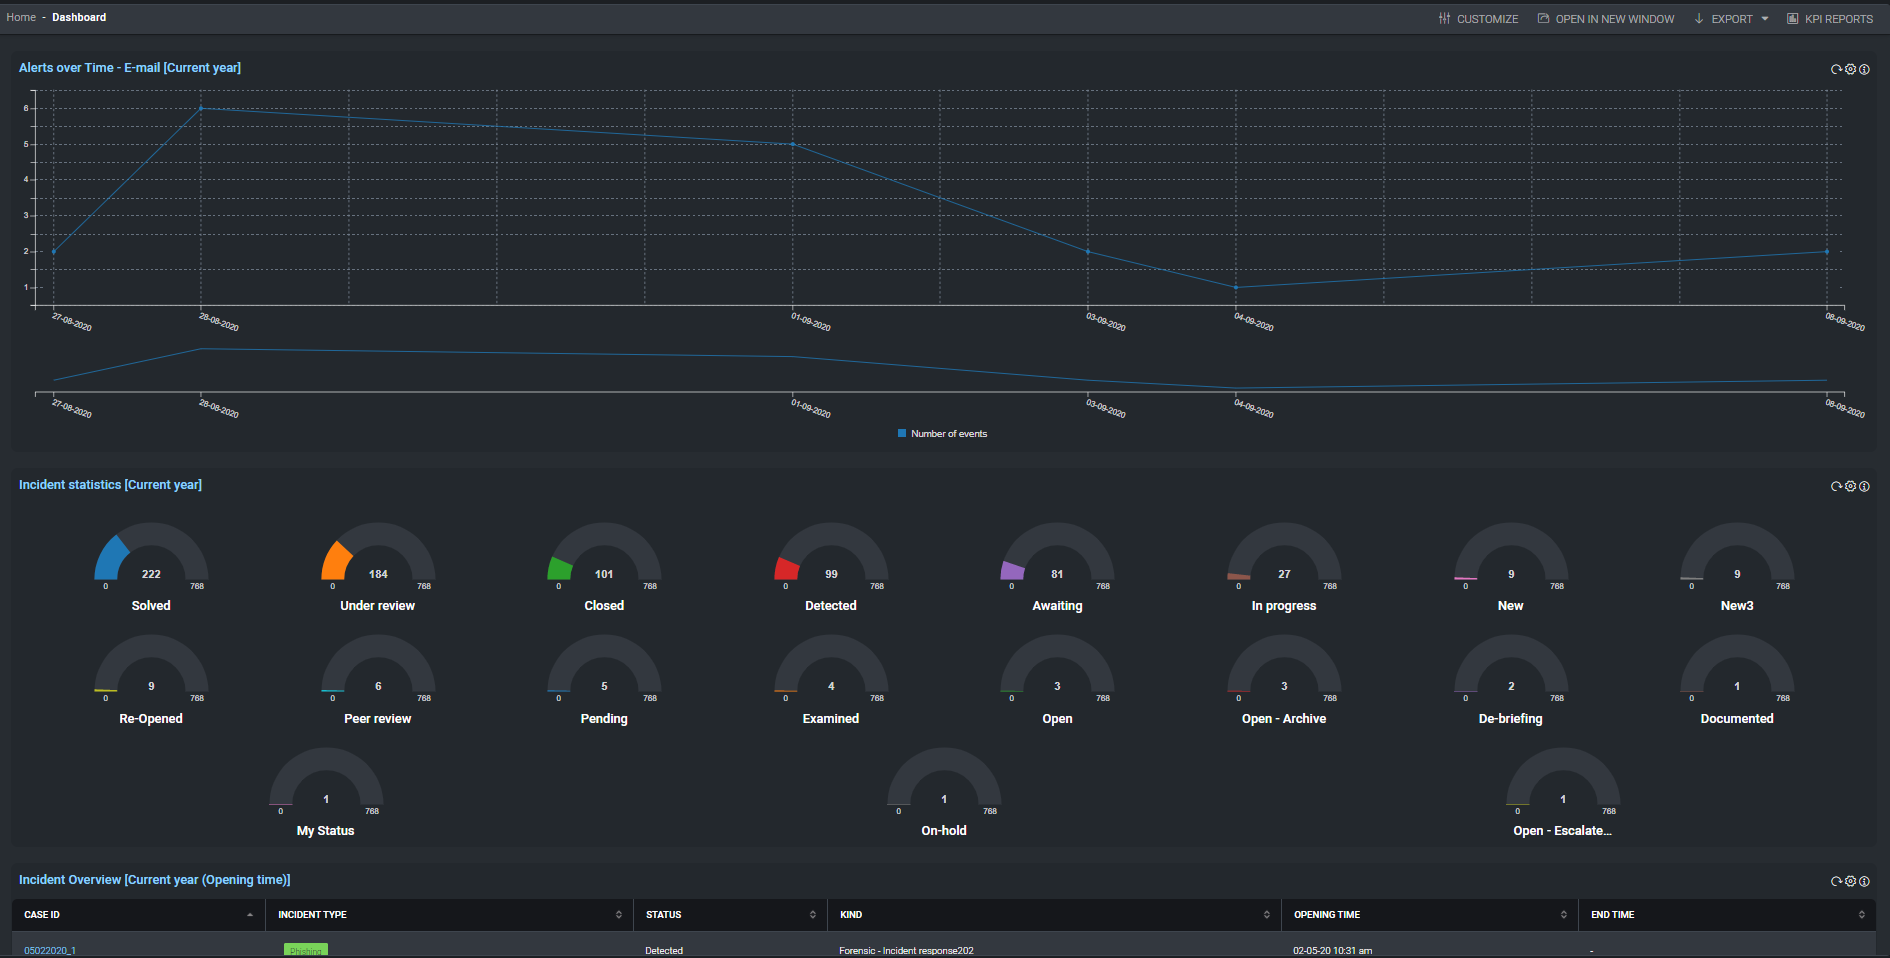
Cloud SOAR's dashboards section is used to highlight the most important pieces of data to the user or investigator who is logged into the platform. This data is presented through the use of multiple widgets that you can add, remove, and customize to include all data relevant to your job functions and duties.
To begin customizing the dashboard select the Customize button on the top of the screen. Once selected, a new configuration box will be displayed.
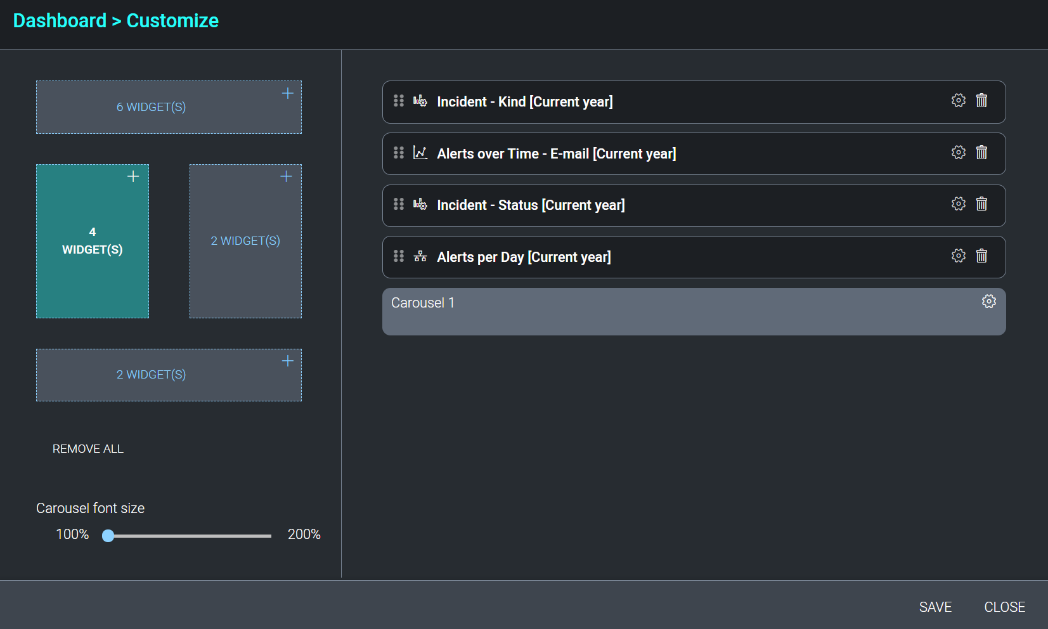
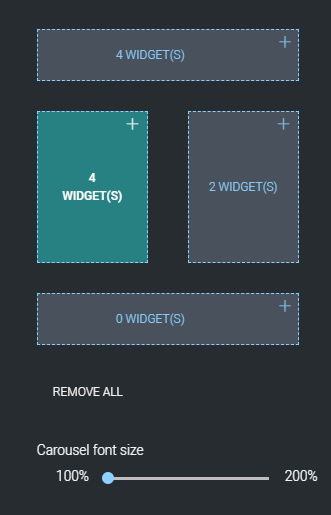
The widgets section on the left-side of the screen displays how the dashboard is structured. To begin adding widgets to the dashboard, click + on the desired section.
A new popup will be displayed with a list of all widget choices for the selected section. To add a new widget, click +.
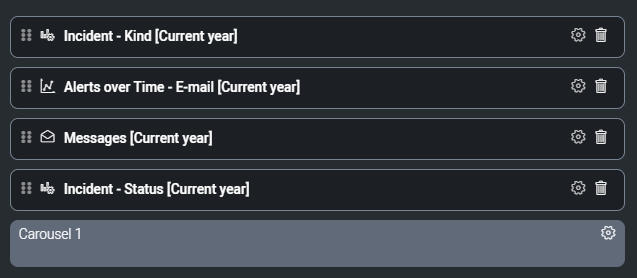
Once a widget is added to a section, they will be displayed on the right-side of the screen. To configure, click the cogwheel next to the widget to be customized. A new configuration screen will be displayed. These configuration screens will vary depending on the information it utilizes. Users have the option to add or remove filters and values, rename the section, as well as choose what data they would like to have displayed.
To change how the widgets appear in a section, you can drag and drop into the desired positions by clicking and holding the left-side of selection and dragging to a new location. Users can utilize Cloud SOAR's Carousel feature to cycle through different Dashboard displays on a SOC board to ensure constant visibility within the Cloud SOAR platform. Once the desired widgets have been added and configured, click save to commit.
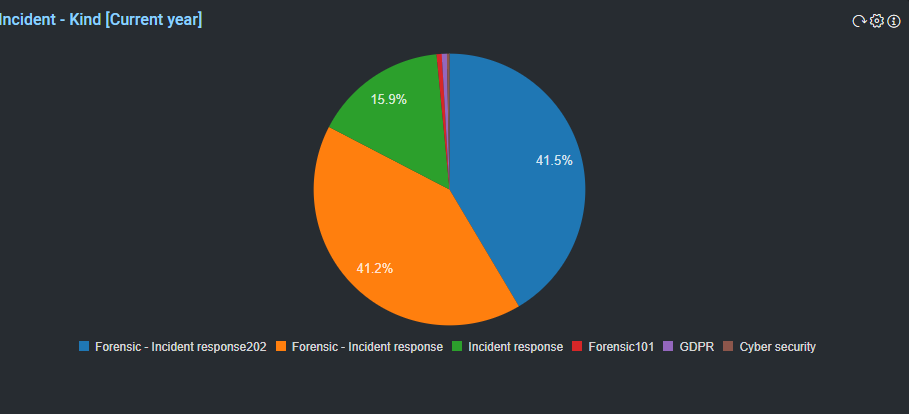
Most widgets inside of the Cloud SOAR dashboard are drillable. To drill down into a specific statistic, click on either an Incident ID or a section of a pie chart to limit the information shown to the areas of concern.
Make sure to allow popups from the Cloud SOAR site to drill into dashboard statistics.
You can also export Dashboards to an Excel spreadsheet or PDF document to include in reporting. To export a dashboard, select Export from the top of the dashboard screen and select which format to use. A new window will open with the requested document, which can either be saved to your machine or printed.

KPI Reports
Besides exporting dashboard statistics, users can also build KPI reports. To create a KPI report, click KPI Reports at the top of the screen next to the Export functionality. A new configuration box will be displayed.
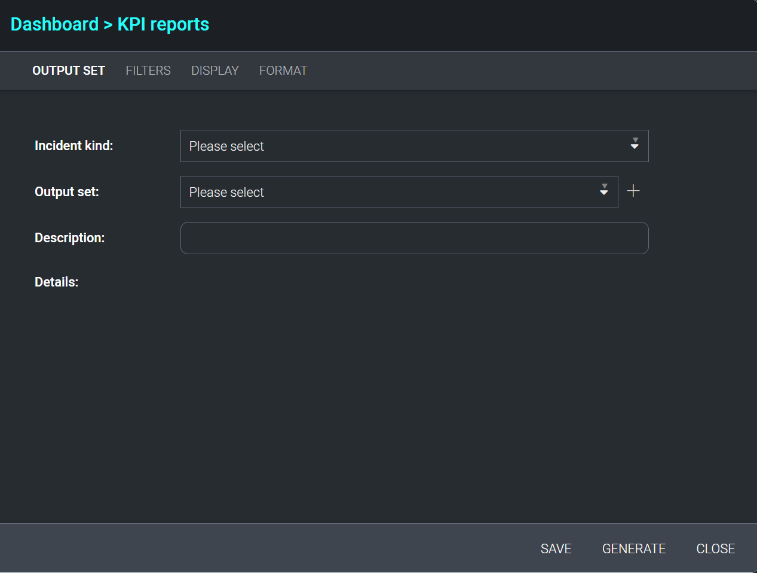
The Output Set tab allows users to select the incident kind they wish to run the KPI report for. The Output Set and Description fields allow the user to set these values for KPI reports they wish to save and generate again in the future.
The Filters tab allows users to filter the data which will be included in the KPI report by any number of incident attributes.
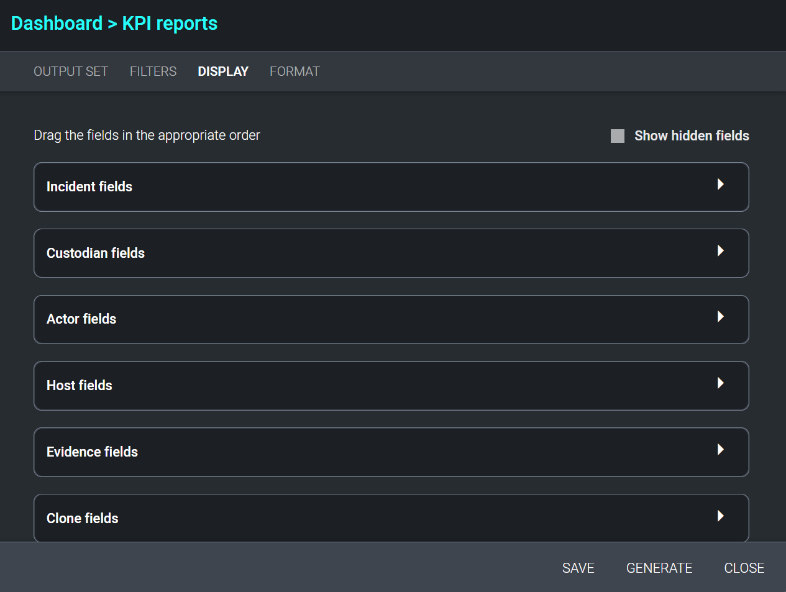
The Display tab allows users to select which fields will be shown in the KPI report. To include a field in the KPI report, check the checkbox next to the field name to be included. Field order can be changed by clicking on the six dots to the far left of the field name and dragging the field name up or down.
The Format tab allows users to select various formatting options, such as the sorting order and the file format (including PDF, PDF encrypted with an encryption key file, and Excel). Reports can also be scheduled to automatically run at a defined interval from this section.
Once the report is built, click Generate to run the report or Save to create the KPI report template.
KPI Output Sets can also be generated using the Cloud SOAR API. Please see the API manual for additional details.
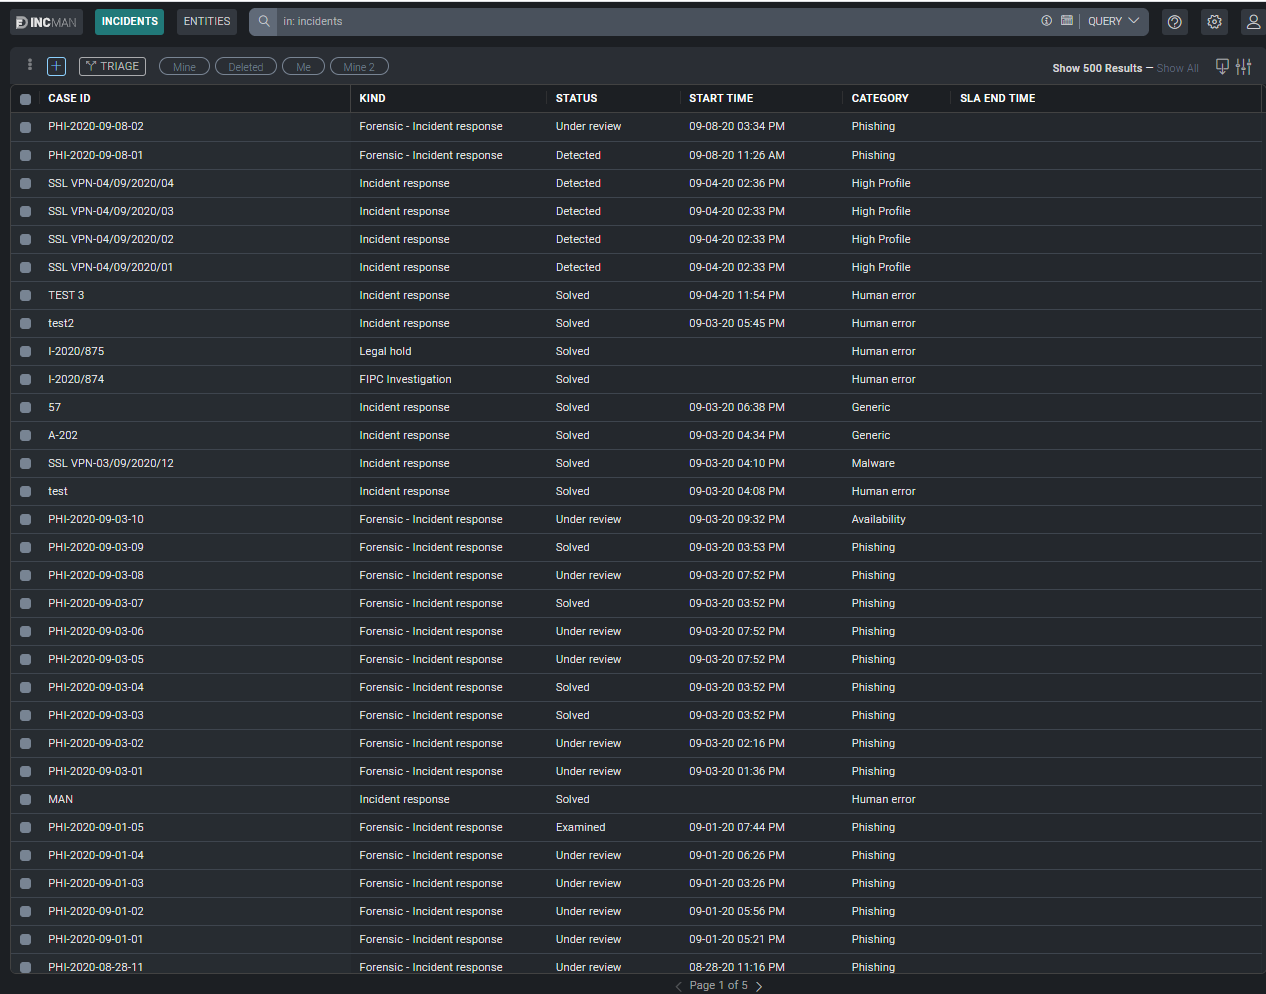
Incidents
All current and previous incidents can be found in the Incidents
section. Incidents can be sorted, filtered, and accessed here. 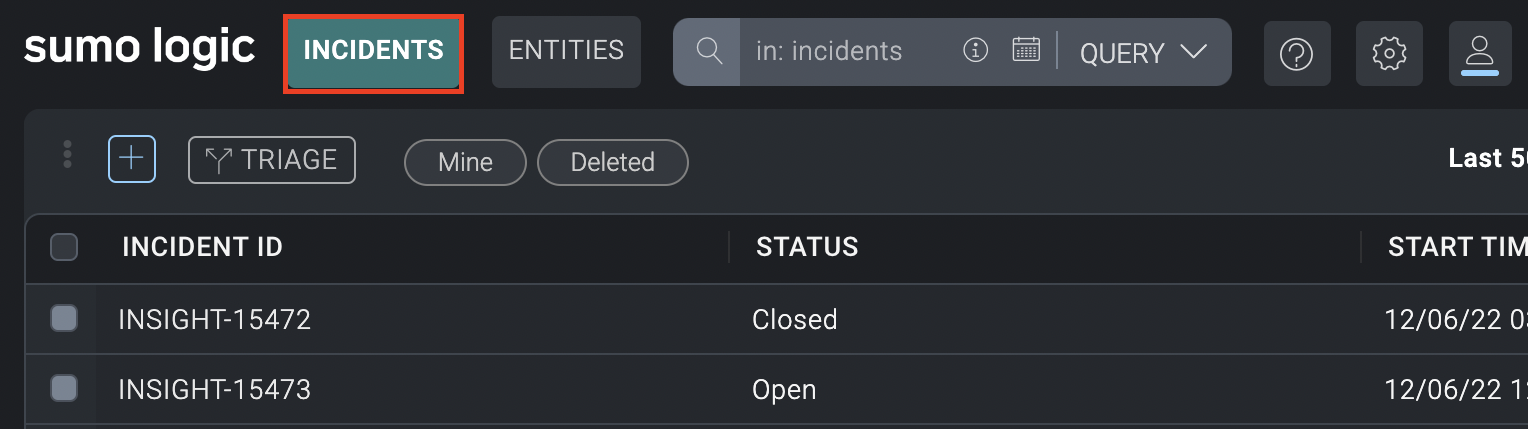
Opening an individual incident will allow you to interact with all aspects of the incident permitted by your assigned Incident Profile.
You can also add incidents manually from the Incidents section for incidents which were not created automatically through another process.
Triage
The Triage module ingests events via the Cloud SOAR API and can be used to triage events that may be unverified or have a low confidence level before they are converted to incidents. The Triage module can be completely customized for use cases from financial fraud to network IDS alerts.
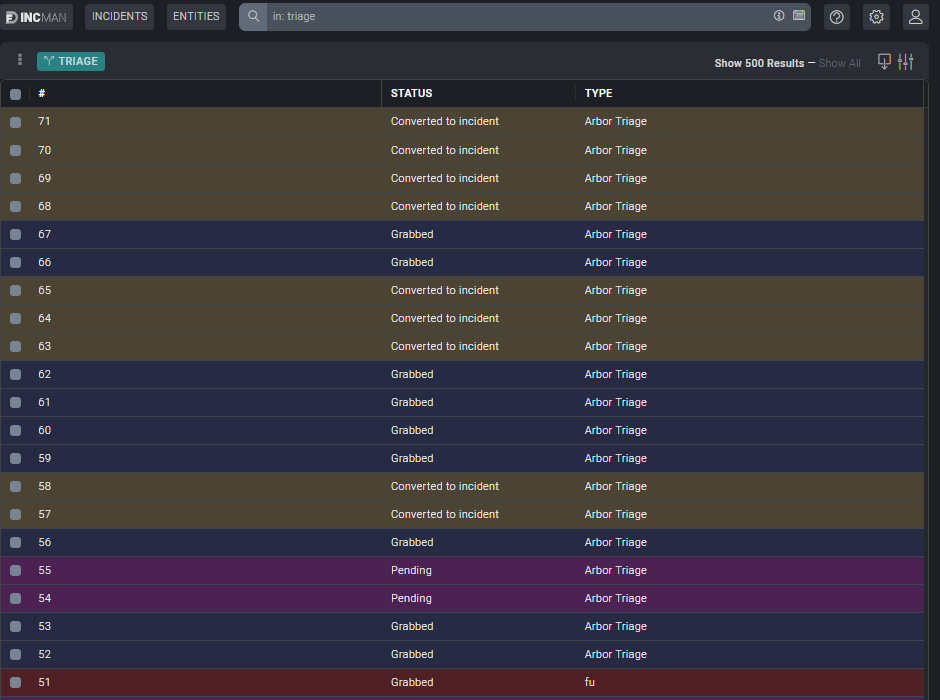
For more information, refer to Incidents and Triage.
Entities
The Entities tab provides access to data from across all incidents, as well as other information which can be stored within Cloud SOAR.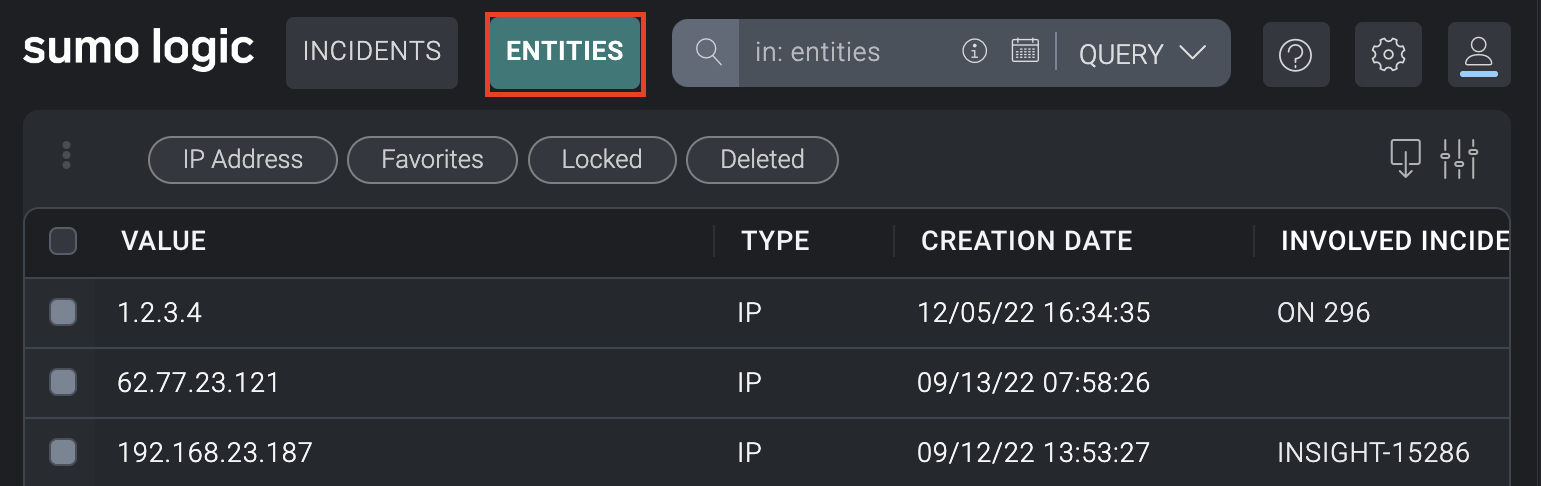
Observables from every incident can be found in this section, along with any enrichment data associated with these data types and the incidents they were reported in. You'll find all variables including artifacts related to an incident. Clicking on an entity in the entity list will display the results of any previous actions taken on the entity, or where in the incident the entity was extracted.
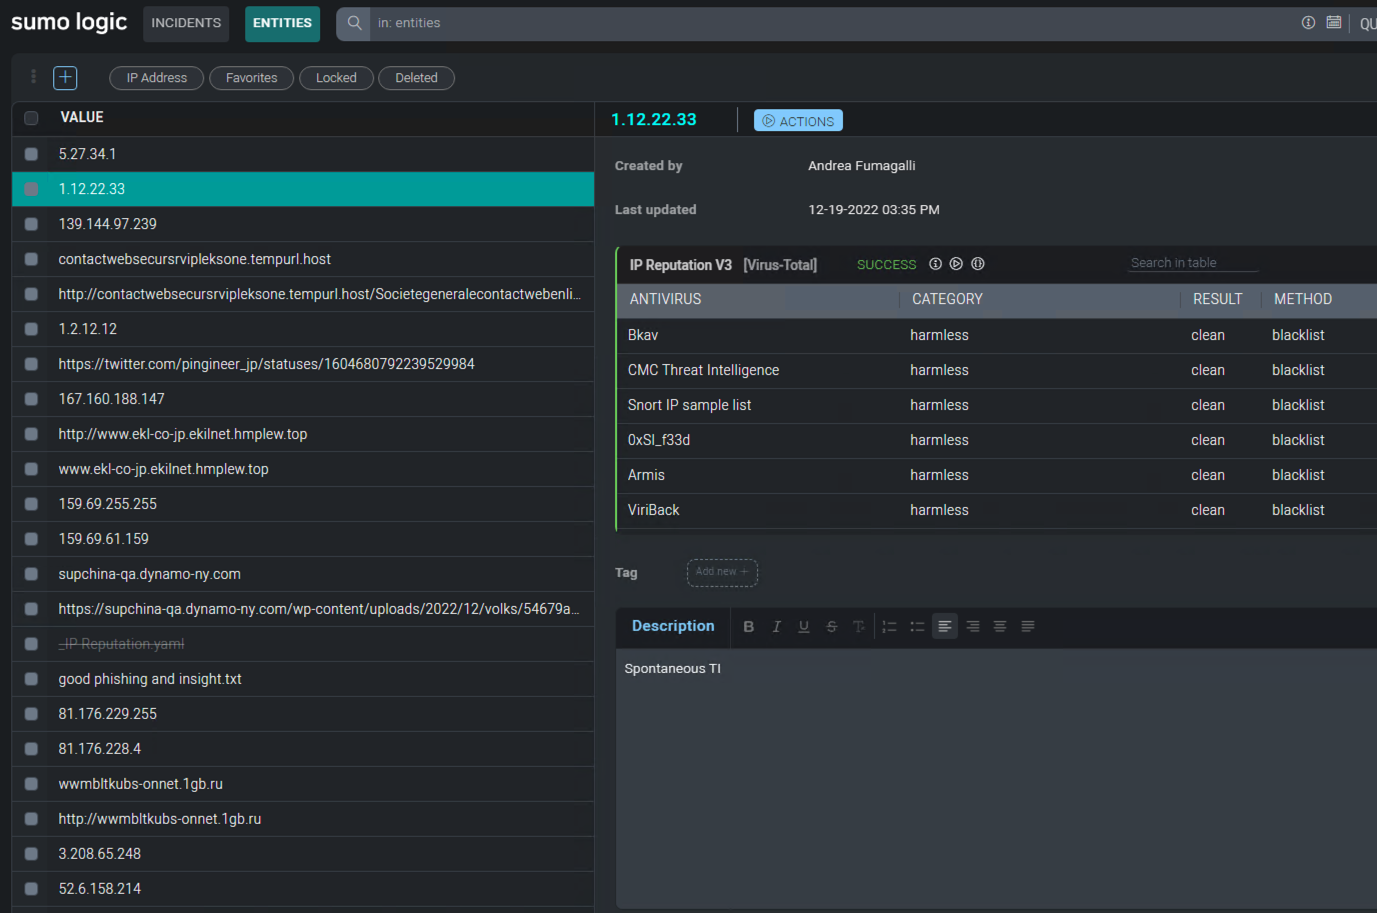
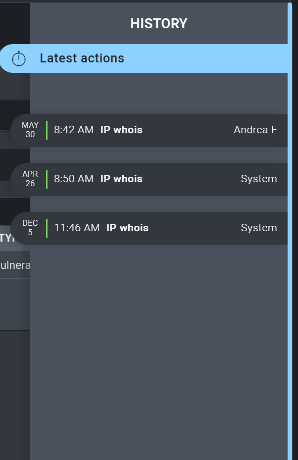
A timeline of actions taken on the entity can be displayed on the far right-hand corner of the screen by clicking on the stopwatch symbol. Hover over the date tabs to expand the timeline and see additional information about the actions taken on each date.
While any observable is selected, a menu bar will be available in the top right-hand corner of the screen which allows users to perform certain actions on the observable.
![]()
- Lock: Lock the observable to prevent any actions from being taken on it. This may be useful if you want to ensure that no enrichment actions are taken on attacker-controlled infrastructure or that an observable is not accidentally blocked.
- Delete: Delete the observable.
- Mark as Favorite: Mark the observable as a favorite and move it to the top of the observables list.
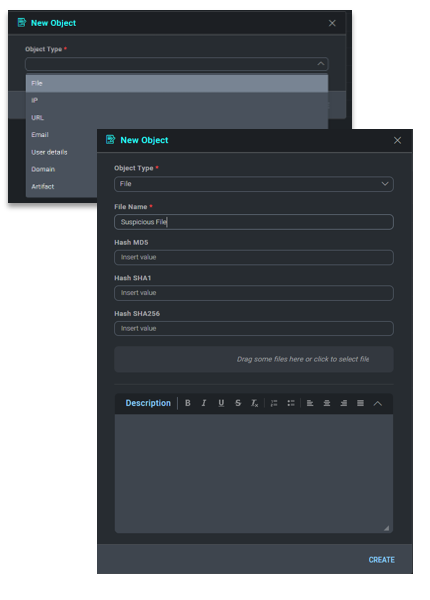
Adding a New Entity
To add a new entity, click the + sign at the top of the screen and a new configuration box will be displayed. Select an entity type from the dropdown menu and an additional configuration box will be displayed. This configuration box allows the user to input information about the entity, such as adding a file or its file hash. Once the entity is created, click Create to continue.
Documentation
The Documentation section provides investigators with an area to document all steps taken during an incident's investigation. The following tools are available across the entire Cloud SOAR platform as well as on an individual incident level:
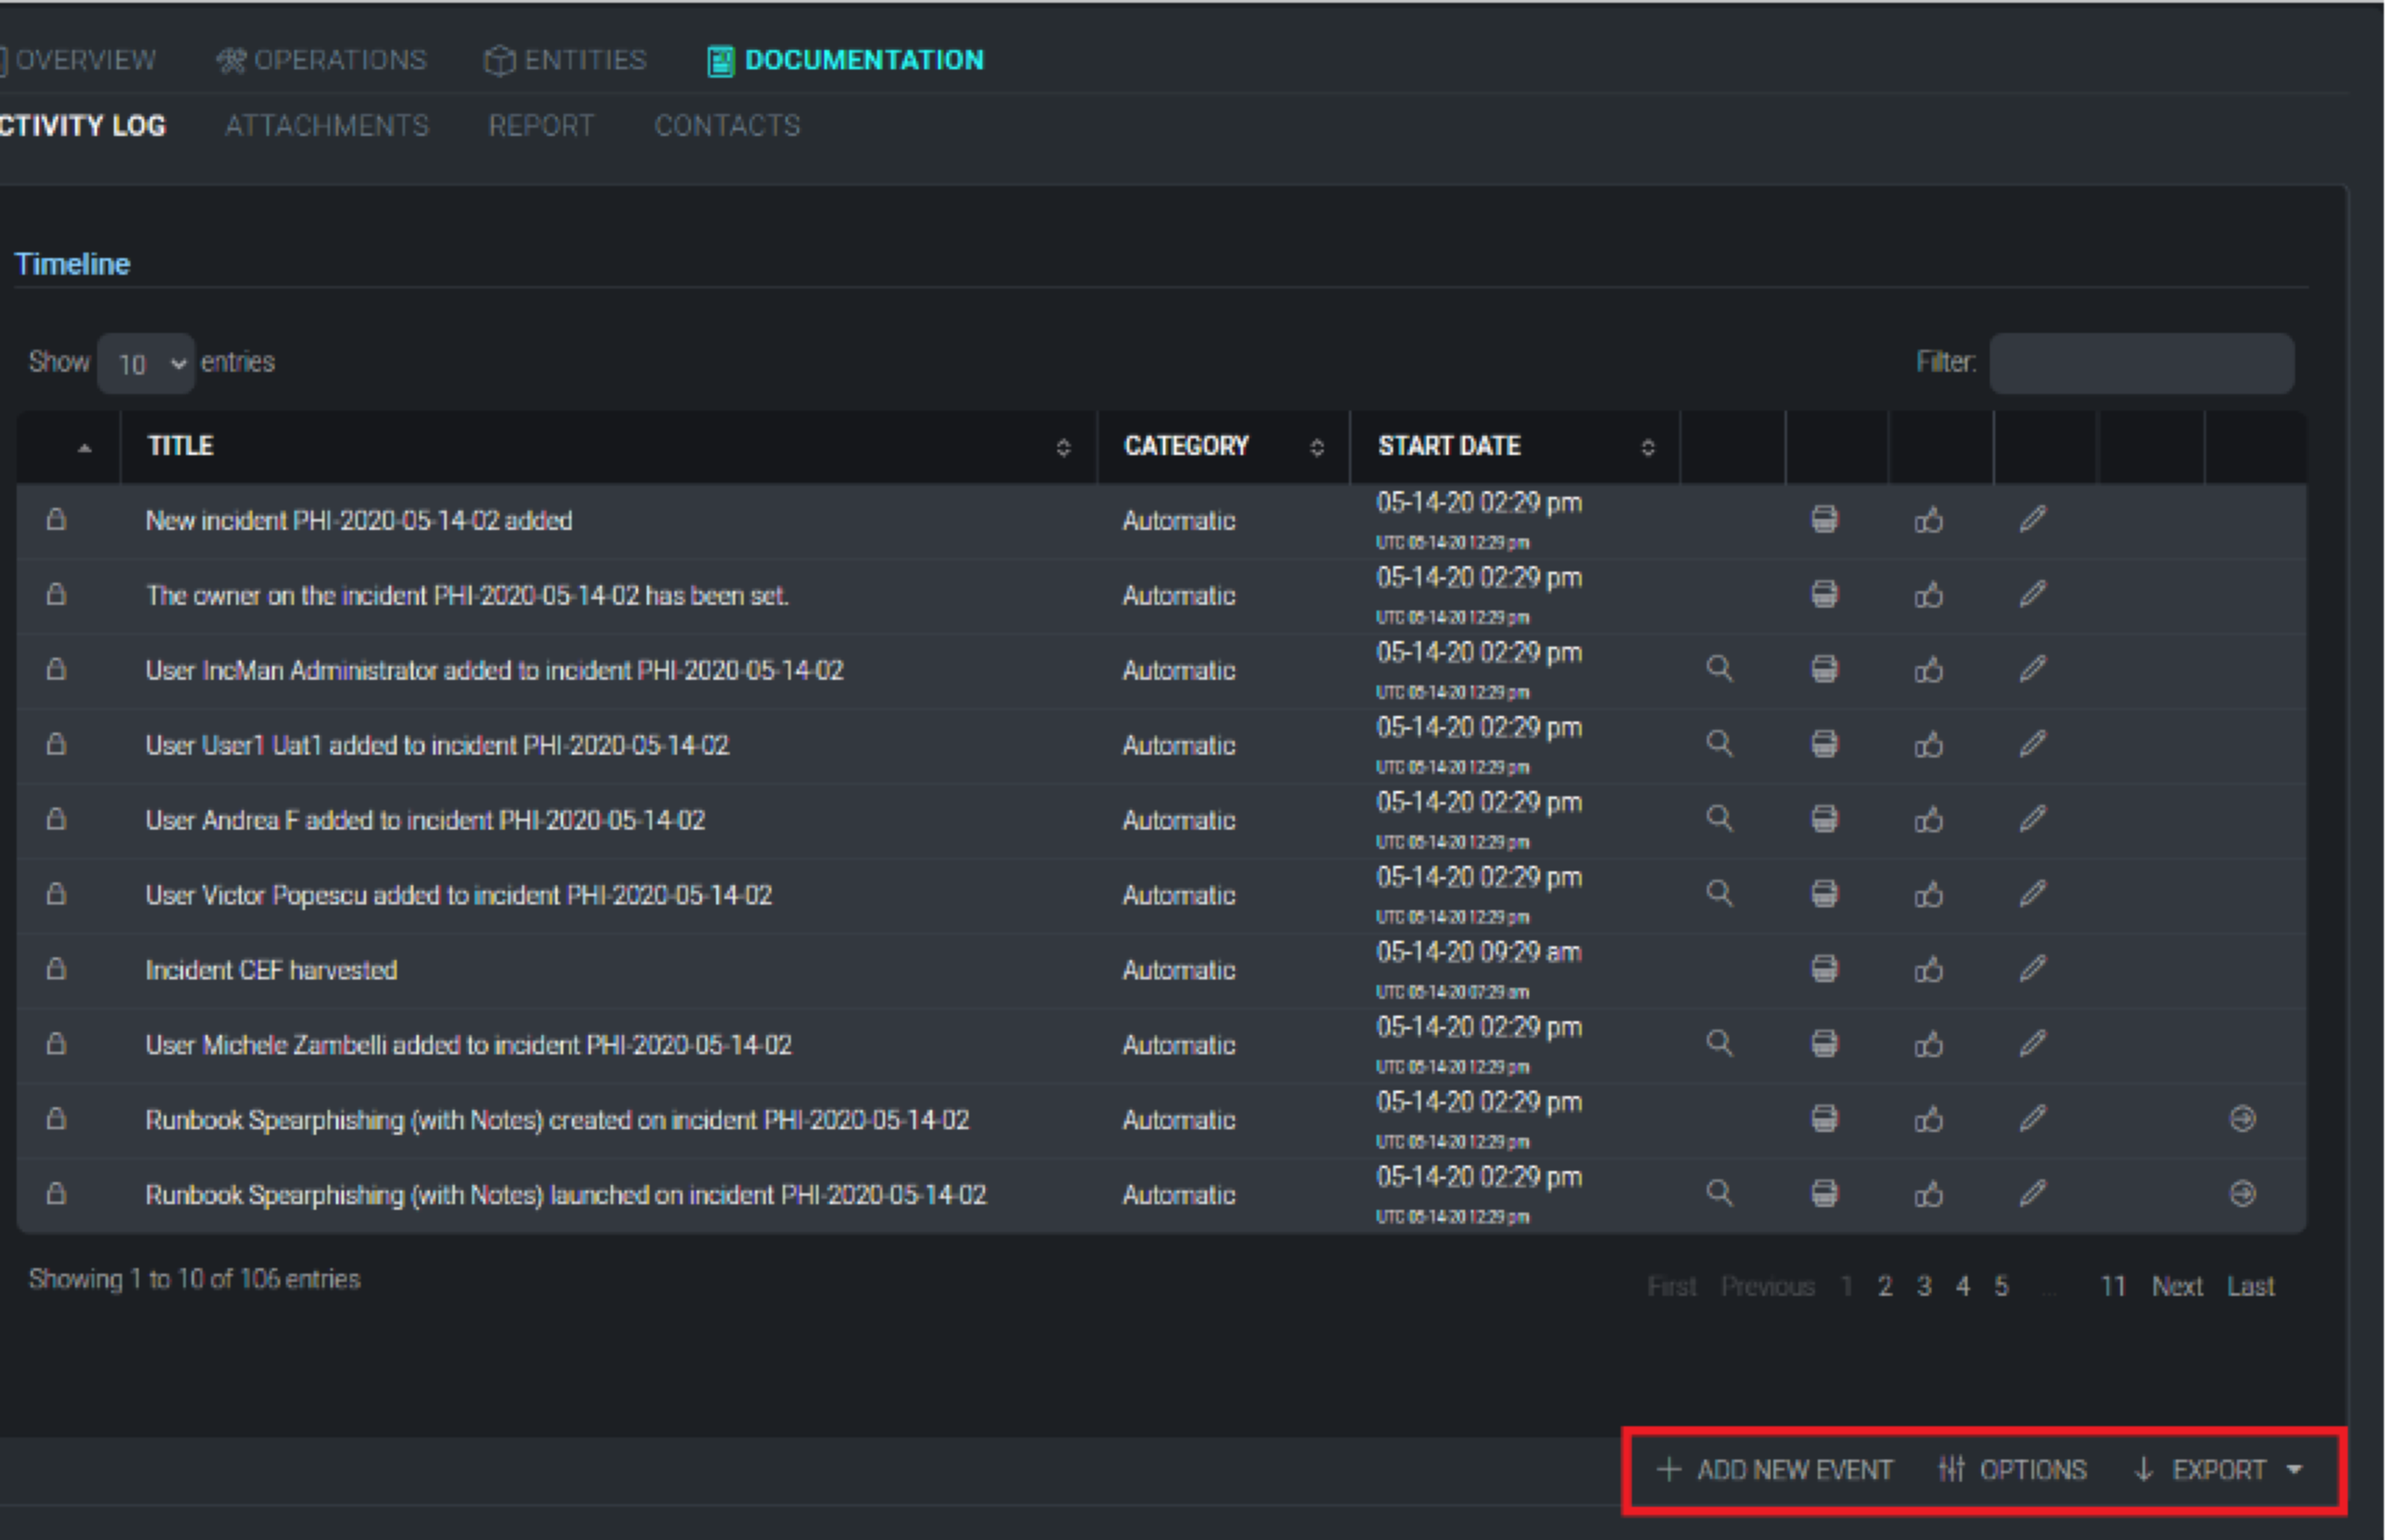
Activity Log
Cloud SOAR records a detailed audit log of all activity that is performed during an incident. A timeline of incident activity can be viewed in the incident Timeline section. Each incident has its own timeline and the events are classified under two categories: automatic if generated automatically by the system, or manual when created by the user.
To manually create a new timeline event, click +Add New Event from the top of the timeline screen.
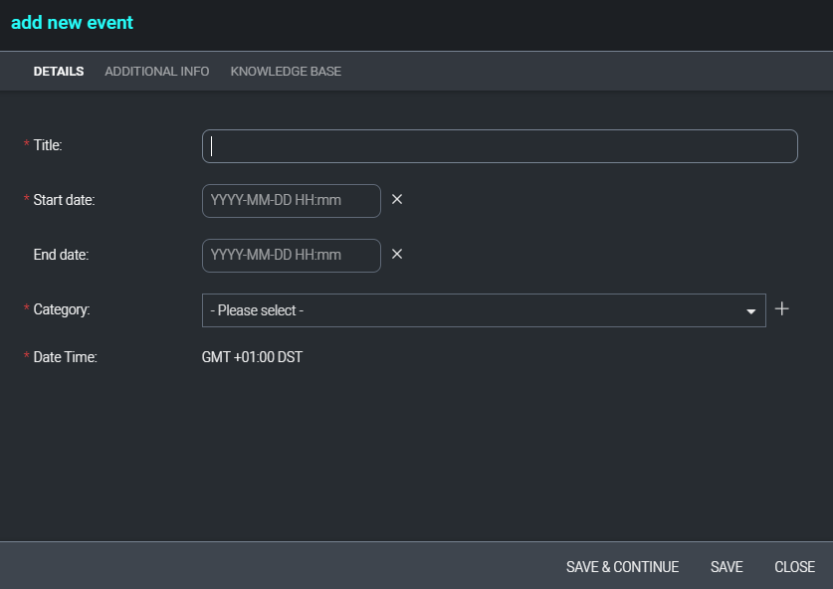
A new configuration box will be displayed. Title the event and choose what category the event falls into. (Please note, these categories can be edited under the Custom Fields section). Add any additional information necessary and associate an existing knowledge base article where applicable.
Once the event is created, users will see an additional list of options to the right of the event, they are as follows:
- Use event data in reports
- Mark event has irrelevant
- Edit the event
- Export event details
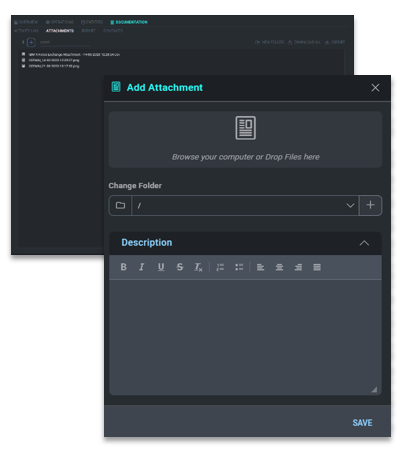
Attachments
The Attachments section is a repository for investigators to use to house attachments related to an incident's investigation. The source of this data can vary but will often be the output of monitoring tools and supporting documents. For each record, users can define:
- Reference: an identifier for what the record refers to;
- Date: a timestamp for when the record was uploaded;
- Application: information about the system or application used to generate the record;
- Short description: a free-form textual description of the record; and,
- Parent folder: employed if arranging various records in a tree structure for logical classification.
As with our other documentation tools, attachments can also be added as a timeline event and associated with a knowledge base article.
Final Incident Reports
The Final Incident Report section allows users to upload a pre-configured basedoc to be used for final incident reports. Users can choose to use an existing basedoc or upload a new one by selecting from the basedoc selections at the bottom of the screen.
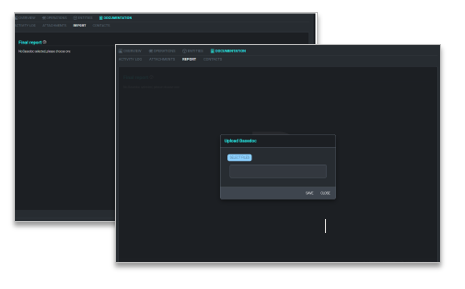
To add a new basedoc, click Upload Basedoc and select the template to use and click Save. Once the document has been uploaded users can choose which sections or tags to use in the report. These tags act as placeholders which will be filled in with the incident's details each time an incident report is executed.
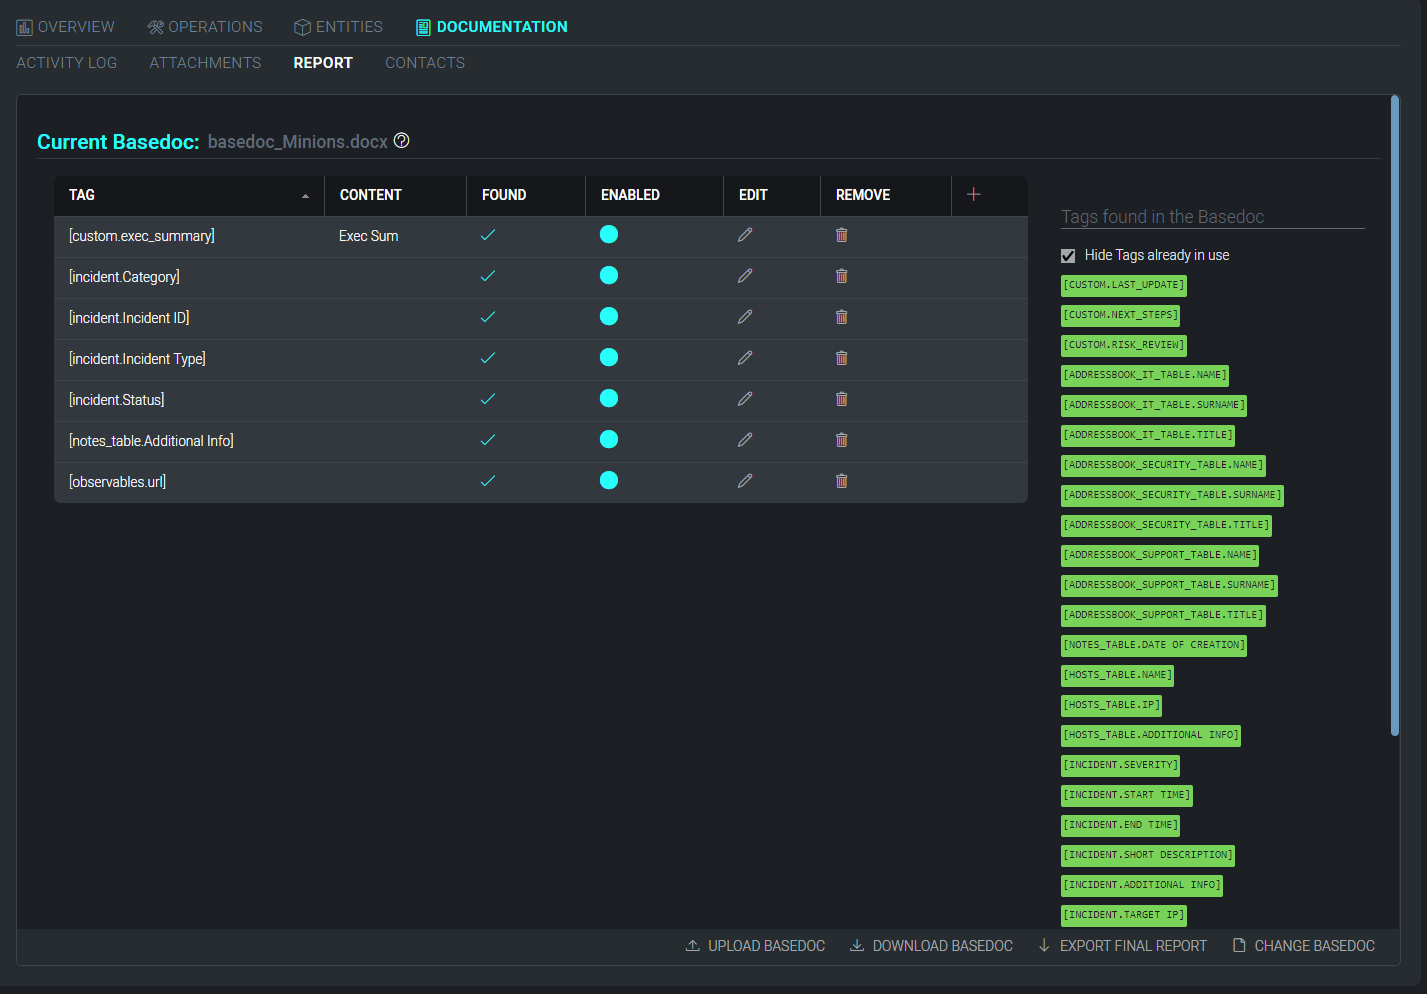
To add tags to the incident report, double click the tag from the right-side of the screen and it will be added to the tagging section for configuration. Once the tag is added, users can either edit the tag or remove unnecessary ones before executing the final report. Once finished, click Export Final Report at the bottom of the screen.
Custom Reports
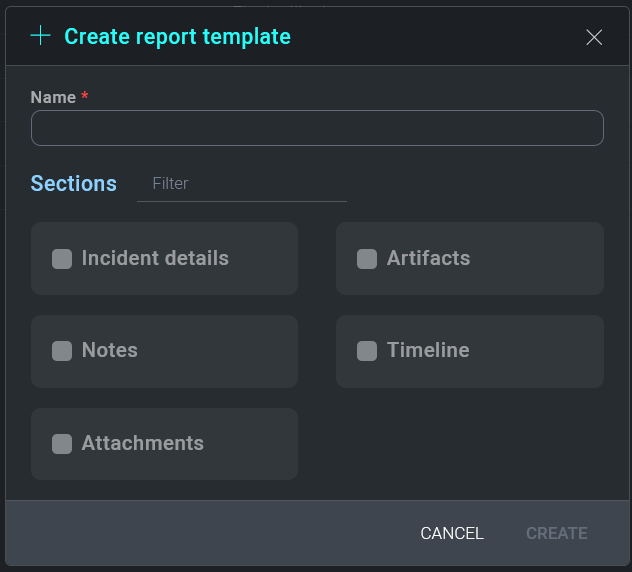
Custom report templates can be defined by navigating to Configurations > Customizations > Report Template. The left pane of the Report Template screen contains a list of all current report templates. To add a new report template, click on the + icon above the report template list.
The Details tab of the new report template window allows the user to specify a unique name for the template as well as a template category and any appropriate tags.
The Sections tab of the new report template window allows users to drag and drop sections of the incident in to the report template. All incident sections are listed in the left-hand pane. Dragging incident sections to the right-hand pane will add the section to the report template. Sections will be printed in the report in the order they appear in the right-hand pane.
Once a report template has been defined, it can be generated by selecting Custom Report from the Export menu. Users may add a password or watermark to the custom report, which may be generated in PDF or Word Document format.
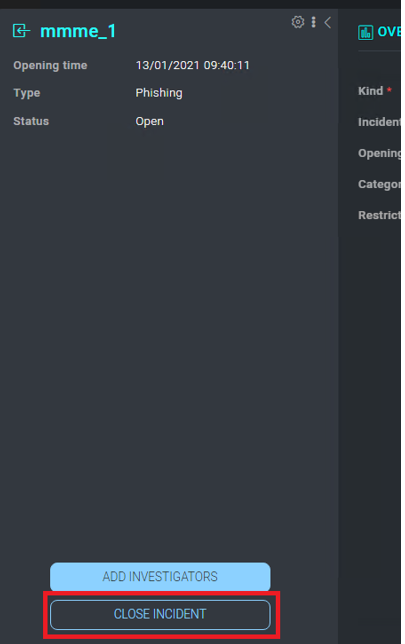
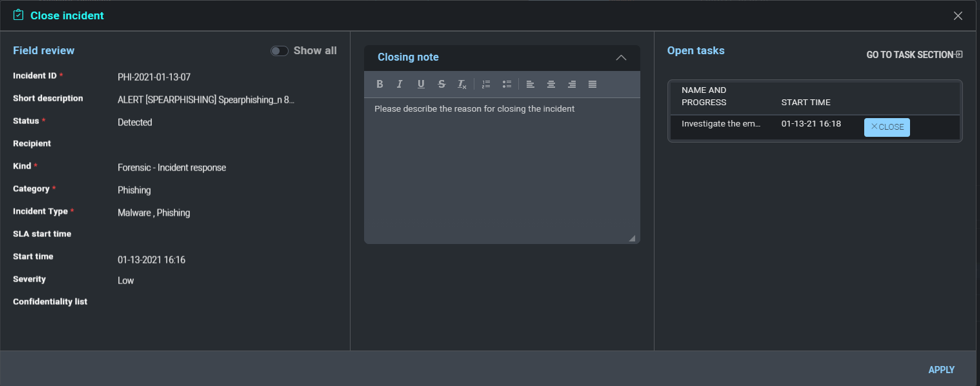
Closing Note
Closing incident will result in asking a note for incident closing as below: