Cloud SOAR Incident Management and Triage
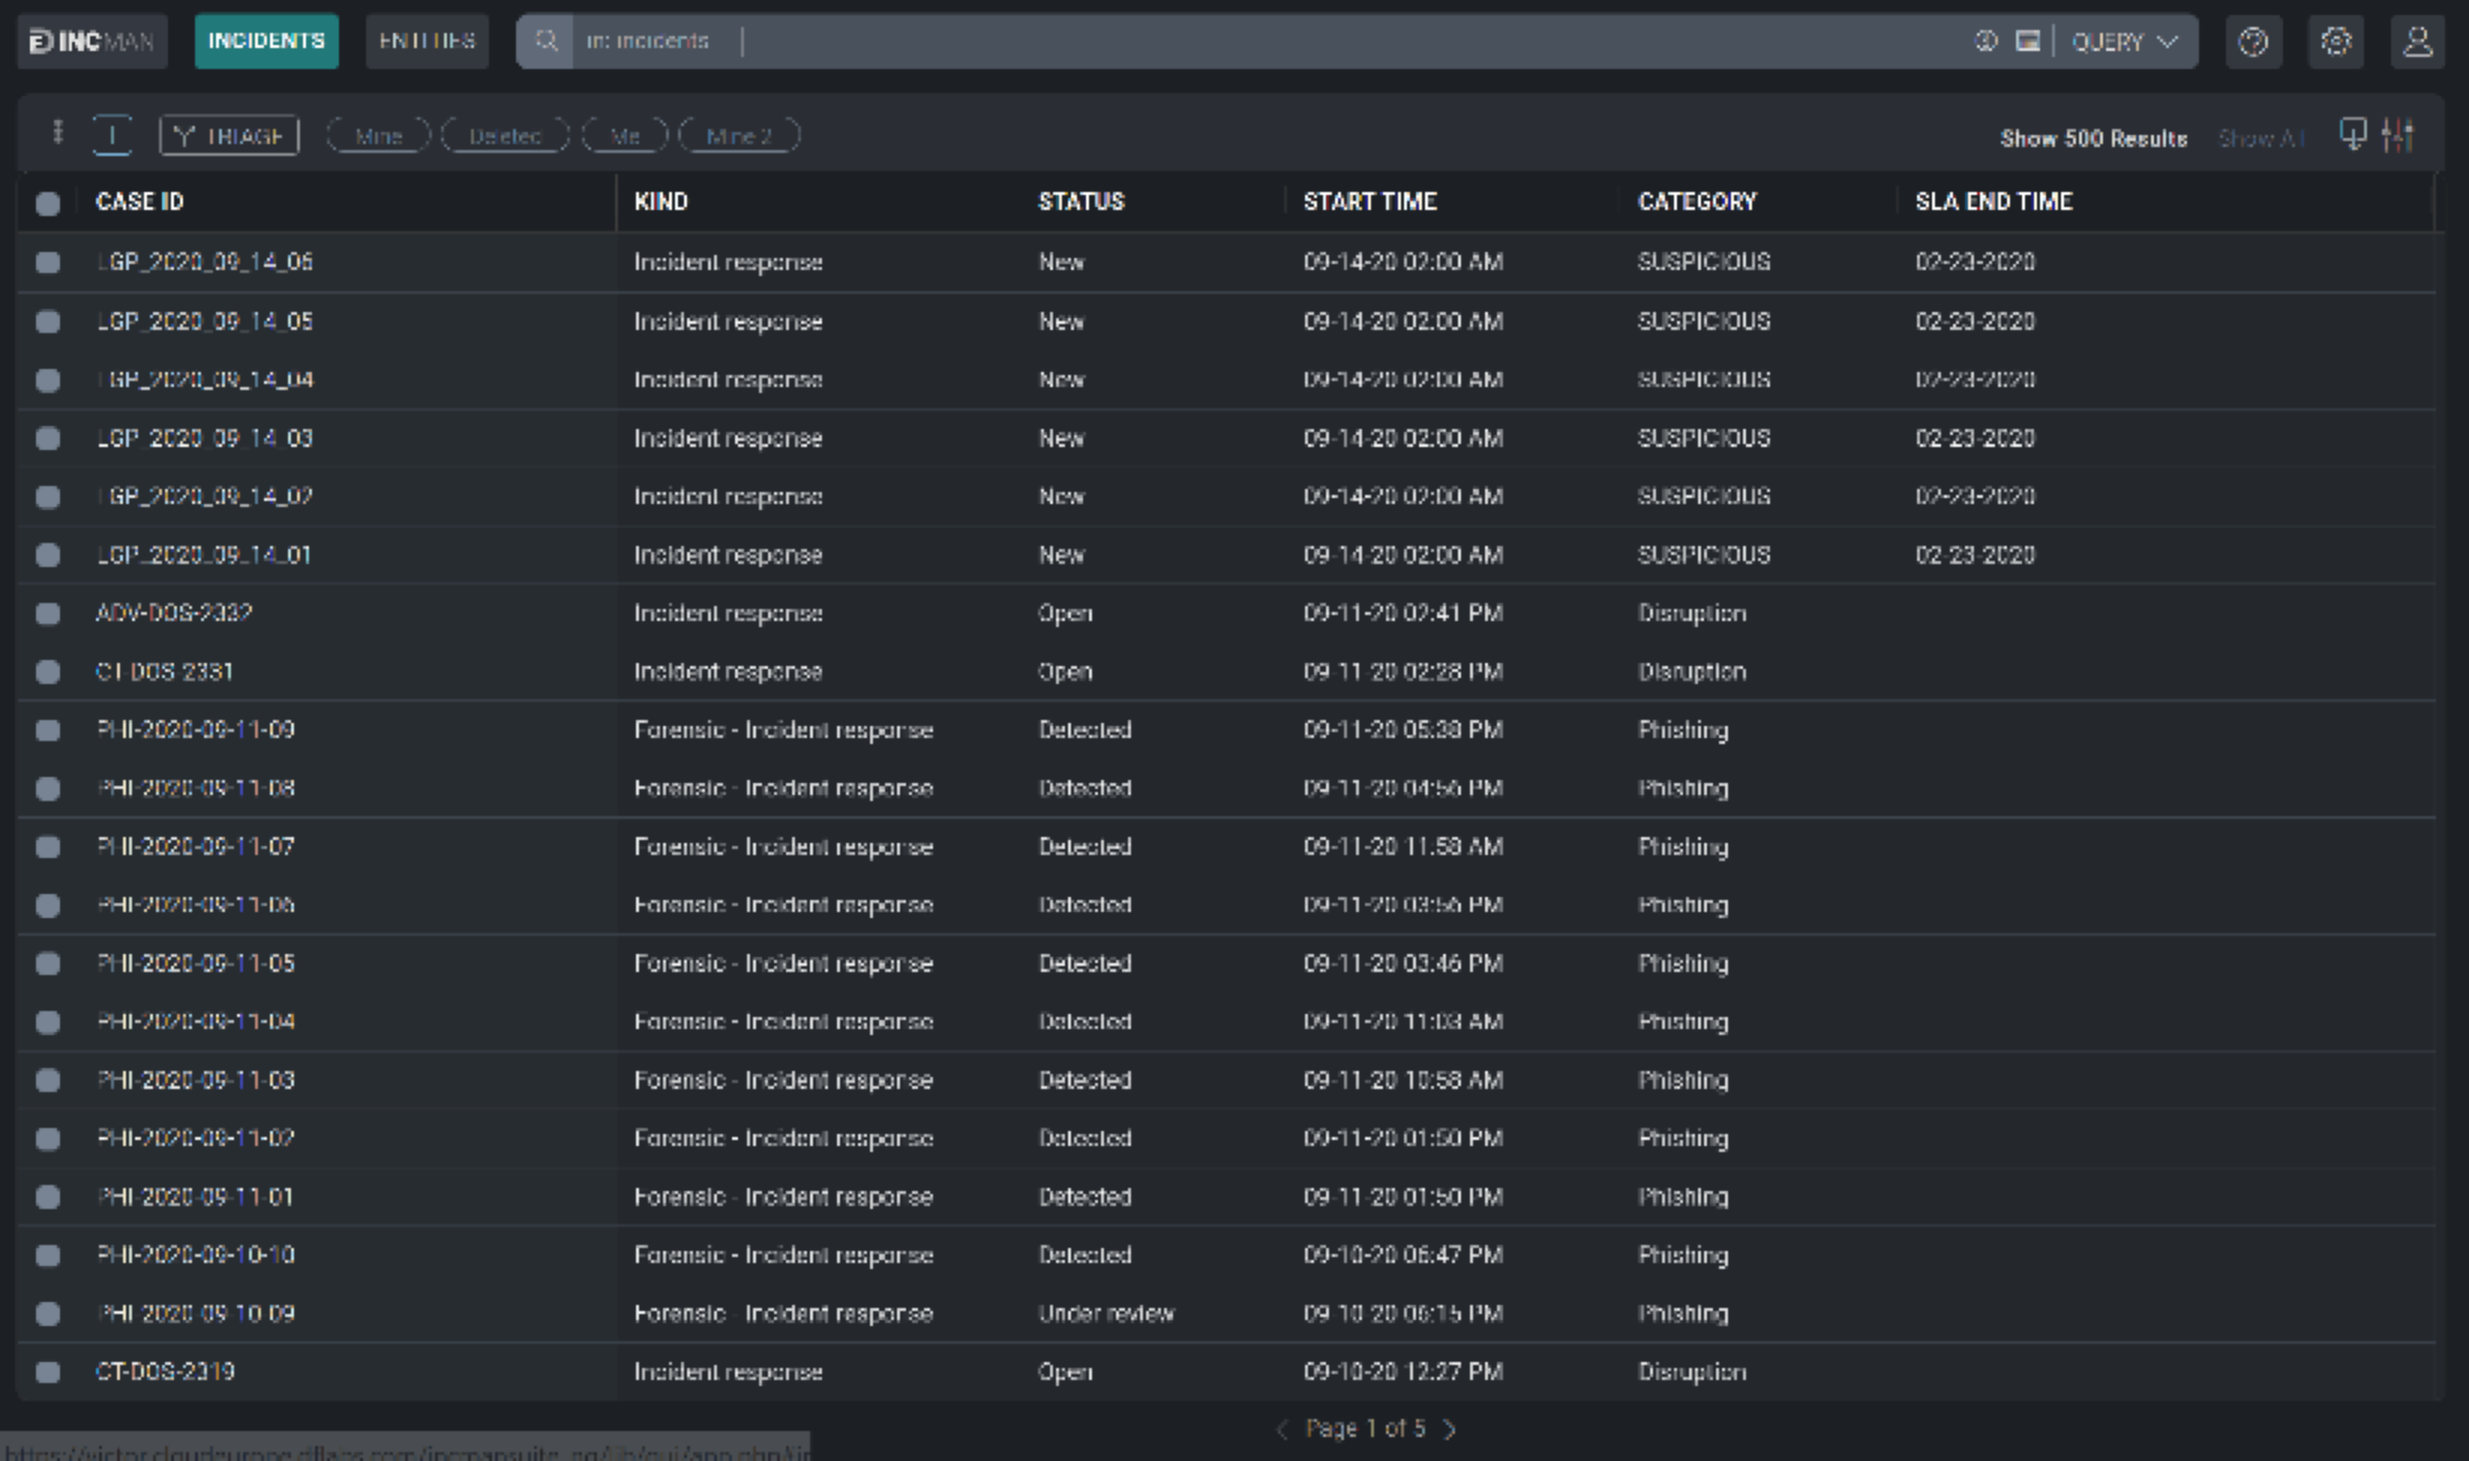
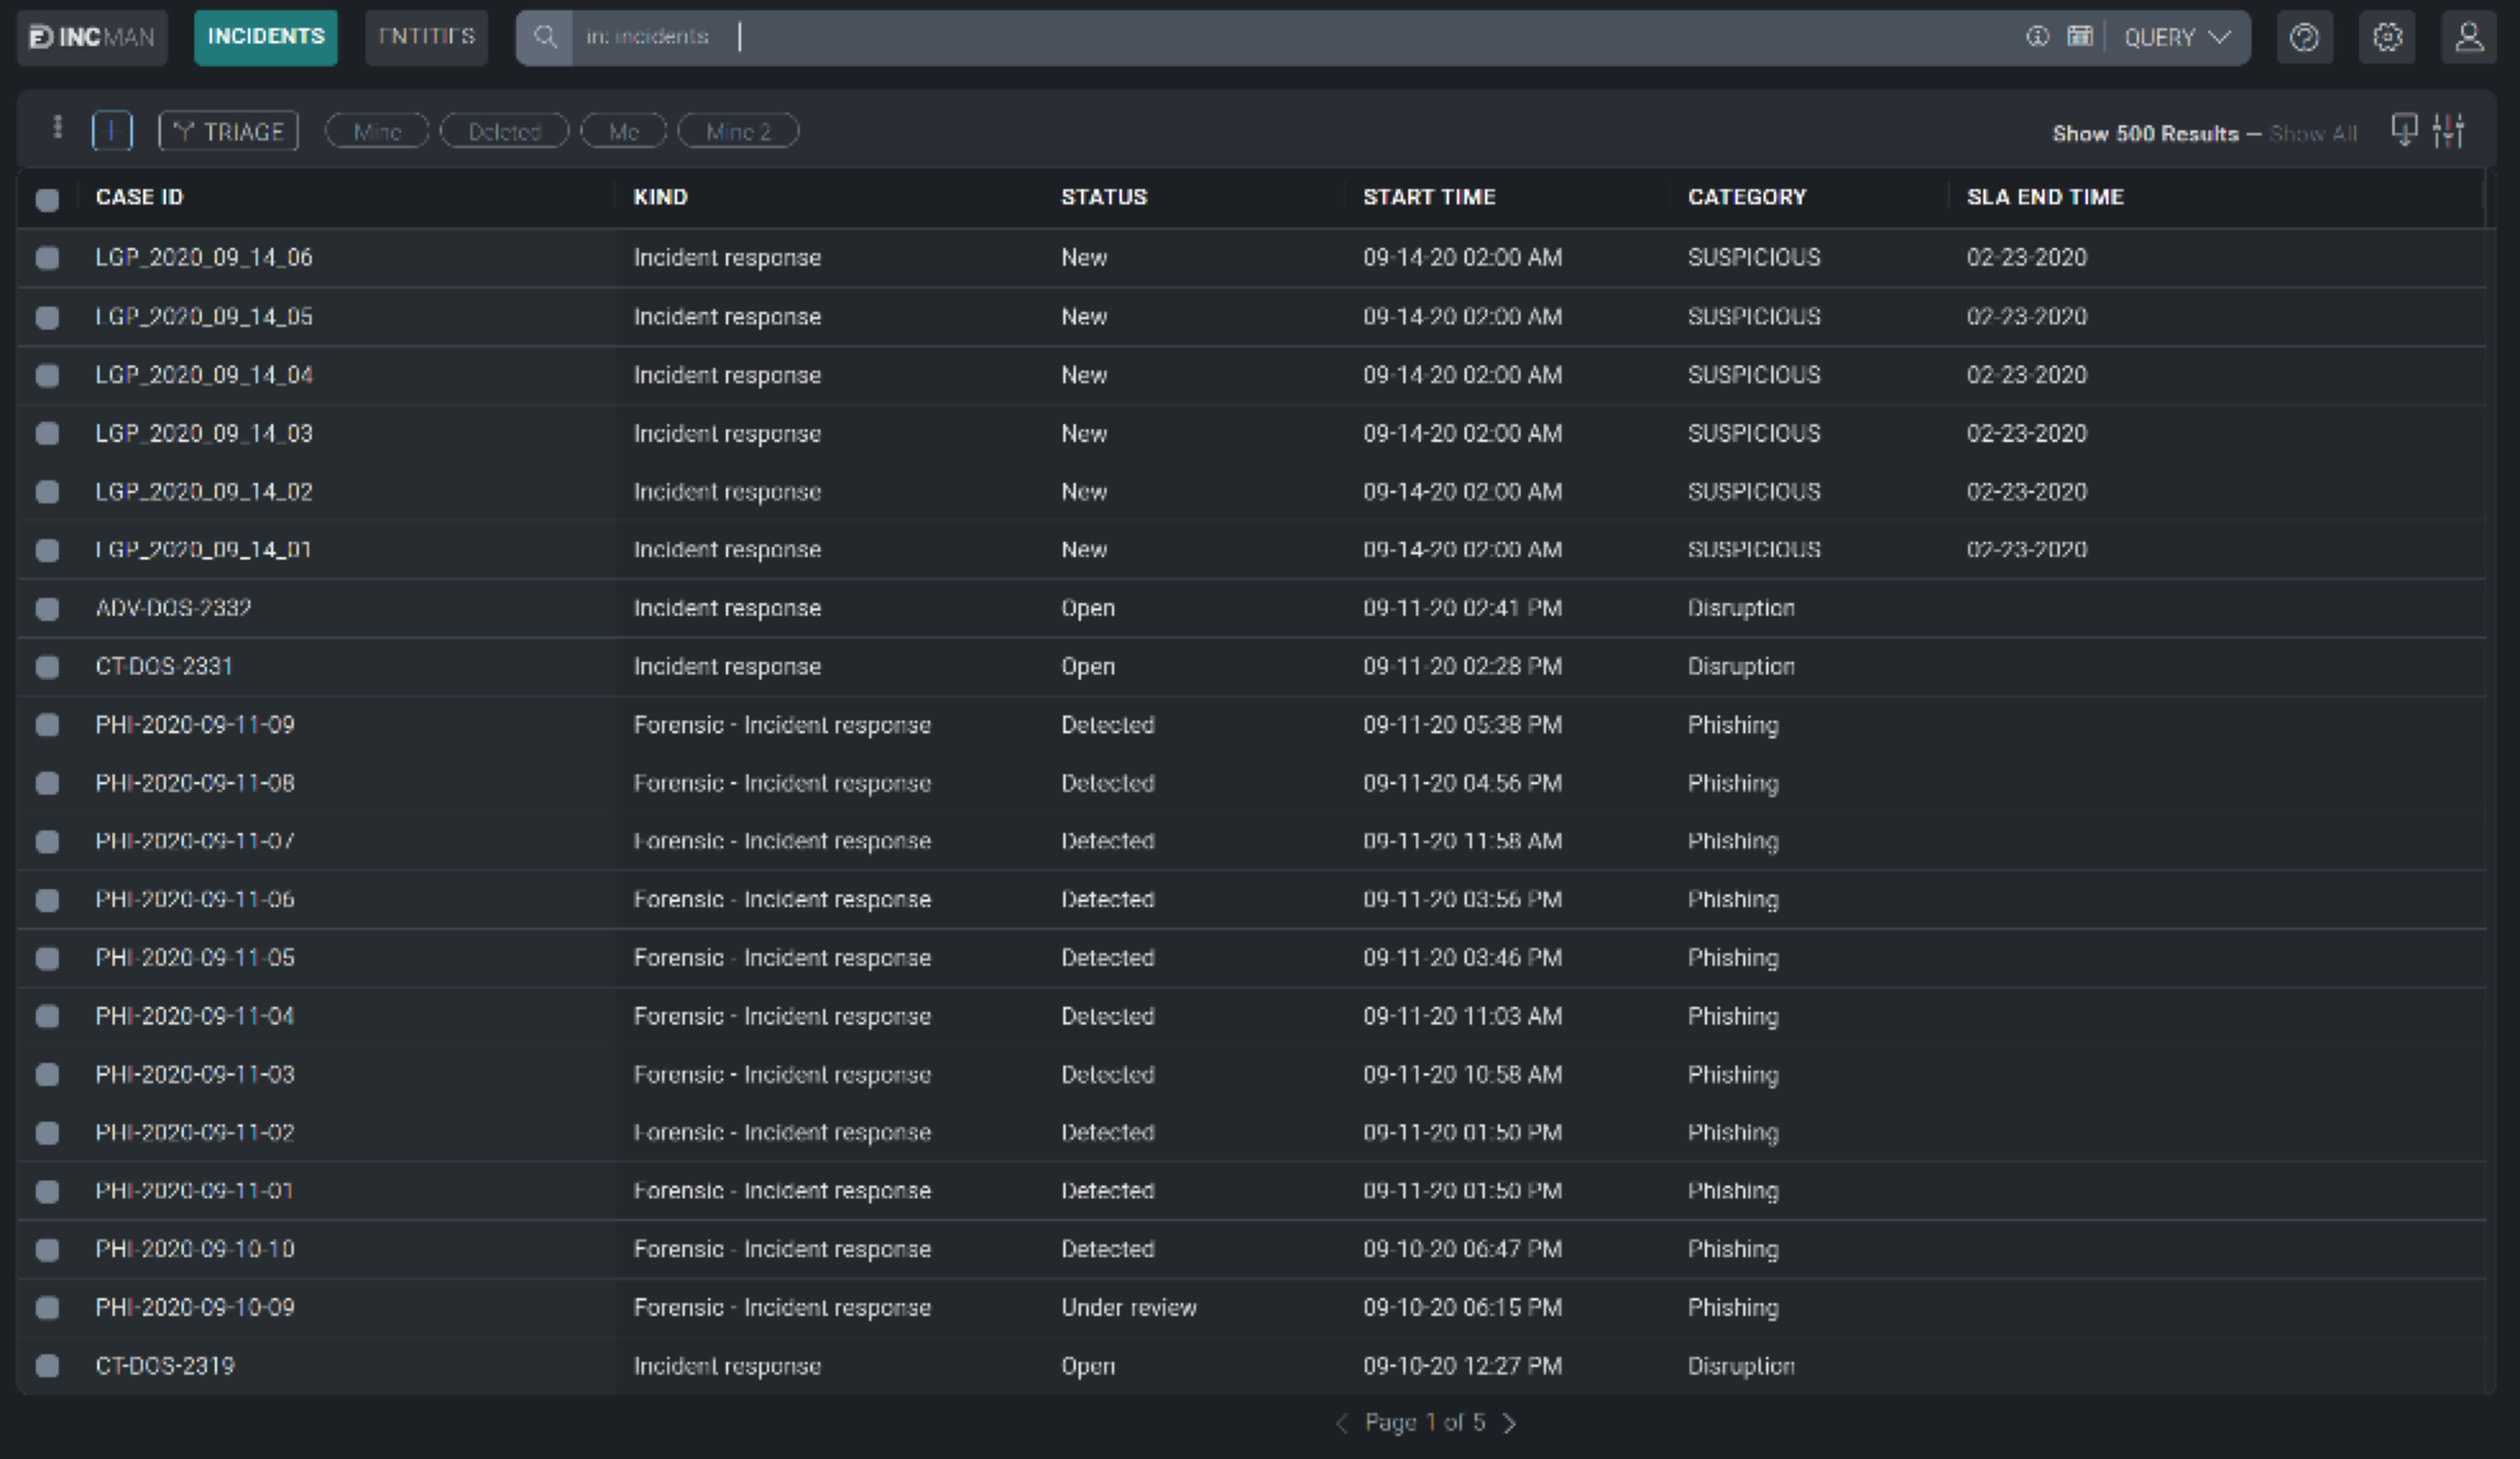
The Incident section lists all Cloud SOAR incidents. Clicking on any of the incident IDs in the Incident section will open the incident. You can configure what incidents are displayed by creating queries against available incident data and saving them as incident filters.
Watch a quick overview of Incidents in Cloud SOAR.
Filtering Incidents
You can also manipulate what data is to be displayed from the Incident section by adjusting which columns are viewable. The adjust these columns, click on the cogwheel on the top right-side of the screen. This will display a configuration screen that allows you to choose which data is displayed and where on the screen it should be displayed by clicking the + sign next to the selection and then dragging and dropping the selection in the order to be viewed.
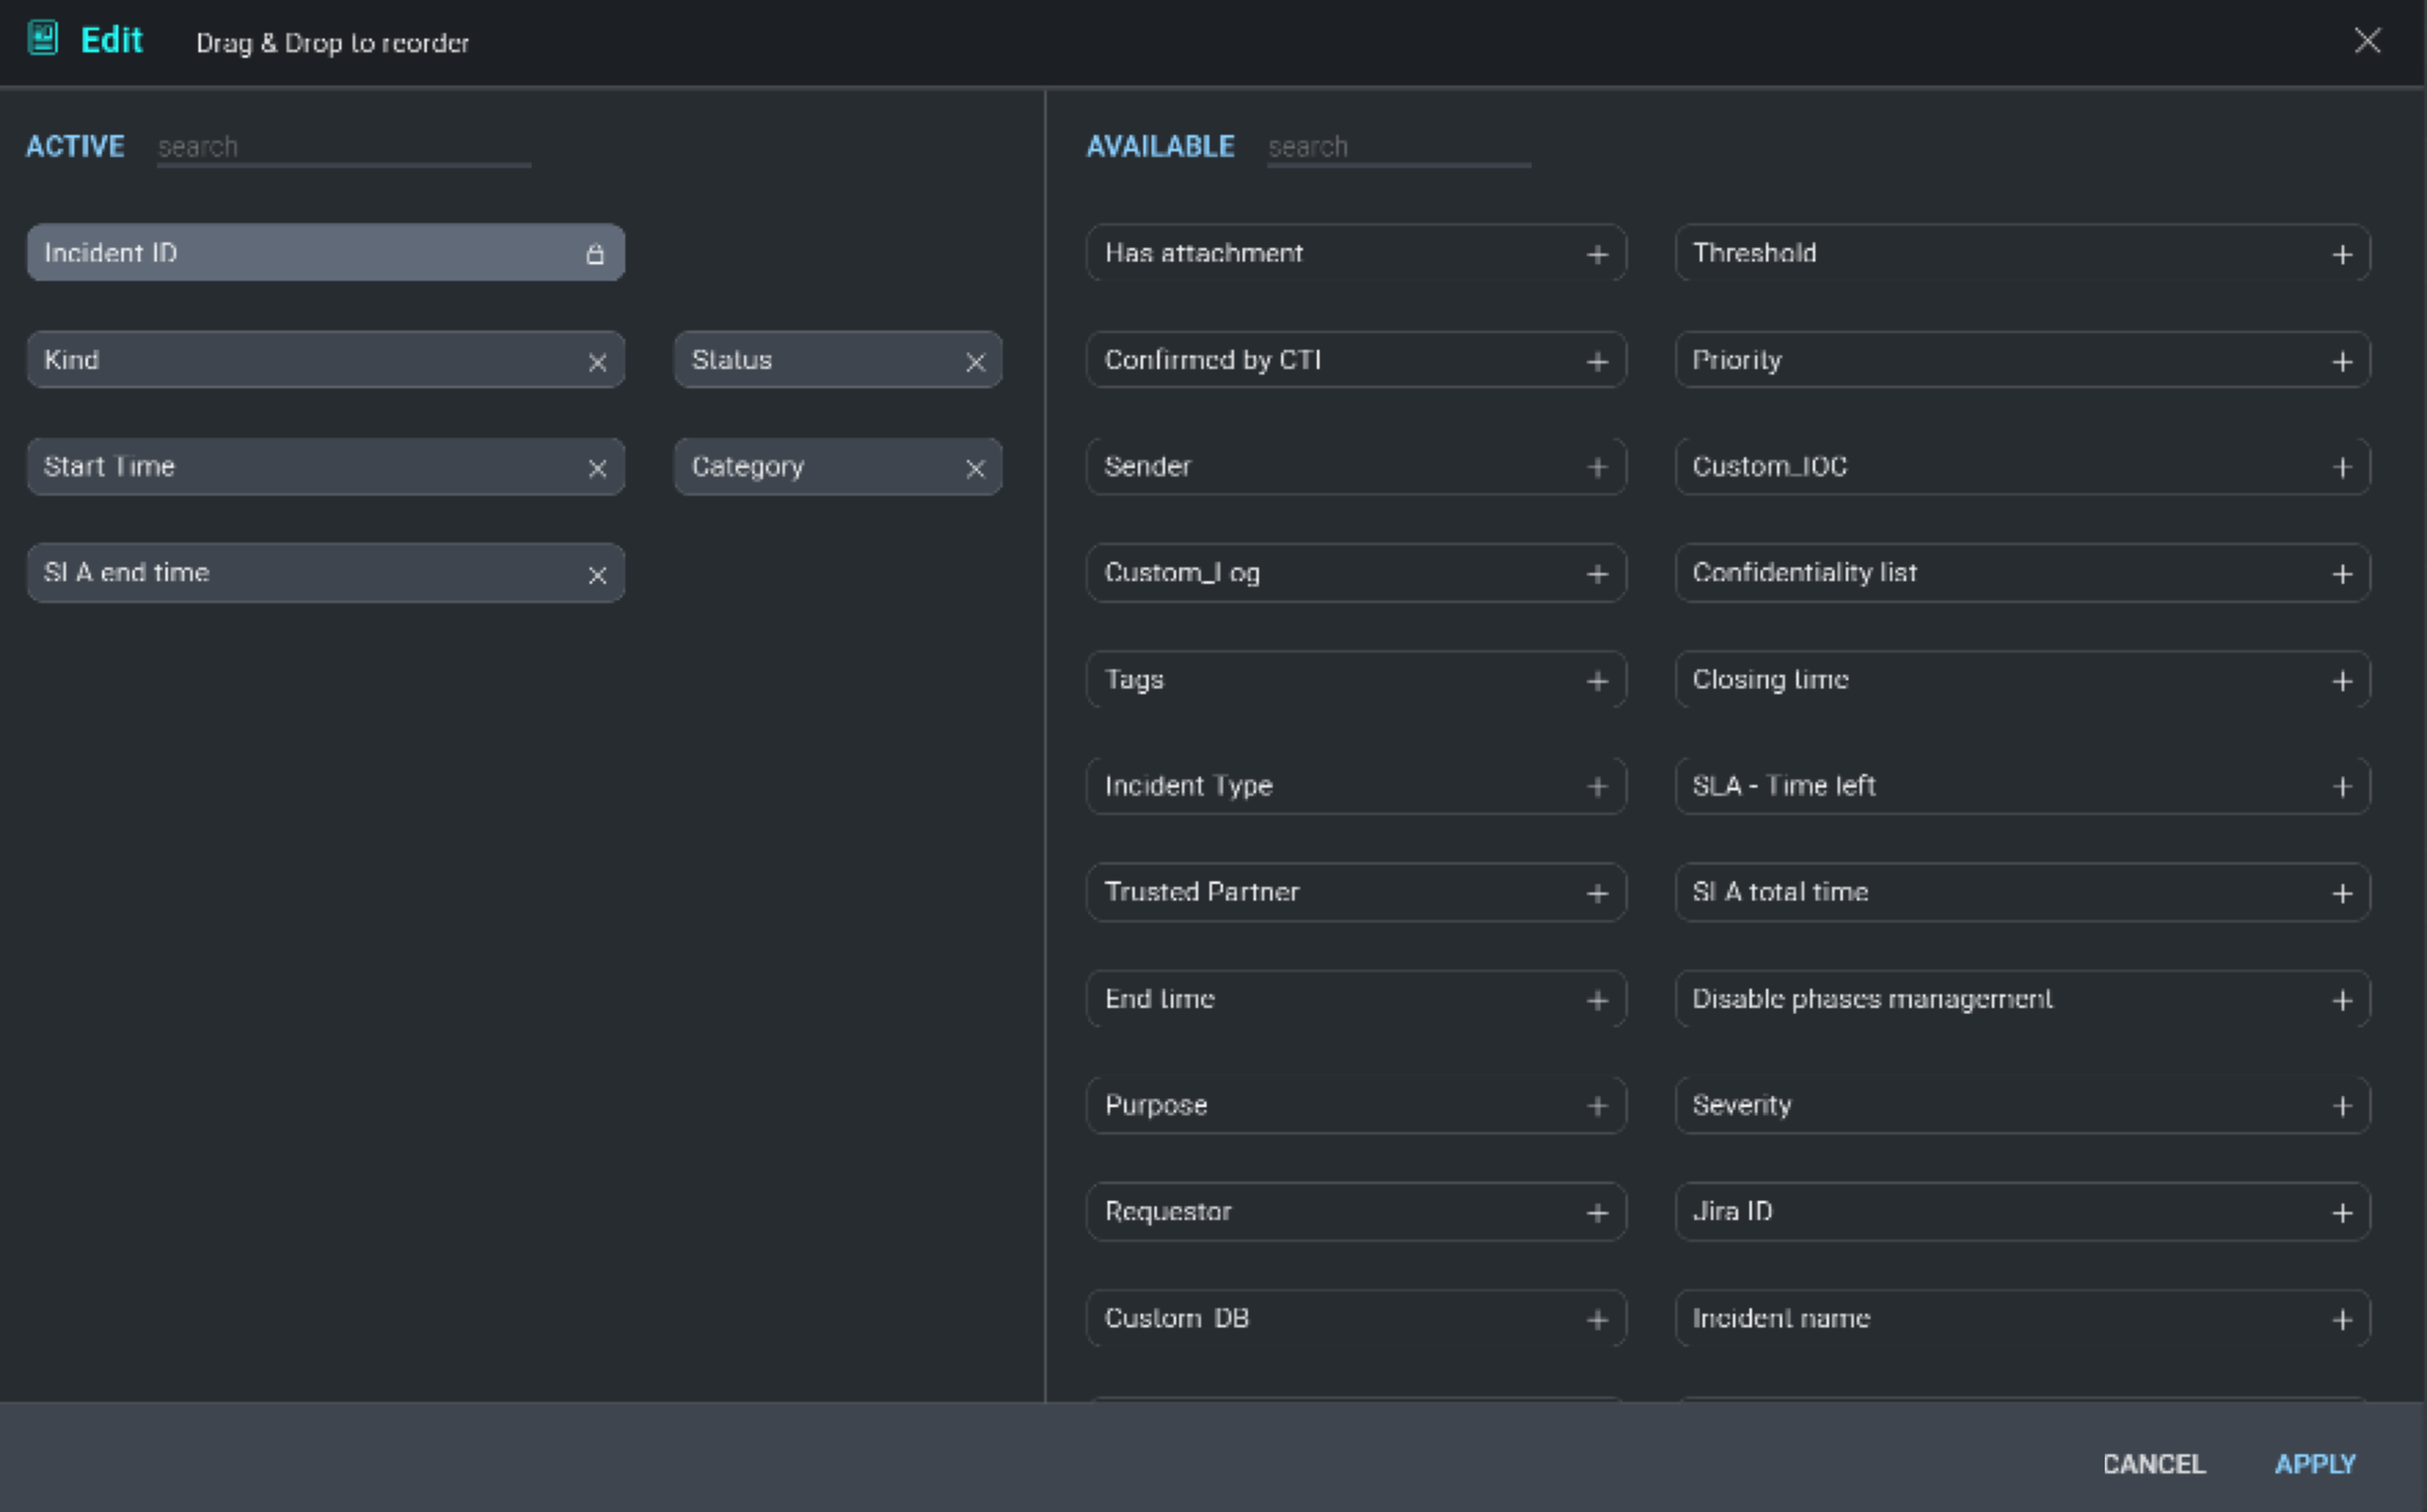
Once the columns are added and organized, click Apply to continue.
From the Incident section you can search, build, and issue queries against existing incidents by simply typing in the search bar at the top of the screen.
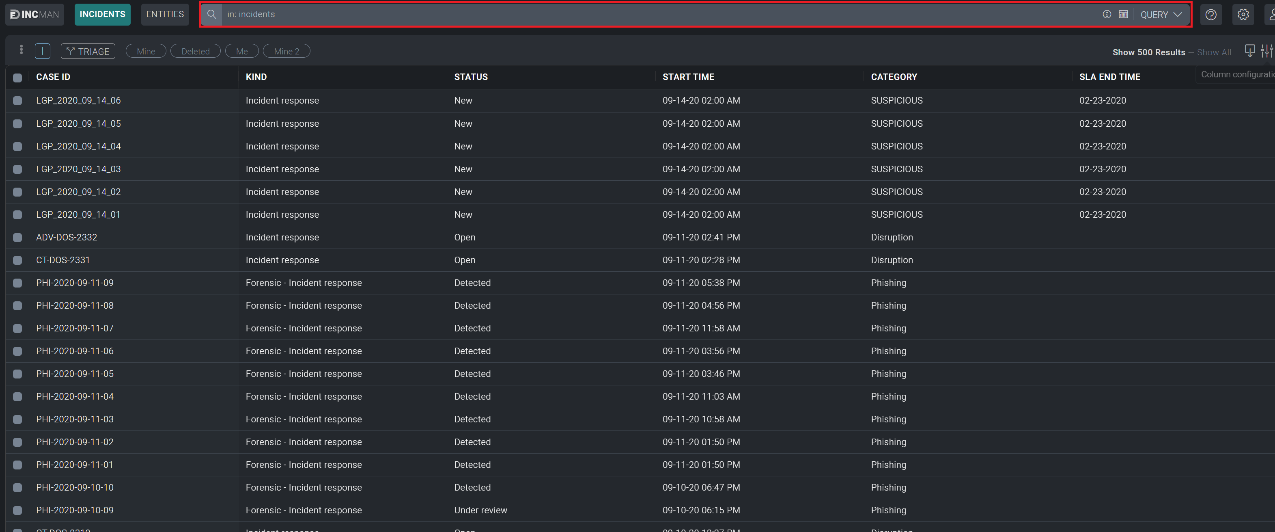
Cloud SOAR also provides its you with a command cheat sheet to help build incident filtering queries. To access the cheat sheet, click on the information icon to display the query options.
Once a query or a search is committed, they can be saved for future use by clicking the star icon to the right of the search bar. These saved searches will be stored as tabs just below the search bar.
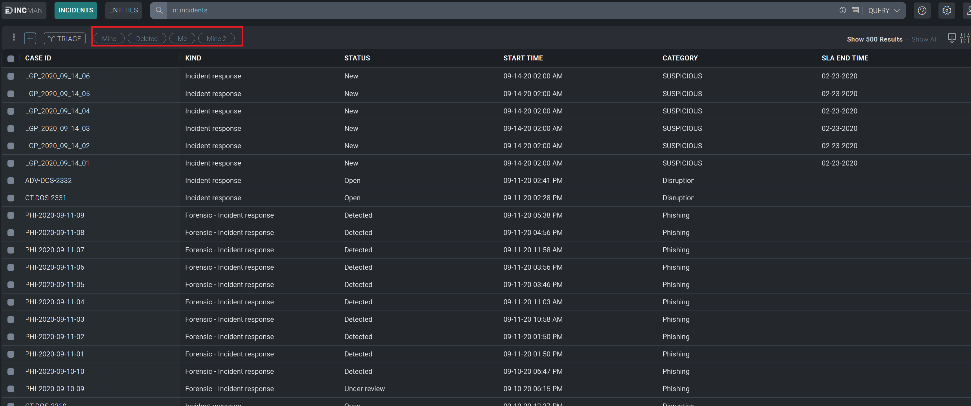
Bulk actions may be performed on any incidents in the Incident Overview list. Bulk actions include:
- Edit
- Close
- Reopen
- Delete
- Restore
- Add Investigator
- Change Owner
To perform bulk actions on incidents, check the incidents you wish to perform the bulk actions on, then click the three dots in the upper left-hand corner of the screen and select the appropriate bulk action.
Working with Incidents
Opening an incident from any section of Cloud SOAR will display the Incident Details page. The Incident Details page is composed of three sections: The Incident VIP Section, on the left side of the screen, the Incident Properties section in the center, and the Incident Widgets section to the right side of the screen.
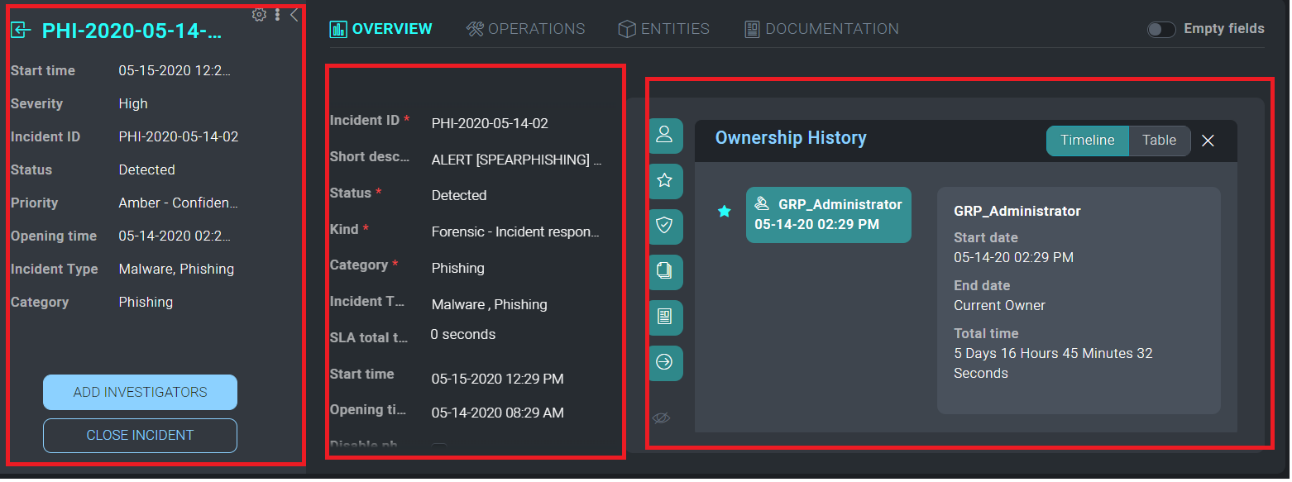
Incident VIP section
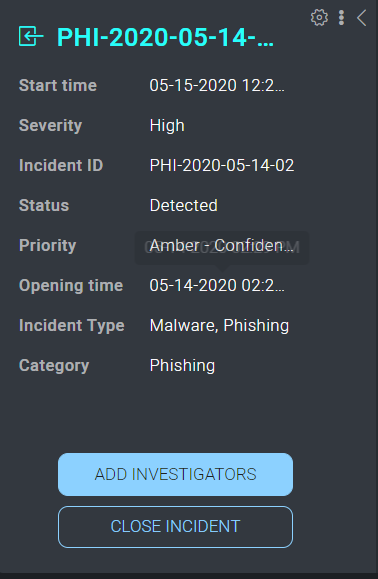
The Incident VIP Section displays high-level details about a specific incident. You can also take actions such as add additional investigators or close the incident from this section. To view all available actions, click the vertical ellipsis to the left of the cogwheel. You can change the owner of the incident, change the folder where the incident is housed, export the Incident details via PDF, DOC, or Custom Report, and clone or permanently delete the incident.
To customize the details displayed in the Incident VIP Section, click the cogwheel at the top-right of the section. A new screen will be presented which will allow for adding and deleting of incident detail fields. To add a new field, you will click on the + sign next to the field to be added. Once all the desired fields are added, they can easily be rearranged in the desired order by dragging and dropping into place. To remove a field, simply click the x next to the field to be removed. Once all the details have been added and are in place, click Apply.
Incident Properties
The Incident Details section contains all the important information that makes up the incident, such as executed Playbooks and incident tasks. This information is divided into four different sections: Overview, Operations, Entities, and Documentation.
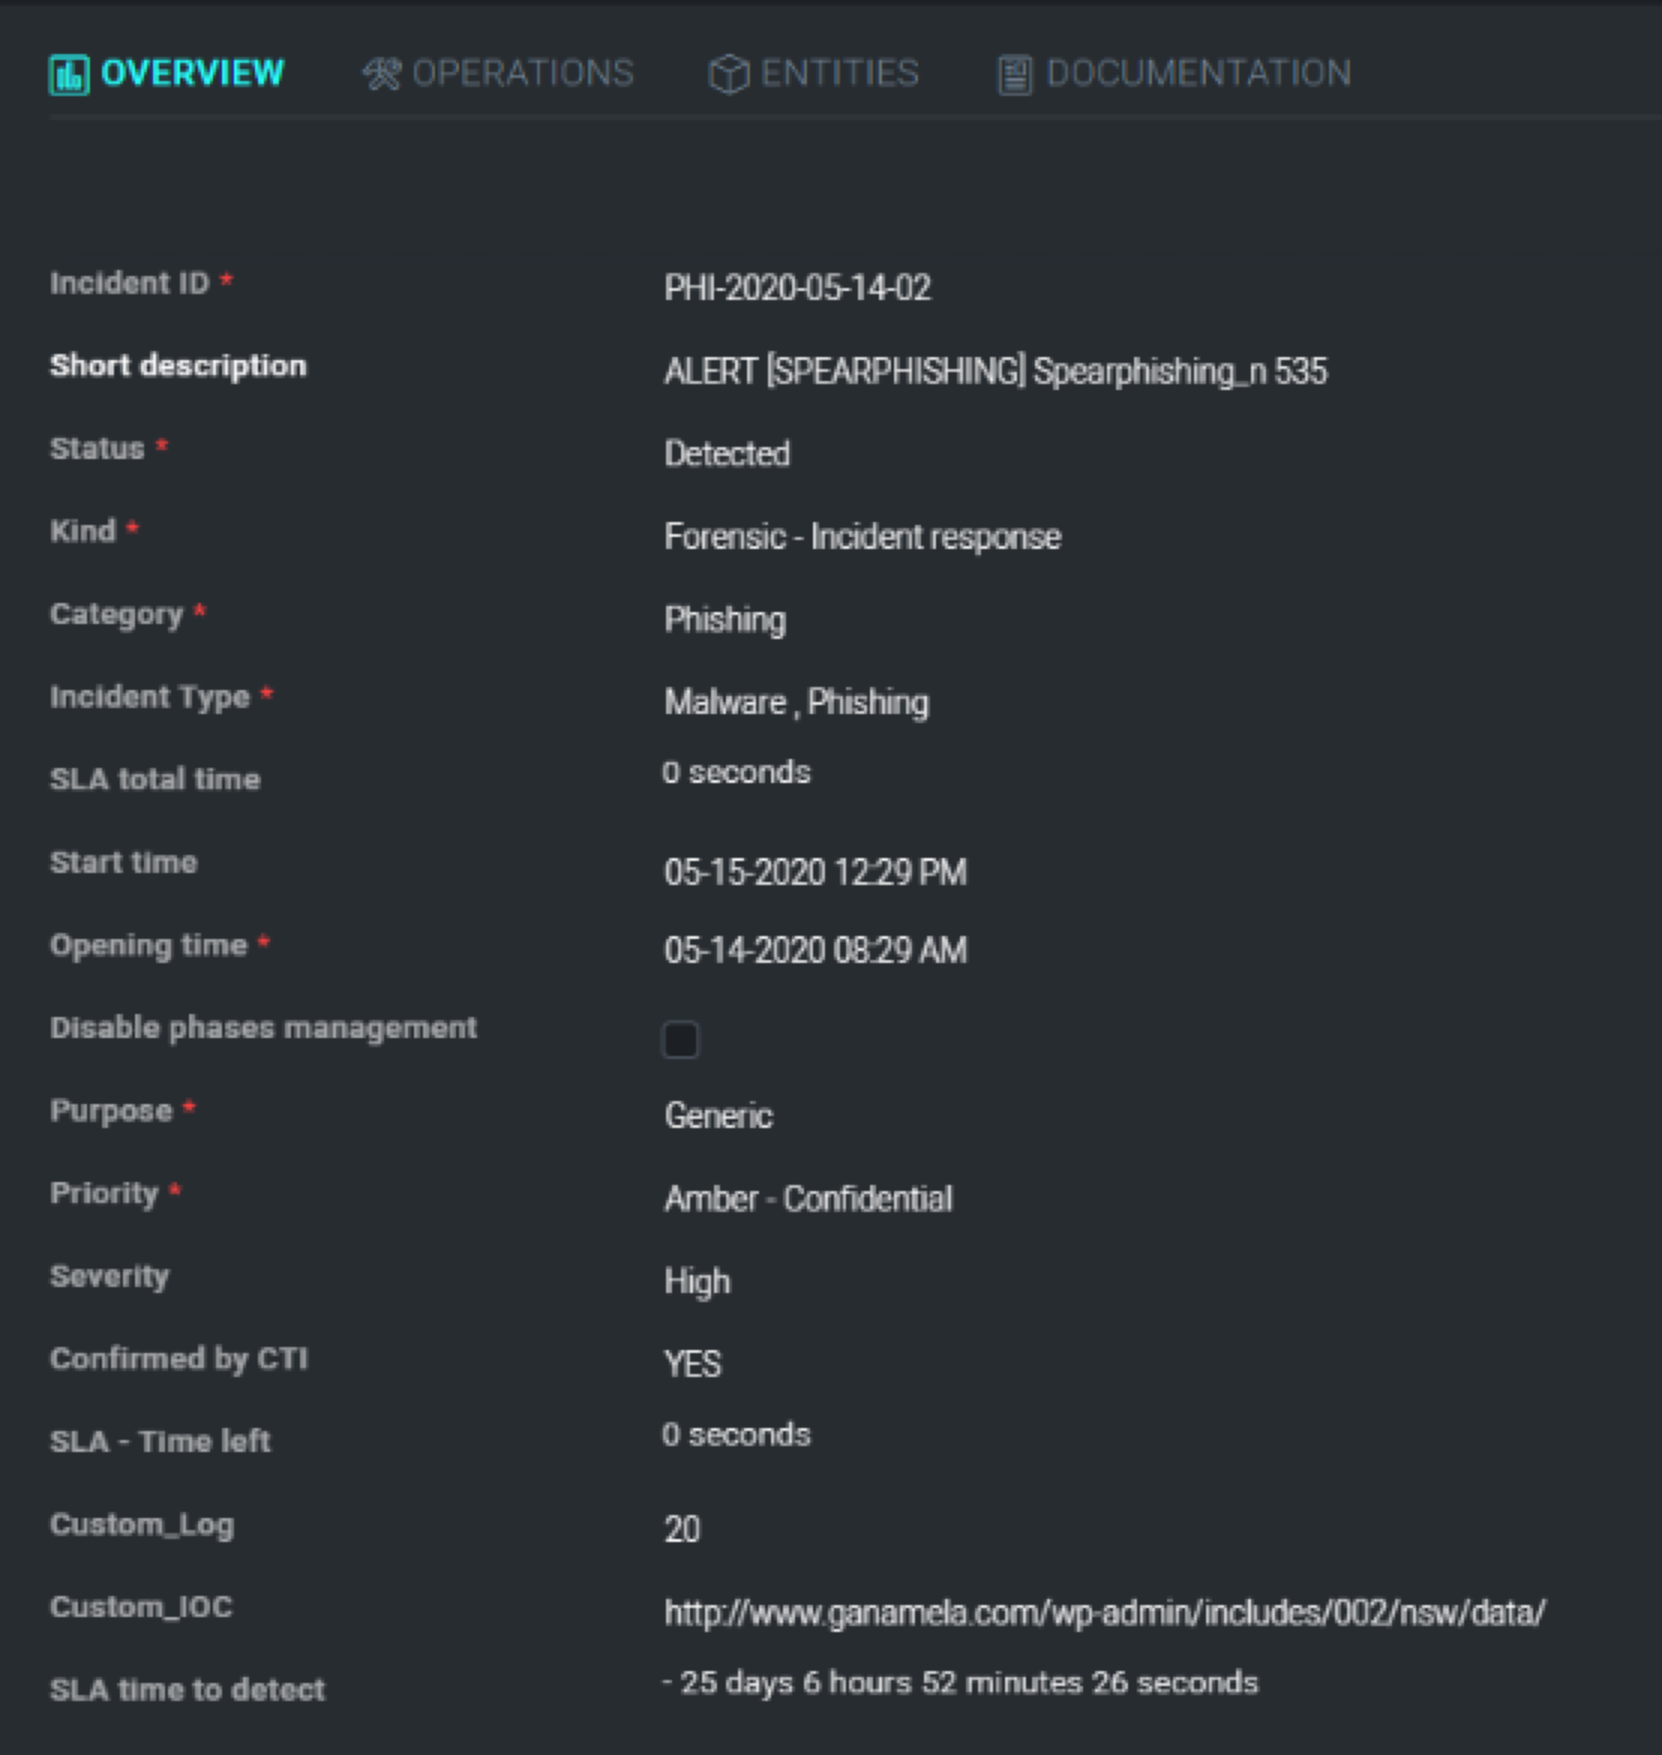
Overview
The Incident Overview section contains all the pertinent information for a specific incident such as the severity, SLA counter, and category of alert. This information can be customized in the Custom Fields section of the platform. For more information, please see Custom Fields.
Operations
The Operations section contains all the investigative information for a specific incident and is broken out into the following sections: War Room, playbook, Tasks, and Notes.
Security Automation with Cloud SOAR Playbooks.
War Room
All the information related to the incident ongoing are visible in one place in the War Room section. You can quickly view and check all the steps of the analysis, done either manually or by the automation, any entities related to the incident, results of actions performed and notes added during the incident's investigation. Information can be filtered out for the different categories, and by pressing the + button, you can add new notes.

Playbooks
Any playbook that has been applied to an incident can be found under the playbook section. You can quickly view and make any necessary adjustments to the incident's Playbooks as well as add any additional Playbooks that may be required during an incident's investigation.
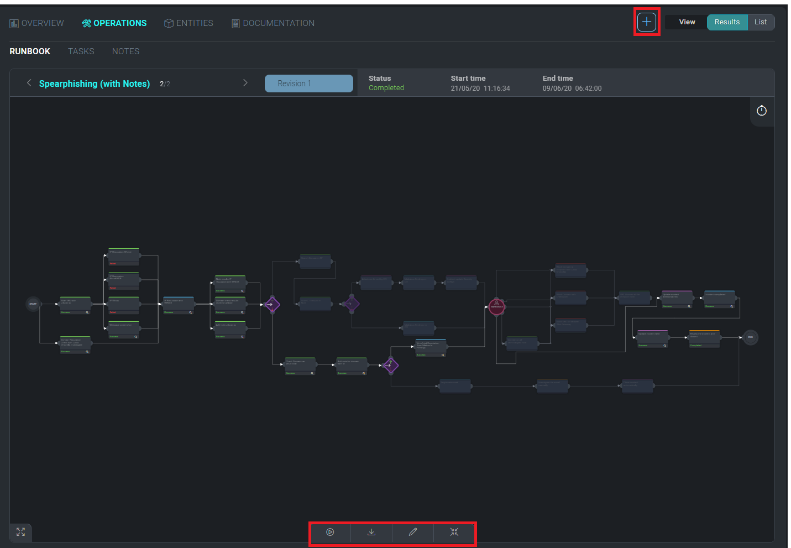
The playbook option menu can be found at the bottom of the playbook screen. From here, you can re-execute a playbook, export, edit, or expand the existing playbook. If during an incident's investigation it is determined that the type of incident has changed (i.e. phishing incident turns into a ransomware incident) another type of playbook may be needed to correctly remediate an incident. You can add additional Playbooks to the incident by clicking the + sign at the top of the playbook screen.
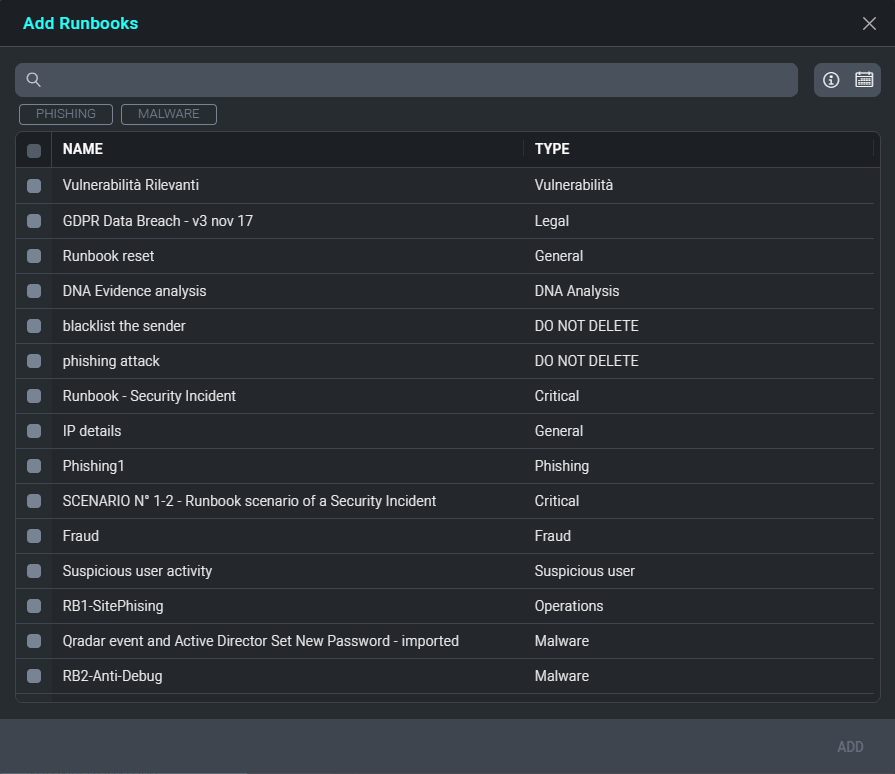
This will open a new screen that lists all available Playbooks. Either type in the playbook name to use or manually search through all available options and click Add when finished.
Viewing Playbook Results
The results of a Playbook, either while it is executing or after execution has completed, can be viewed from the playbook section. By clicking the expansion button on the bottom left of the screen will expand the playbook and will display the execution results.
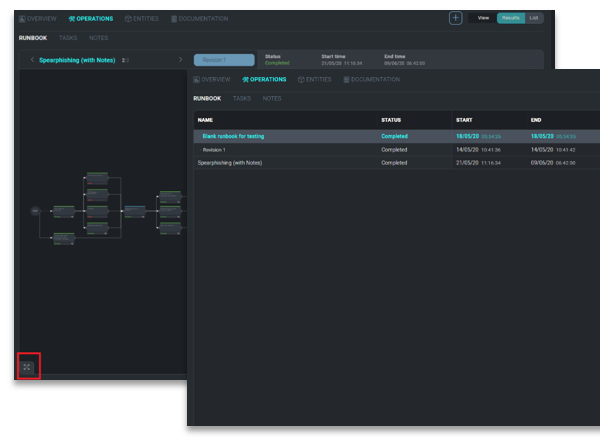
The results of the playbook can also be viewed as a list by clicking the List button next the + at the top of the page. The execution path of the playbook will be shown, along with the status of the execution of each action. The execution history of the playbook will be displayed in a tab on the right-hand side of the screen, which can be minimized.
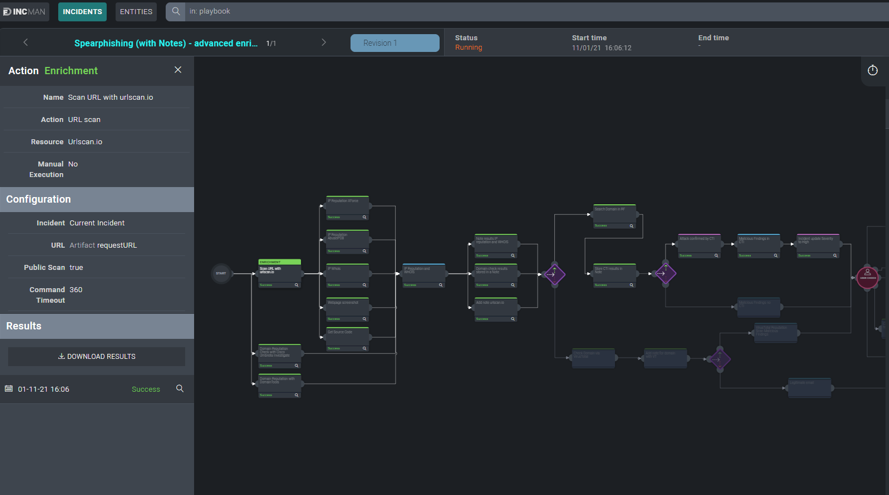
To view the details of any individual action, including the results, click on the action node. A new window displaying the action details will be displayed on the left-hand side of the screen. From this view, you can see the status of the action, its configuration, and have the choice to download the JSON results of the action.
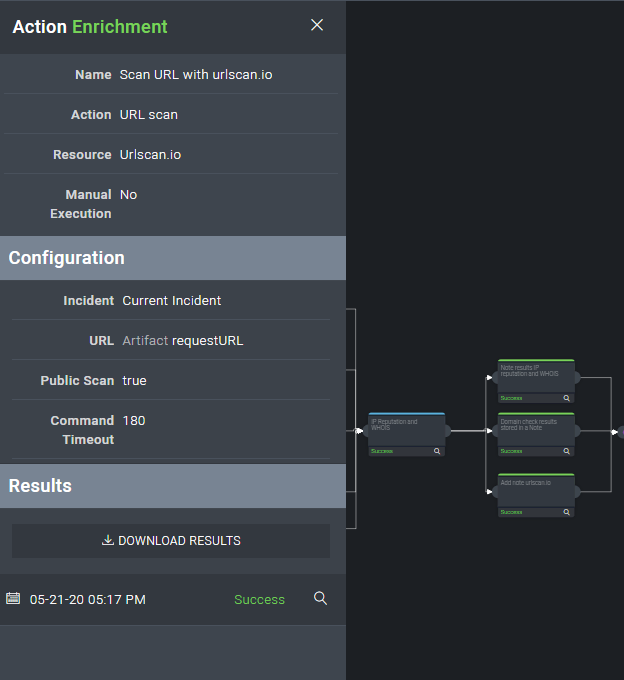
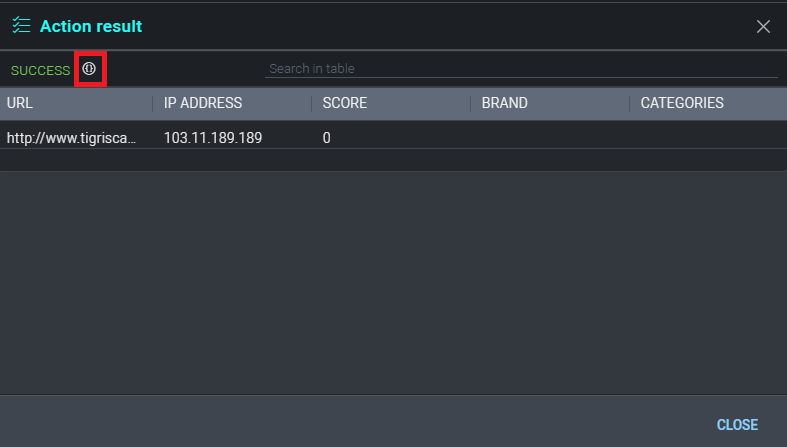
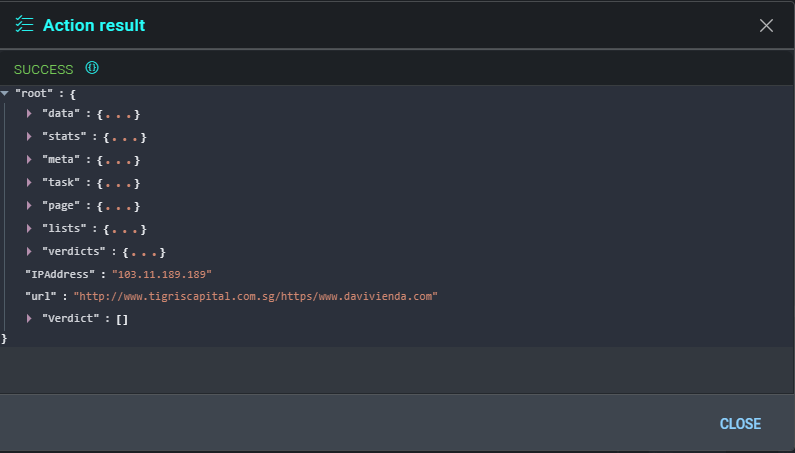
To view the details of the result, click on the magnifying glass and the action's details window will be displayed. The details section displays the results of the action in table view which you can also filter through by using the details search bar at the top of the screen. For more detailed information, you can switch to the action's JSON results screen by clicking the View JSON Results button next to the action's search bar. The JSON results view displays the full results of the executed action. Because some integrations return large data sets, the table view is designed to show only a select set of attributes. To view the complete results of verbose integrations, the JSON tab should be used.
Tasks
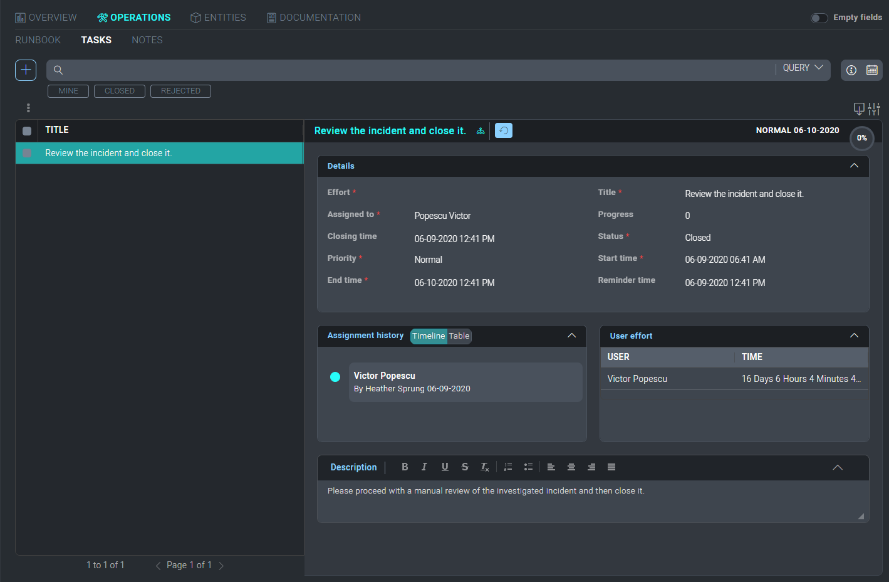
Cloud SOAR's Tasks section allows incident managers to assign and track tasks which must be completed during an investigation. Tasks may be added from Playbooks or Playbooks, as discussed in previous sections, or manually from the incident's Tasks section.
Adding a Task
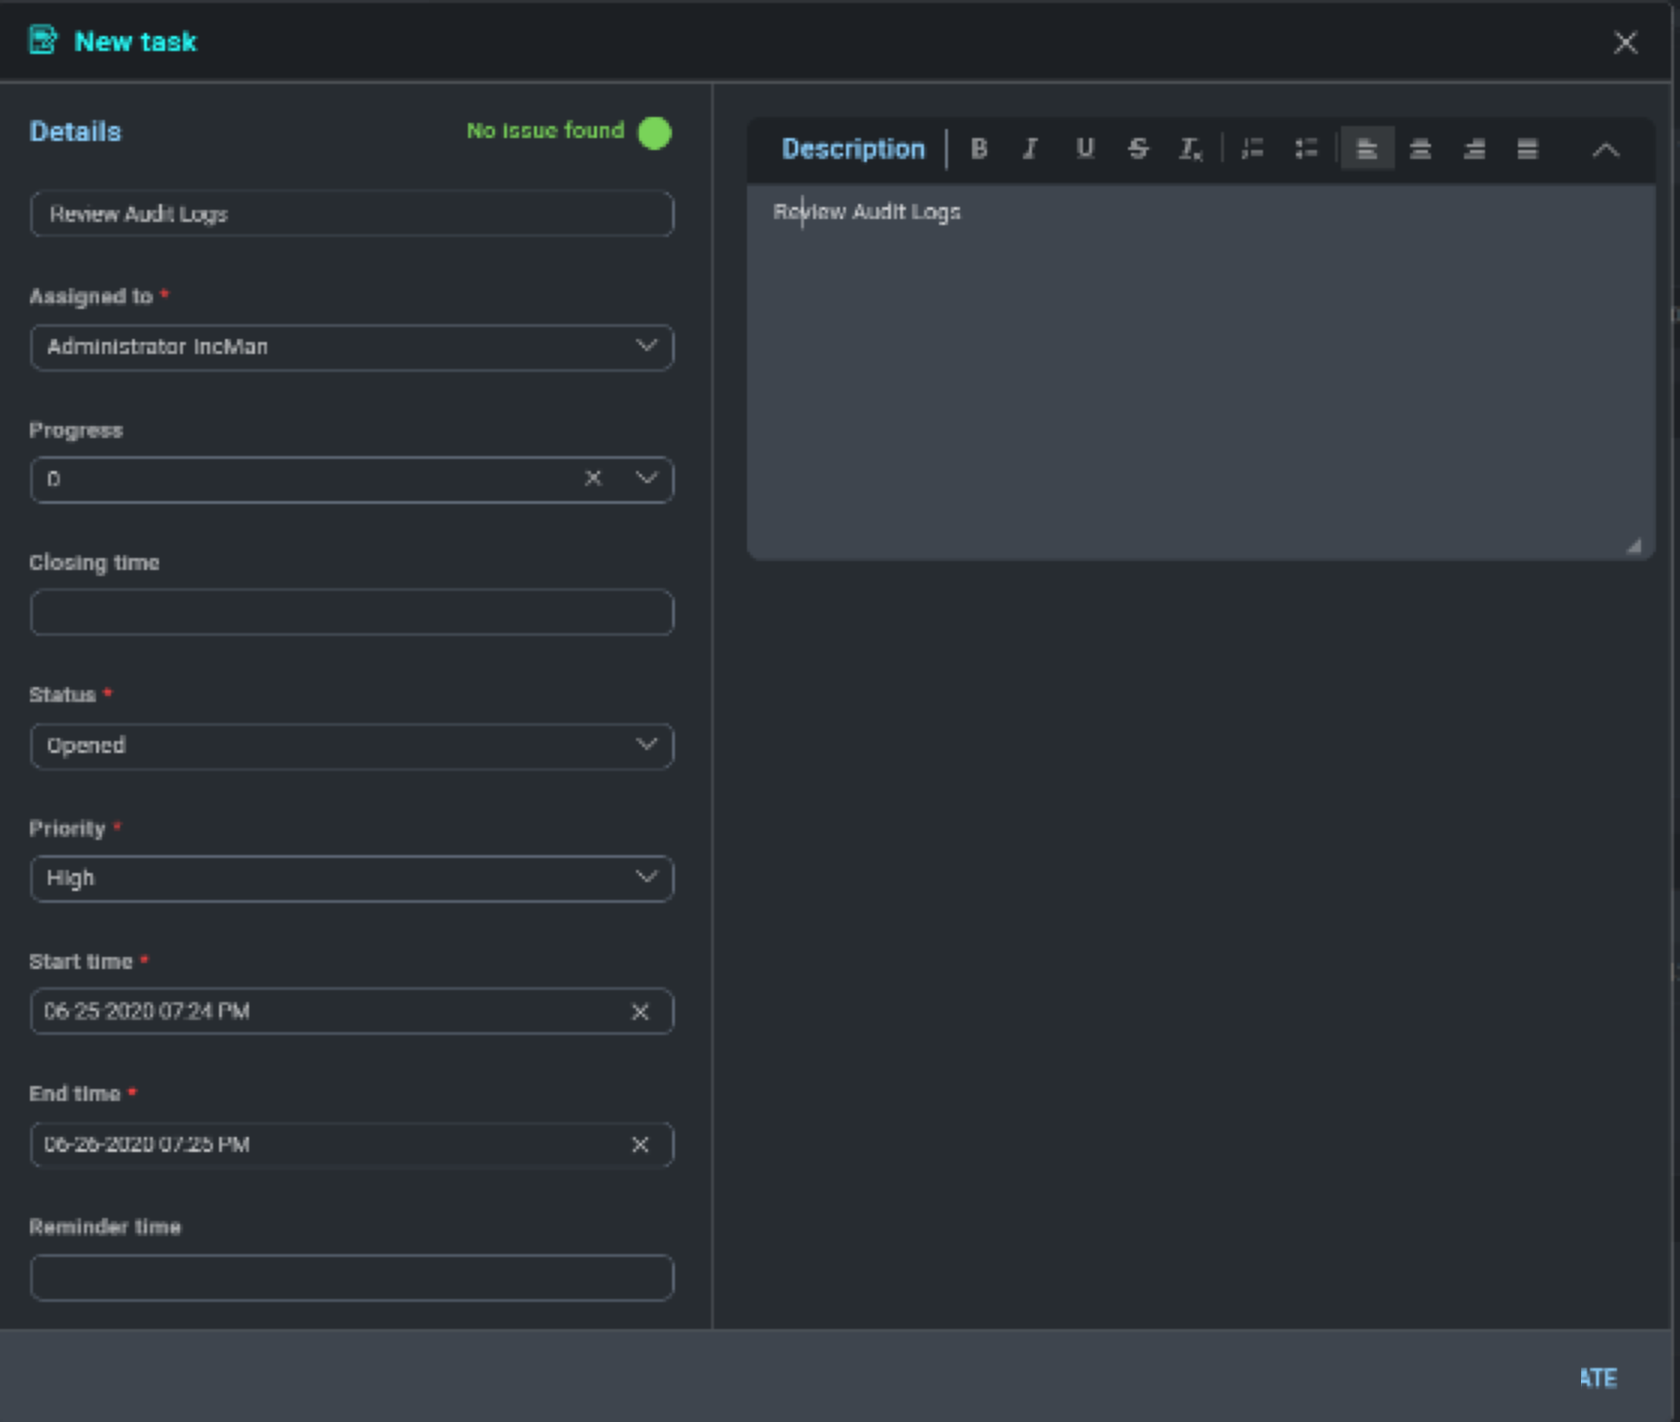
To add a new Task, click the + button at the top-left of the Task list screen. Fill in all required fields and add any additional information necessary under the Description section if desired.
The user listed in the Assigned to field will be the user responsible for completing the task.
The field titled Effort should be the number of hours estimated to complete the Task. As the Task is updated by the Assignee, this field should be changed to reflect the actual number of hours that were required to complete the Task. This number will be used to provide Task Assessment information, discussed in more detail in the Documentation section of this manual.
Working with Tasks
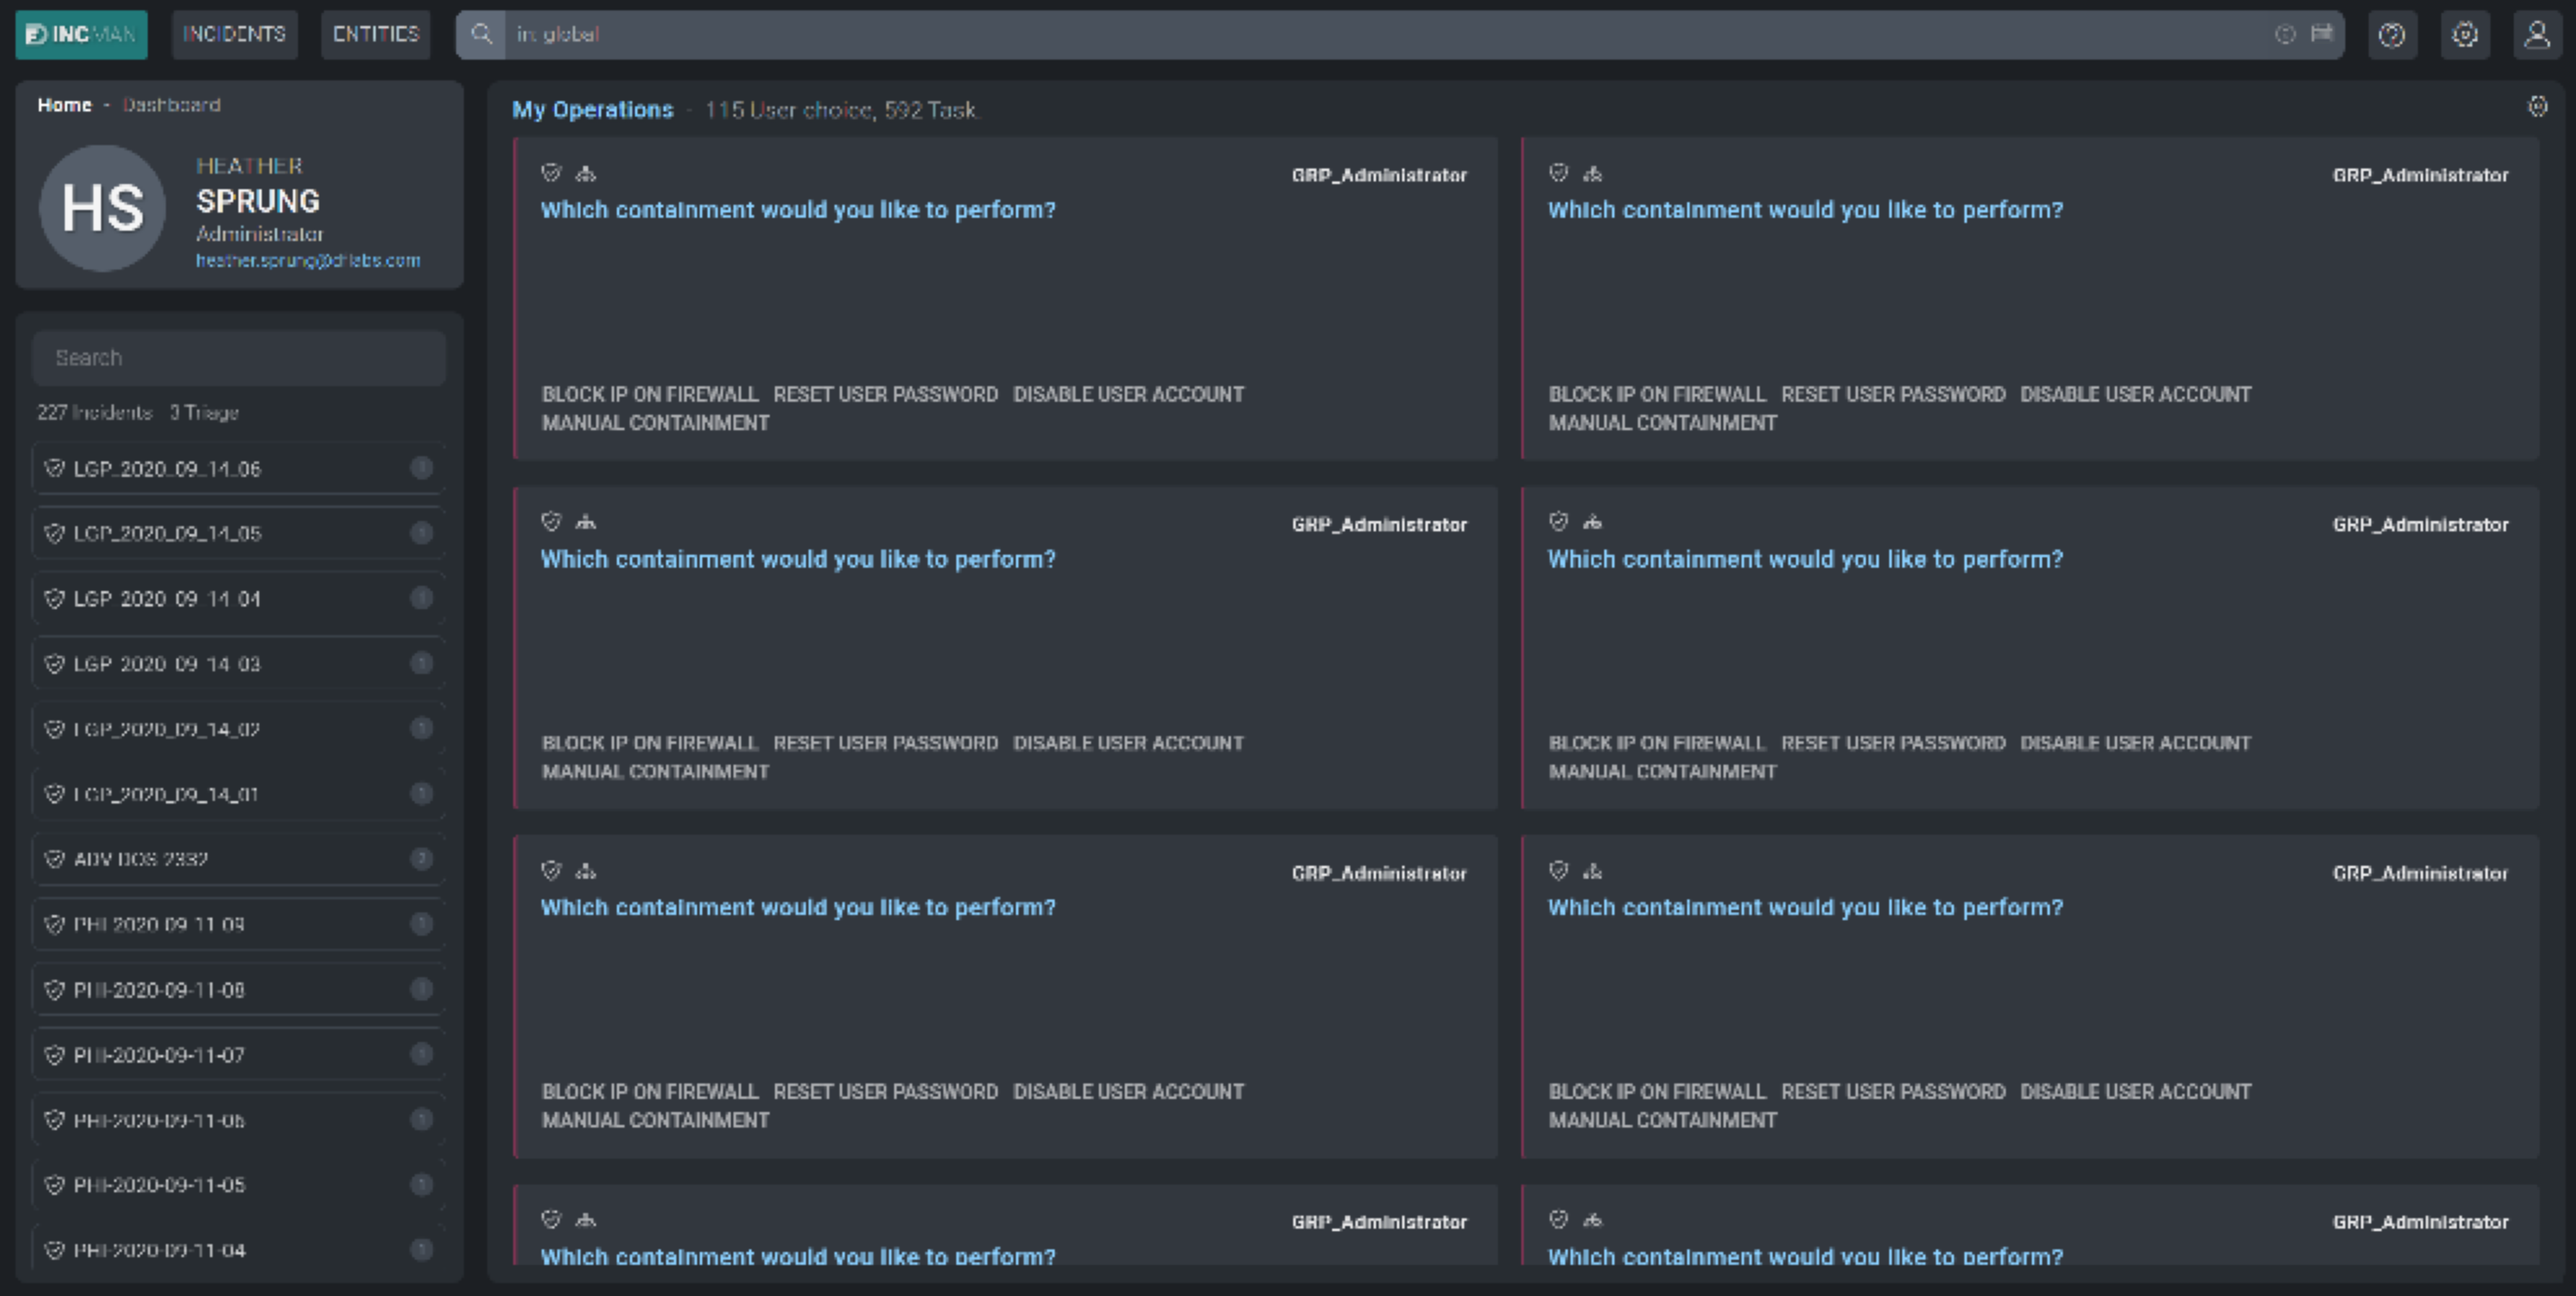
Once a task has been created and assigned, it will appear in the Home section of the Main Menu. To view the details of a task click on the task from the My Operations section of the screen, or to view a task by its incident, select one or multiple incidents from the task list on the left-side of the screen.
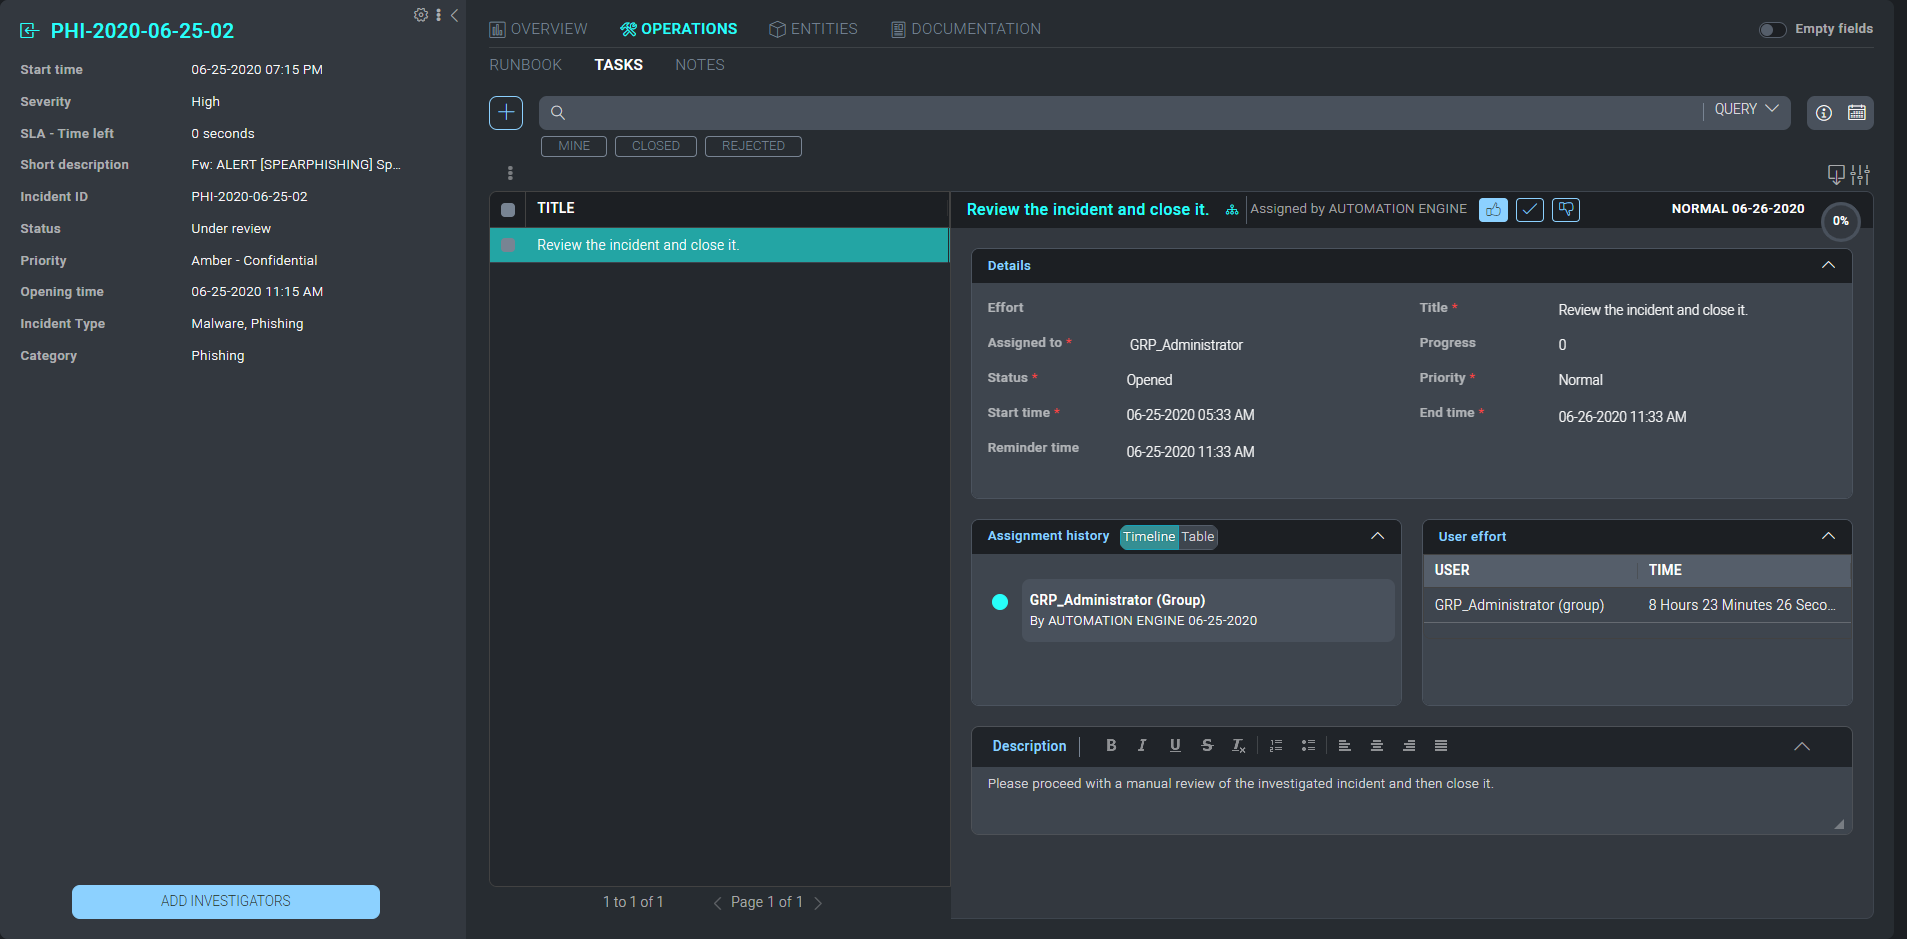
Selecting a task will open the incident where the task was created. This will allow you to review the details of the task and access any automated Playbooks and notes from the incident investigation. Once the incident data has been reviewed investigators can choose to approve, approve and close, or decline a task by clicking the thumbs up, thumbs down or check mark buttons next to the task's title.
Notes
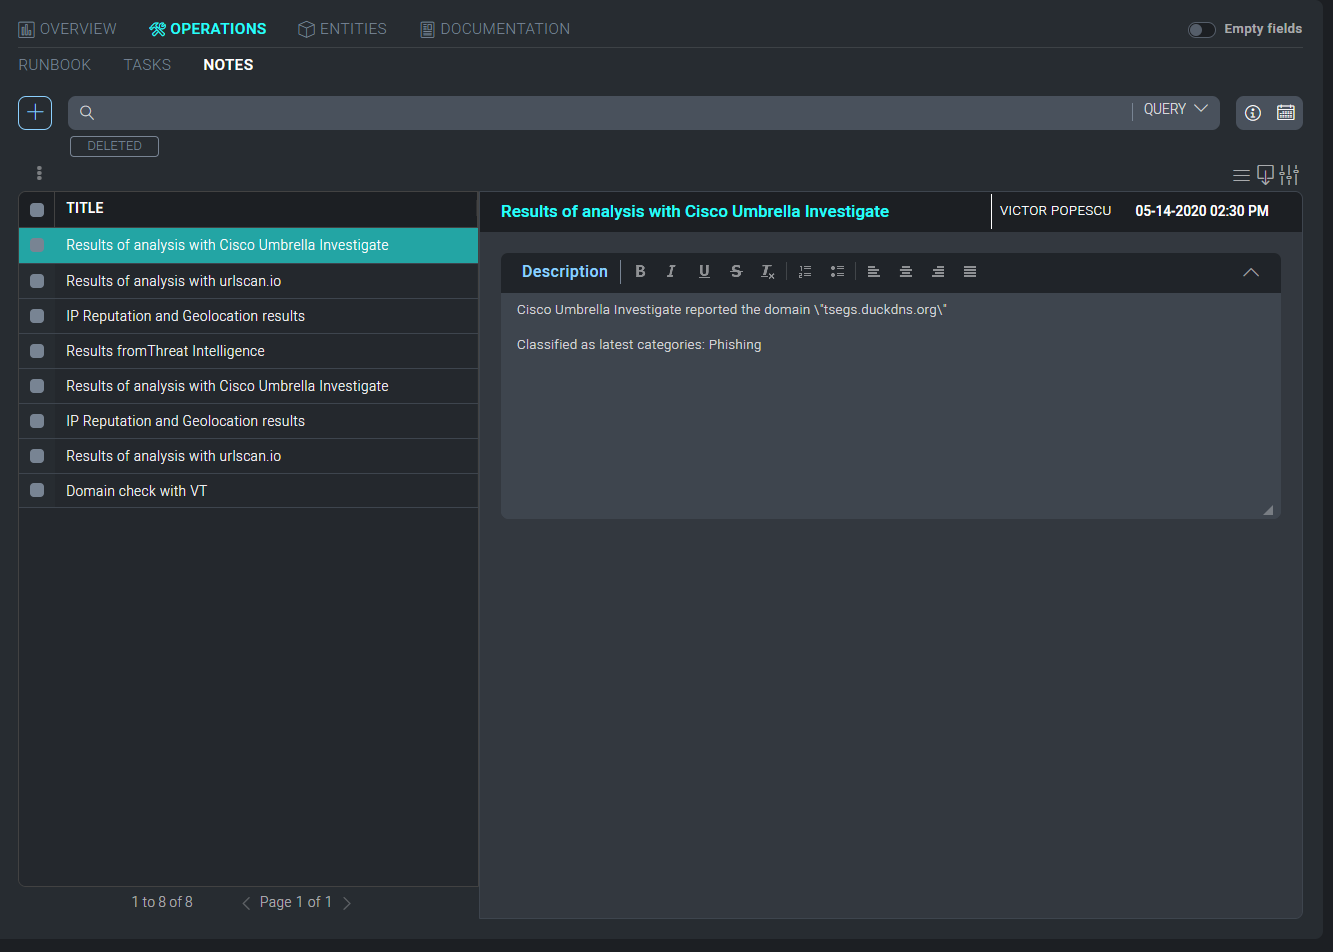
Like the Tasks section, the Notes section contains all notes either automatically created during a playbook's execution or manually created during the incident's investigation. Both sections offer the ability to export and search for different results depending on the operational need.
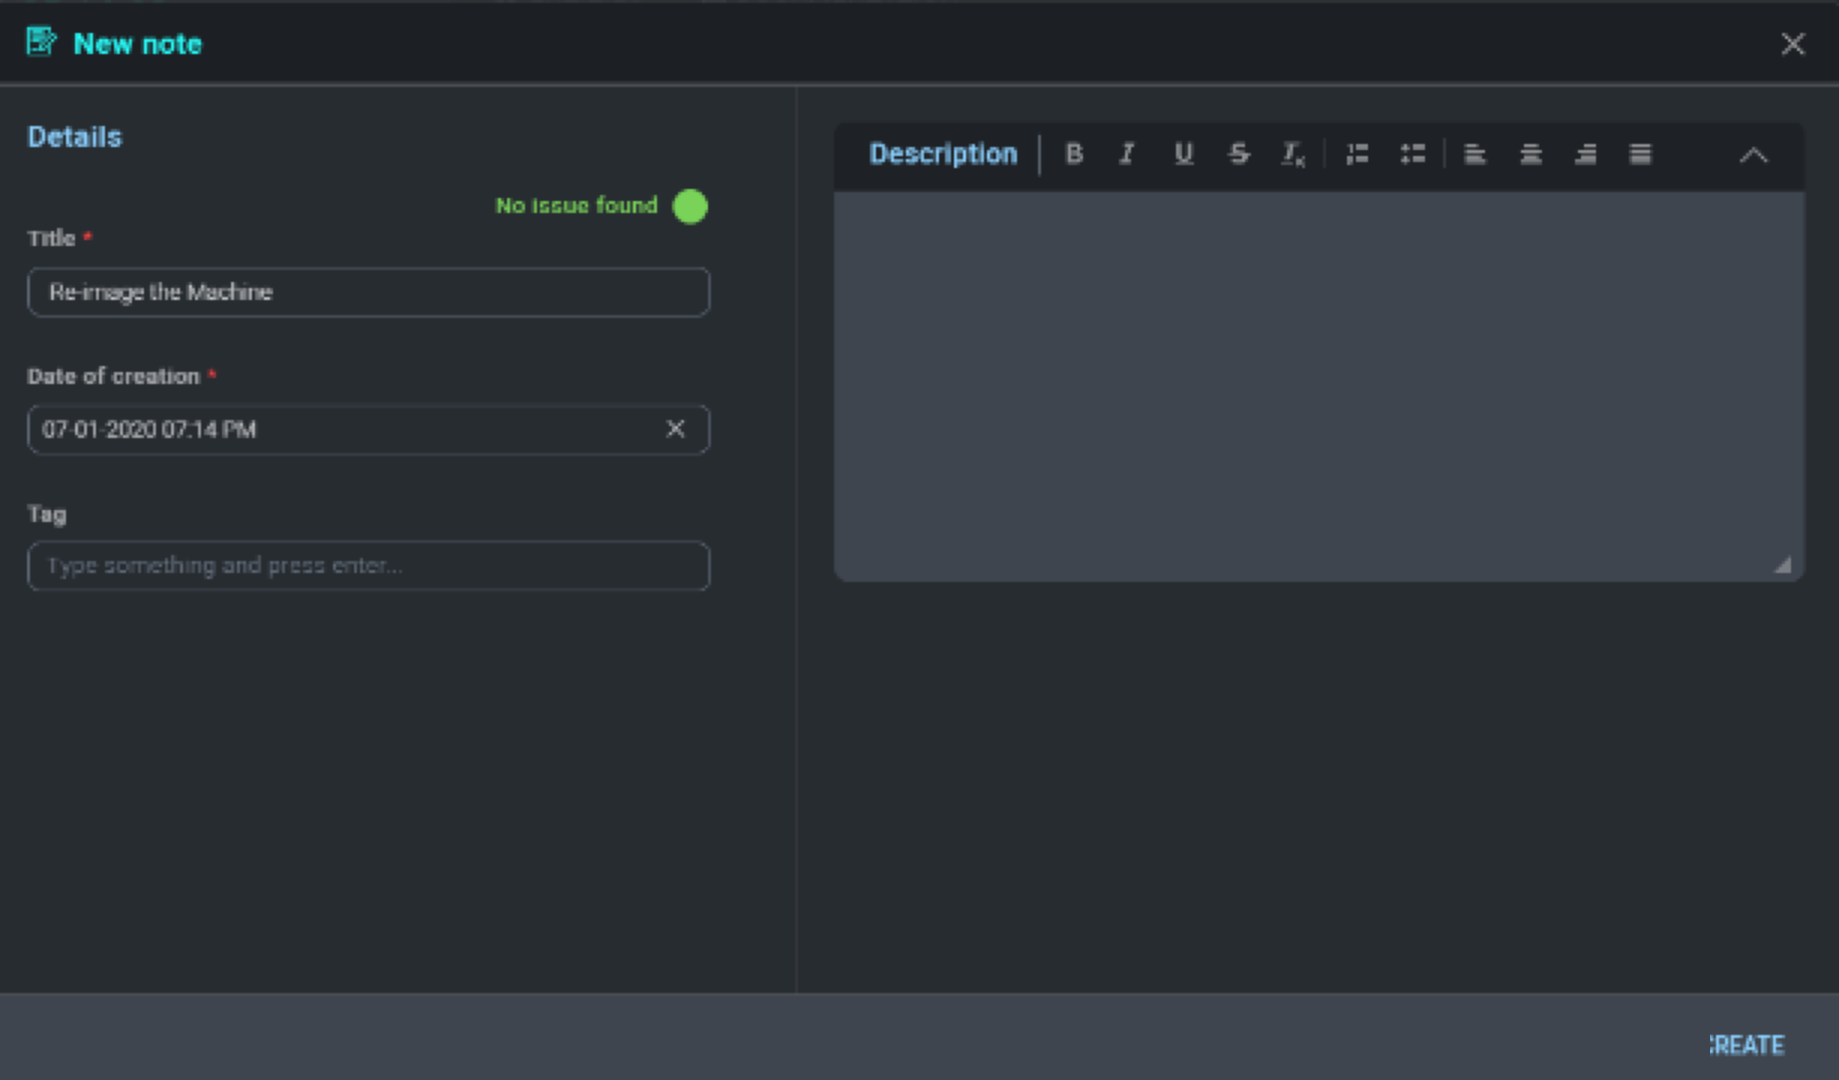
Adding a Note
To manually add a note, click the + symbol to the left of the search bar and a new configuration screen will appear. Enter the note into the free form text box and click create when finished.
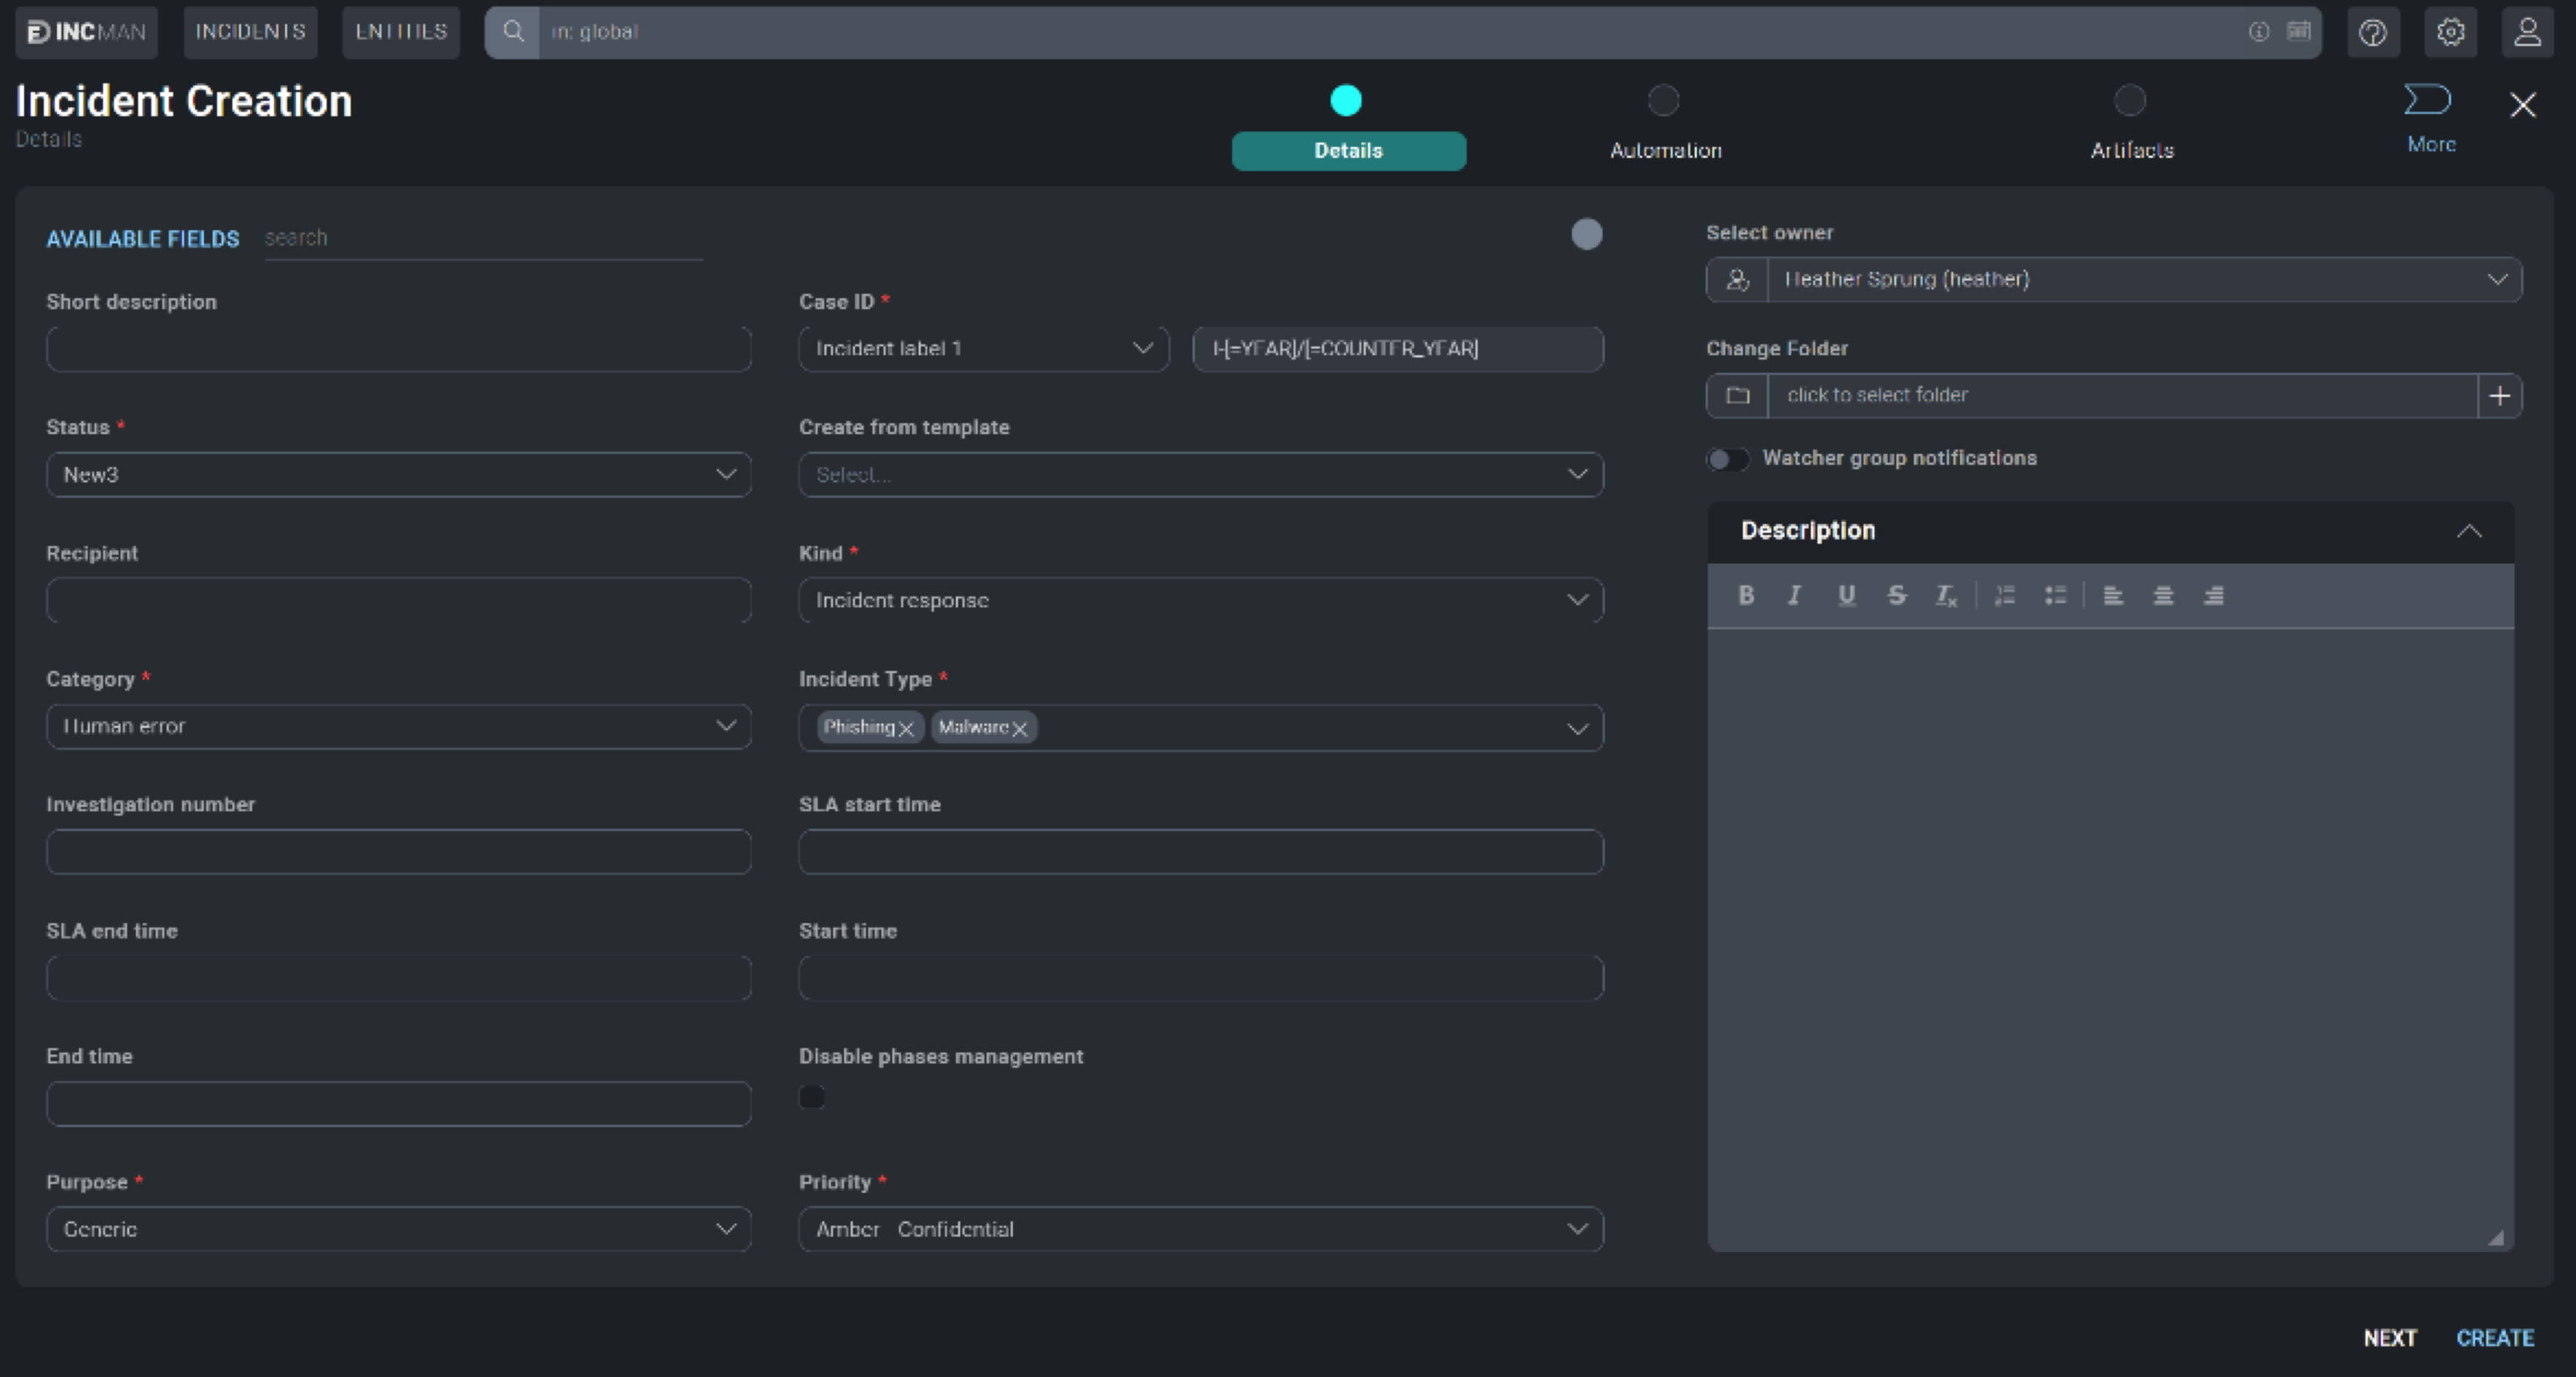
Create a New Incident Manually
To create an Incident manually, click the + Incident button on the top right-side of the screen.
A new configuration box will be displayed that contains fields an
investigator can utilize to develop their incident. Not all these fields
are mandatory. The ones which are required will have an asterisk (*)
marked next to it which indicates the field has a dependency within the
Cloud SOAR platform. These required fields can have their dependencies and
requirements adjusted in the Custom Fields section (click the cog icon (![]() ) > Customizations > Custom Fields).
) > Customizations > Custom Fields).
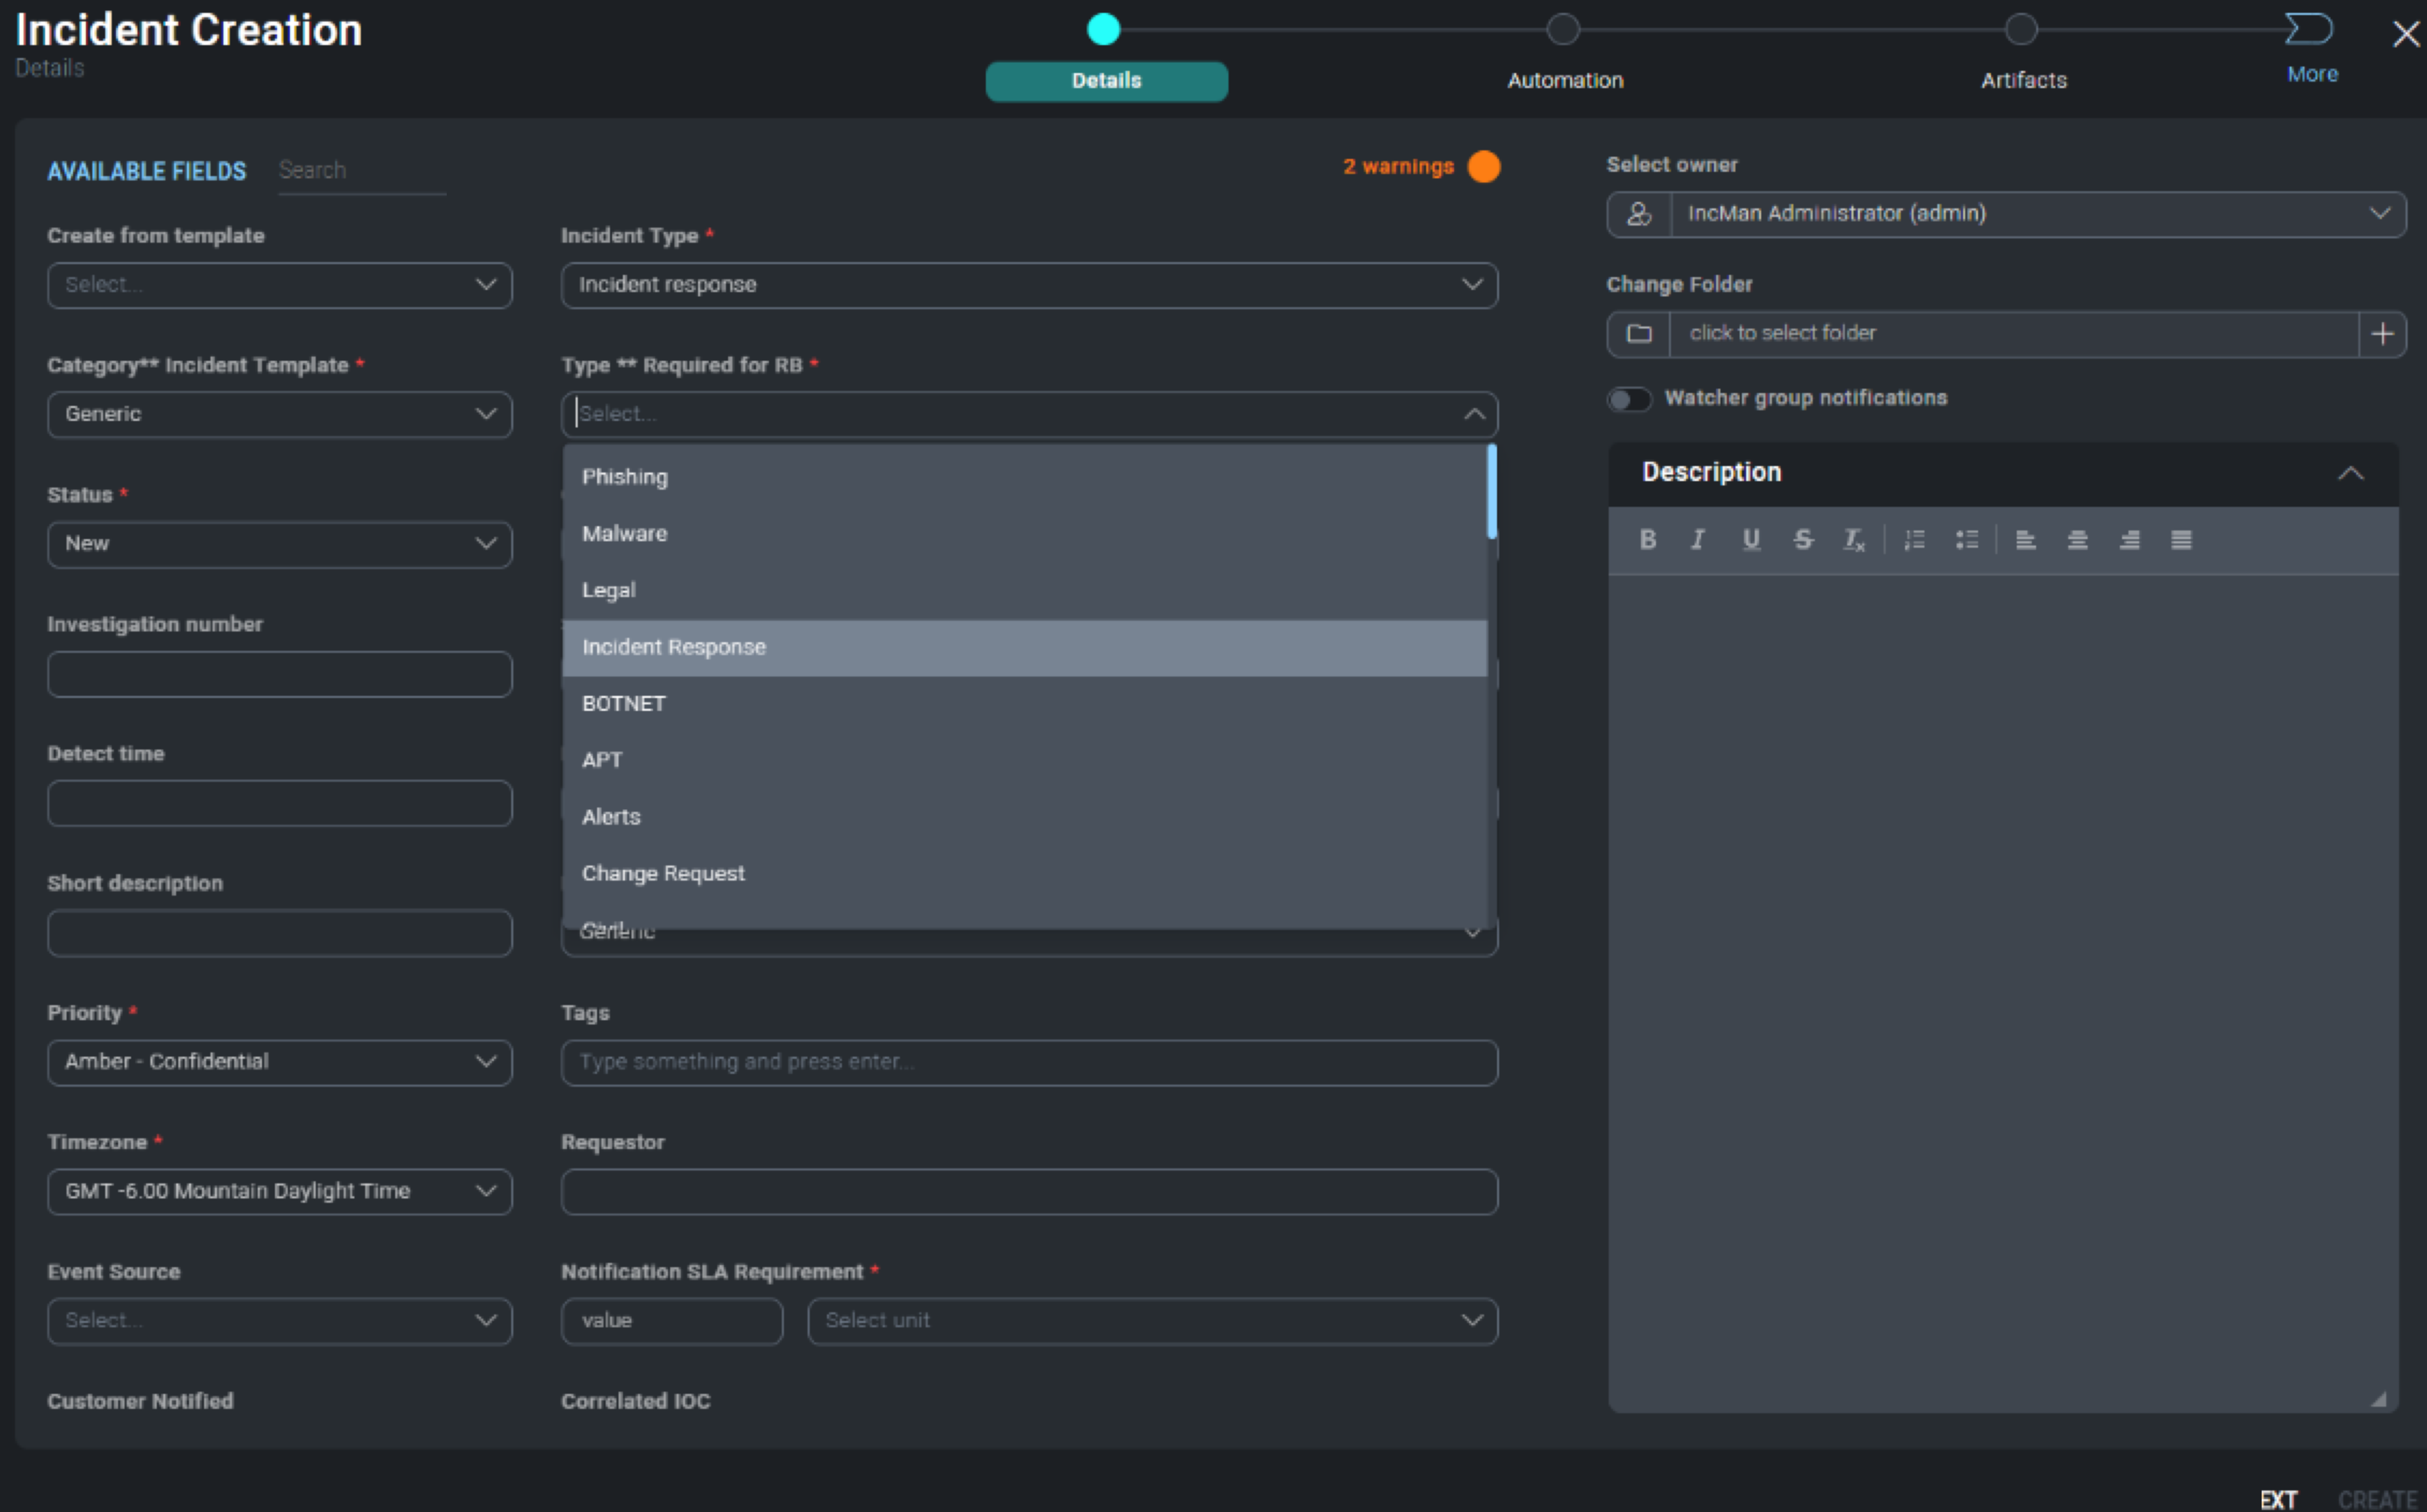
One of the most important fields is the Type field. This field will
dictate which Playbooks will be recommended later on in the configuration
process. See Custom Fields to modify the variables displayed in the
Type field.
Once the details page is completed, you will want to assign
appropriate Playbooks to be associated with the incident. In addition to
adding the playbook to the incident, you can also decide whether they
want the playbook to automatically execute upon incident creation by
sliding the Autorun button to On.
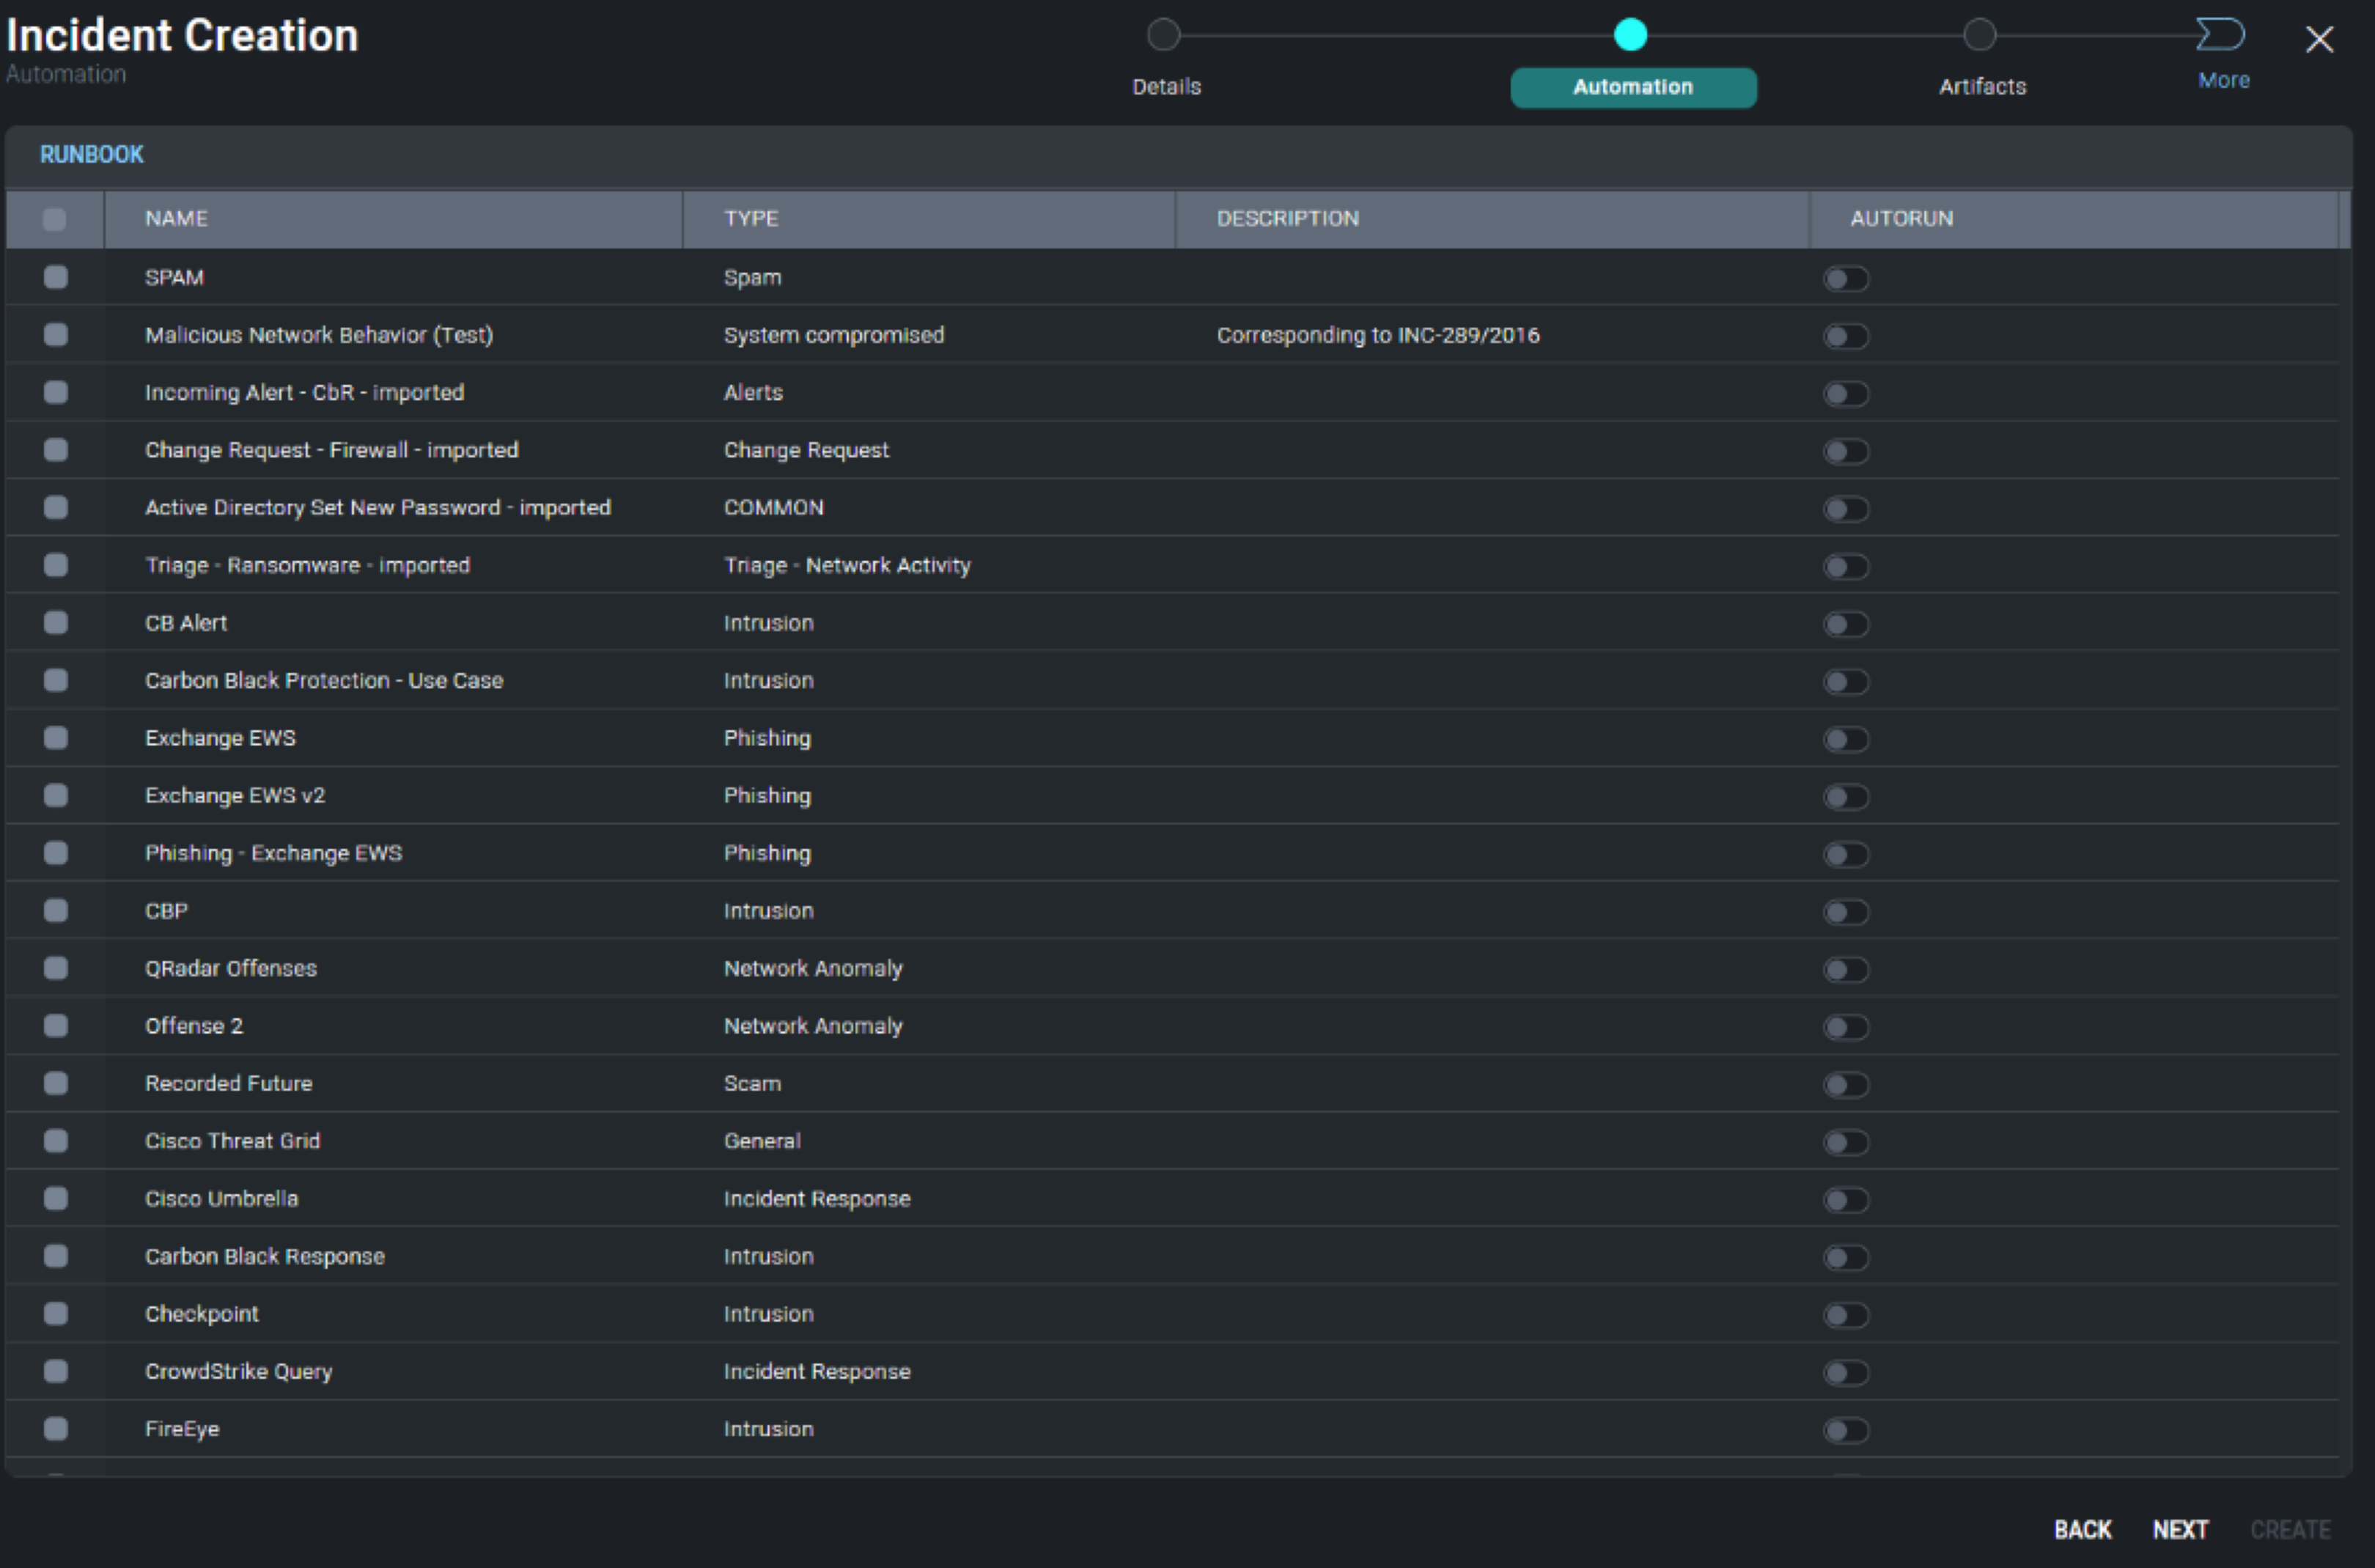
When creating an incident manually, the investigator may already have
artifacts that they would like to add to the incident. The Incident
Artifact section allows for the manual entry of new artifacts. To add a
new artifact click Add Artifact and choose what target field to append
the data and add its value. Once completed, click Next.
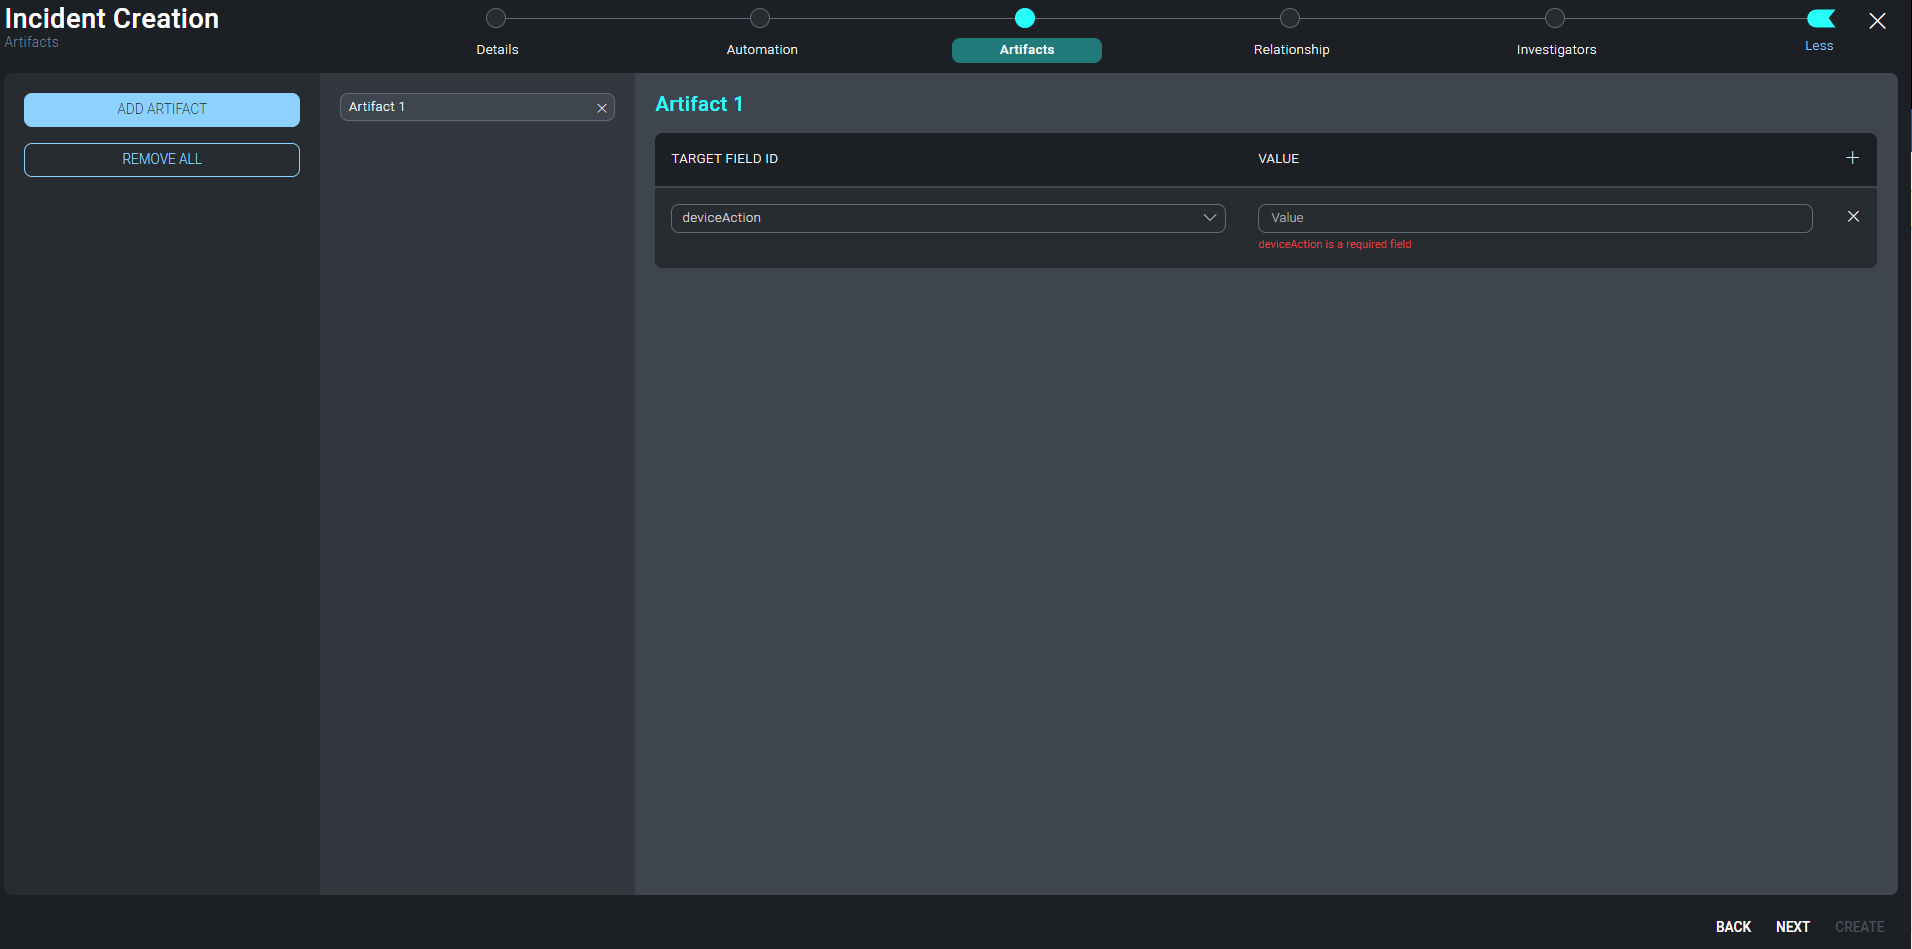
Incident Artifacts
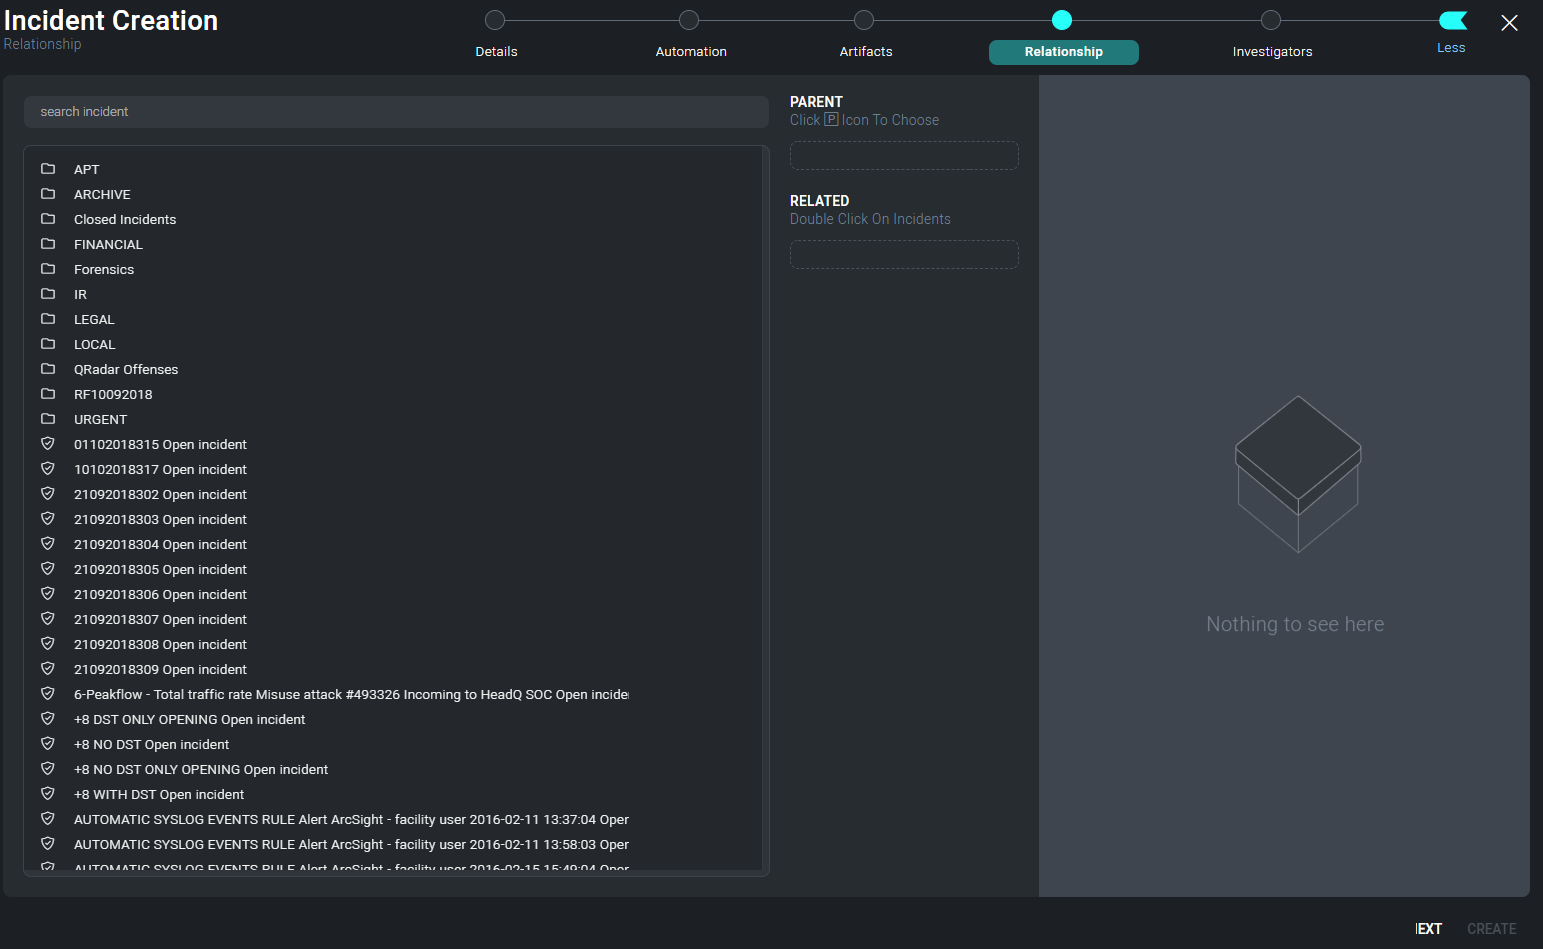
You have the option to create manual Parent/Child relationships between the new incident and any previous incident created in Cloud SOAR. Click the Advanced button at the bottom of the screen to select an existing incident to group together.
The final step in manual incident creation is to add an investigator or a group of investigators to the incident. Select an investigator or group from the left side of the screen by double-clicking on their name and the investigator will be added to the investigators pane. Once finished, click Create.
Incident Report
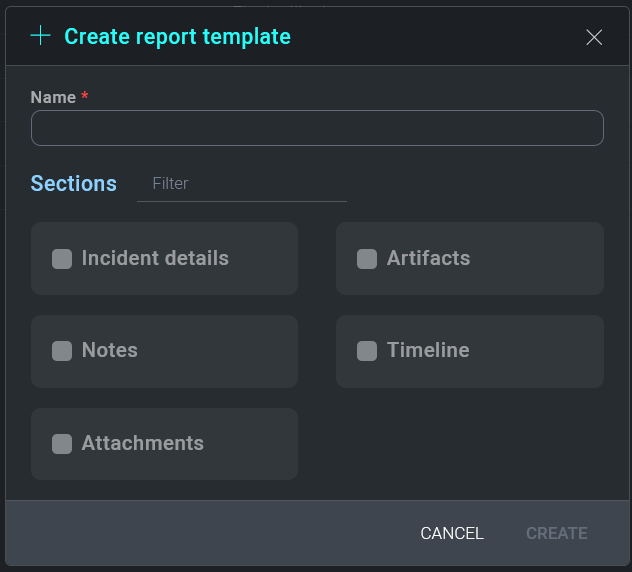
The Report Template section allows you to create templates for custom reporting. The Report Template screen contains a list of all current report templates. To add a new report template, click on the + icon above the report template list.
The Details tab of the new report template window allows you to specify a unique name for the template as well as a template category and any appropriate tags.
The Sections tab of the new report template window allows you to drag and drop sections of the incident into the report template. All incident sections are listed in the left-hand pane. Dragging incident sections to the right-hand pane will add the section to the report template.
Sections will be printed in the report in the order they appear in the right-hand pane. Once satisfied with the selection, click Save.
Custom Fields
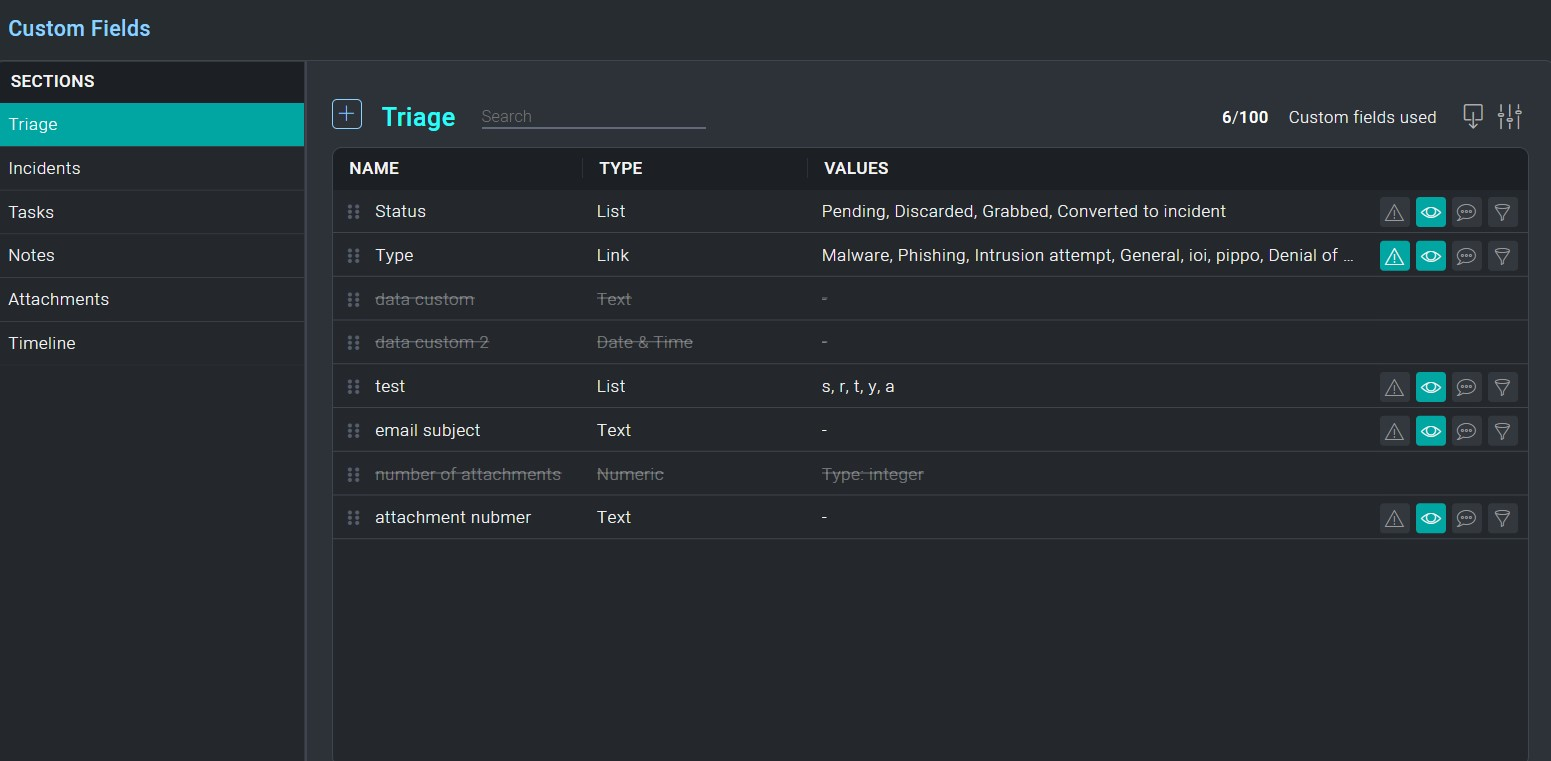
The Custom Fields section allows you to customize all fields within the Cloud SOAR platform to better suit your environment. All fields are pre-populated by default and can be revised with environment-specific variables by manually creating or updating the fields or by importing a file which is formatted with entries for each line.
To begin defining Cloud SOAR's custom fields, select a Cloud SOAR section from the list on the left-side of the screen to view all available fields. To edit an existing field, select the next to the field to be updated, or to add a new field select +ADD at the bottom right-side of the screen. A new configuration box will be displayed.
The only attribute of an existing field which cannot be modified once the field is created is the field Type, such as Text or Date. You can rename internal values but only personal values, which are denoted by having a trash can symbol next to the entry, can be deleted from the section's custom fields.
Each section of Cloud SOAR supports different numbers of custom fields. The Incidents section, for example, supports up to 100 custom fields. The number of custom fields remaining will be displayed next to the section name at the top of the page.
Custom fields added by a user can be renamed or deleted. However, default fields can only be renamed, they cannot be deleted. Although a custom field may be deleted, it will not increase the number of custom fields available. Since the deleted field may contain data that was entered prior to the deletion of the field, the custom field remains reserved.
For each field, a name and a type will always be required. A complete list of field types is listed below. Additional fields will be required or optional depending on the type selected. For example, a text field allows an optional default value to be specified, while a list field provides many additional options.
The Visualization tab allows you to disable the field, specify if the field is used within Incident notifications, and set conditions under which the field is visible. For example, a field can be made visible only if the incident is of a certain type.
The Additional Info tab allows you to provide additional information or context to the field, such as how the field should be used or where the data can be located.
Fields may be reorder in the Custom Fields section to change the order in which they appear on the Cloud SOAR screen. To change the order of the fields, click and hold on the six dots to the far left of the field name, then drag the field to its desired location.
Custom Field Types
| Field Type | Description |
|---|---|
| Calculation | Perform a calculation between two fields or between a field and a static value |
| Checkbox | Checkbox |
| Color Picker | Interactive color picker to select a color |
| Date | Date only picker |
| Date & Time | Date and time picker |
| Email Address | Email address Available to use in actions which require a email input |
| Filename | Filename Available to use in actions which require a filename input |
| Hash | Hash value Available to use in actions which require a hash input |
| IP Address | IP Address Available to use in actions which require a IP address input |
| List | Dropdown list |
| Multi Select List | Multiselect list box |
| Numeric Textbox | accepting numeric values only |
| Tags | One or more user defined tags |
| Text | Free text |
| Time Interval | Numeric time interval which can be used as a value in another calculated field |
| Timezone | Timezone list dropdown |
| URL | URL Available to use in actions which require a URL input |
| User Details | User details, such as a user name. Available to use in actions which require a user details input |
Using Custom Fields for SLAs
Custom fields can be used to calculate any number of custom service level agreements (SLAs). This can be achieved using combinations of Date, Date & Time and Time Interval fields.
In the following example, five custom fields have been added to provide
information on the status of an organizations Notification SLA. Two of the custom fields require user input:

- Notification SLA Requirement will be used to store the SLA time interval, such as 5 minutes.
- Customer Notified will allow you to enter the date & time the customer was notified.
The remaining three custom fields require no user input and are calculation fields only:

- Notification Due By will calculate and display the date & time the notification must be conducted by adding the Notification SLA Requirement field to the Start Time.
- Notification Time Remaining will calculate and display time remaining before the notification must be conducted by subtracting the Current Time from the Notification Due By field.
- Actual Notification Time will calculate and display actual time taken to notify the customer by subtracting the Start Time from the Customer Notified Time.
These Custom Field settings will appear in the Cloud SOAR Incident screen as follows:
Credential Manager - CyberArk Configuration
You can use CyberArk Credential Manager to manage data that will be used in integration resources.
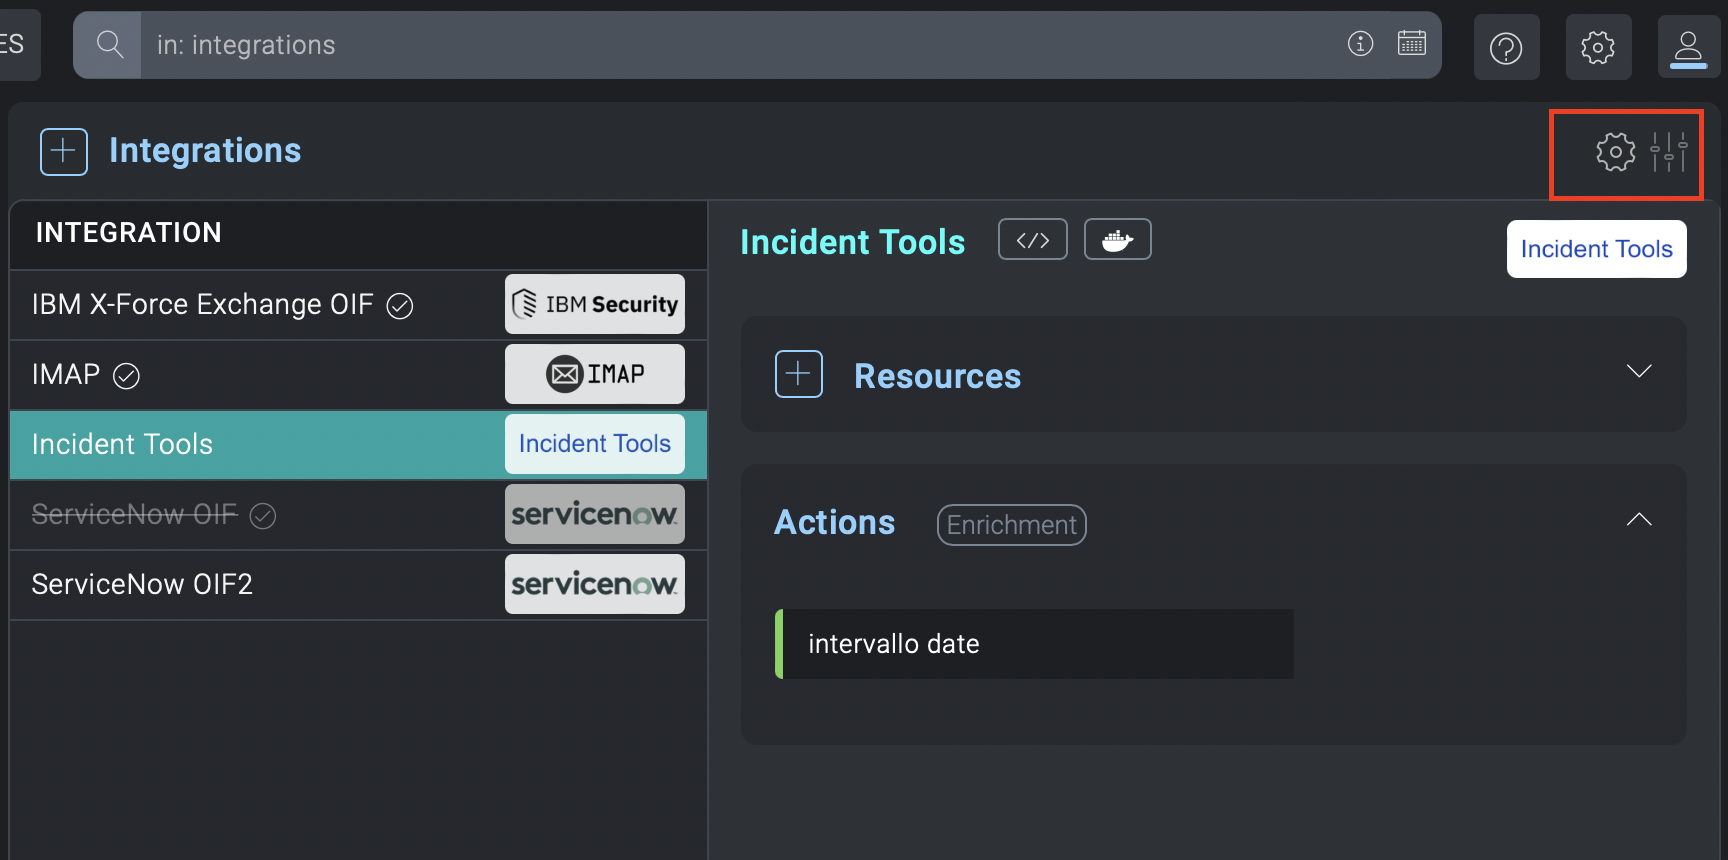
Using the cogwheel icon on the right in the integrations section, the main section of the CyberArk configuration opens.
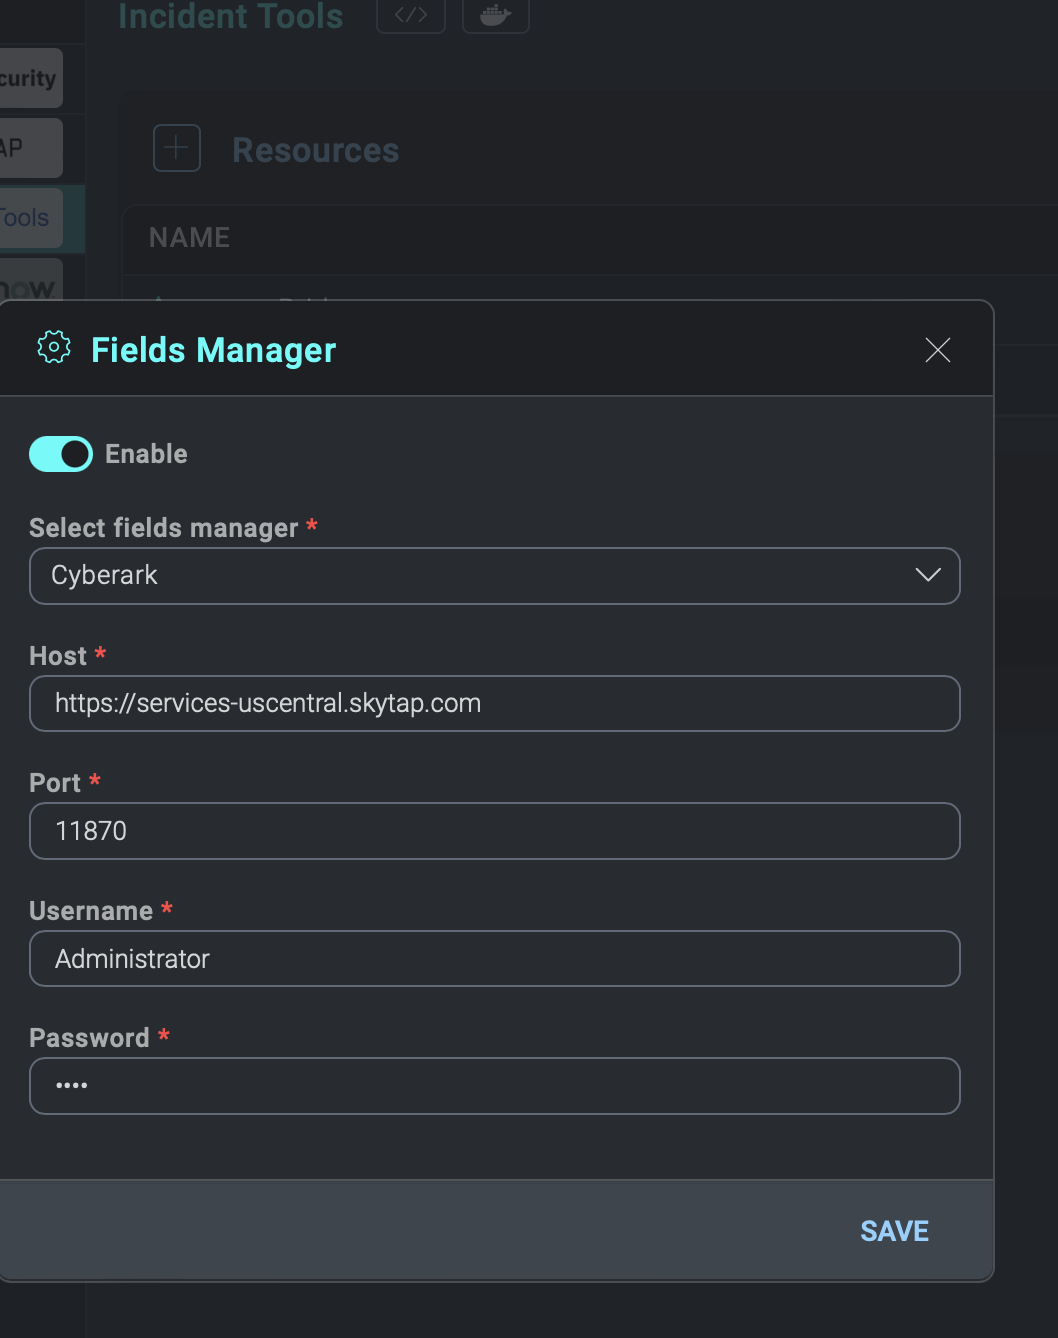
Here you can set URL and port of the Components server, and the credentials needed to connect to CyberArk. The Enable checkbox can be enabled or disabled later.
If enabled, when you go to open the detail of a integration resource you'll find a new checkbox (Use CyberArk fields) at the top already active. If the checkbox on above window is disabled, the checkbox in the resource window will be disabled by default, and it will not be possible to activate it.
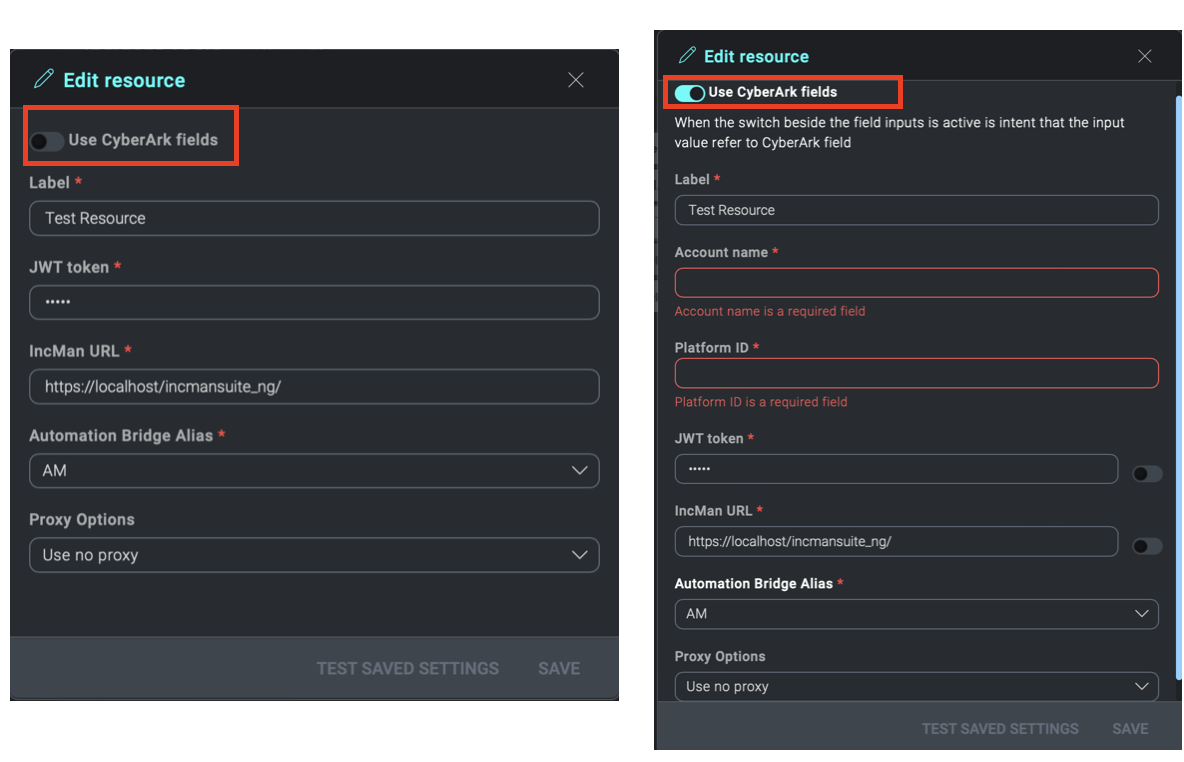
If the checkbox Use CyberArk fields is enabled, two new mandatory fields will appear:
- Account Name > userName in CyberArk
- Platform ID > platformId in CyberArk
Near to the fields there will be the relative toggle that will enable the related field for use on CyberArk.
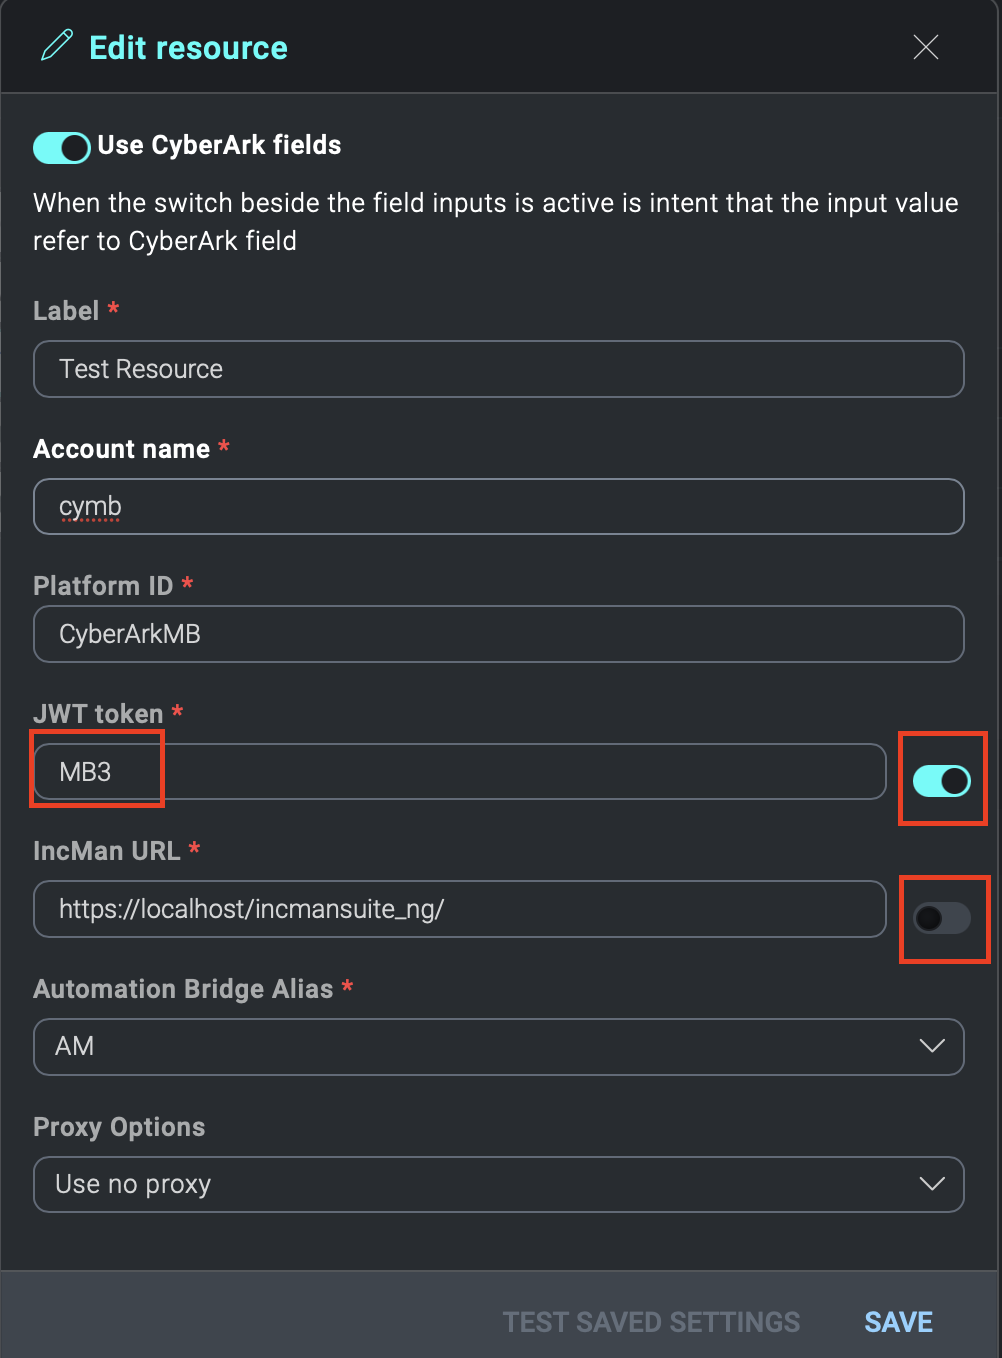
In the image above, you can see two custom fields of the resource with their toggles. The first field has been enabled to use CyberArk, while the second not.
Within the CyberArk fields you need to enter the name of the Properties present in the corresponding Platform ID on CyberArk.
Pay attention to uppercase and lowercase letters.
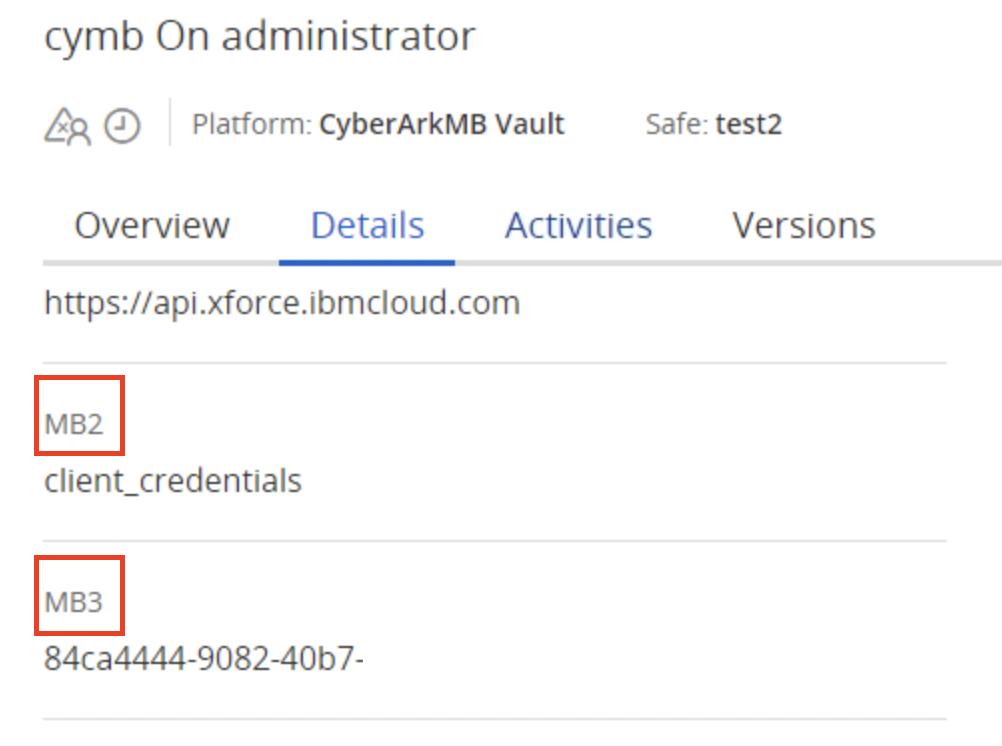
Through the name of the Properties,(in the above case MB3) during the execution of the resource, it will be replaced with the value present on CyberArk for that resource, in our case 84ca4444-9082-40b7-.
In the fields enabled for CyberArk, in addition to the account properties, you can also recall the value of the CyberArk Account password, to do this, write the word Password in the field.
If the checkbox for CyberArk is enabled for a resource field, the data type allowed for that field will be string only, even if the same field was configured to accept lists, checkboxes, numbers, and more.
The only property that will be retained is the mandatory nature of the field.
Values entered in the field not enabled for CyberArk, if previously entered and saved, will be retained if the field becomes enabled for CyberArk. The same is not true otherwise.
If the CyberArk switch is enabled and one switch on the field line is disabled, that CyberArk field value will be saved empty.
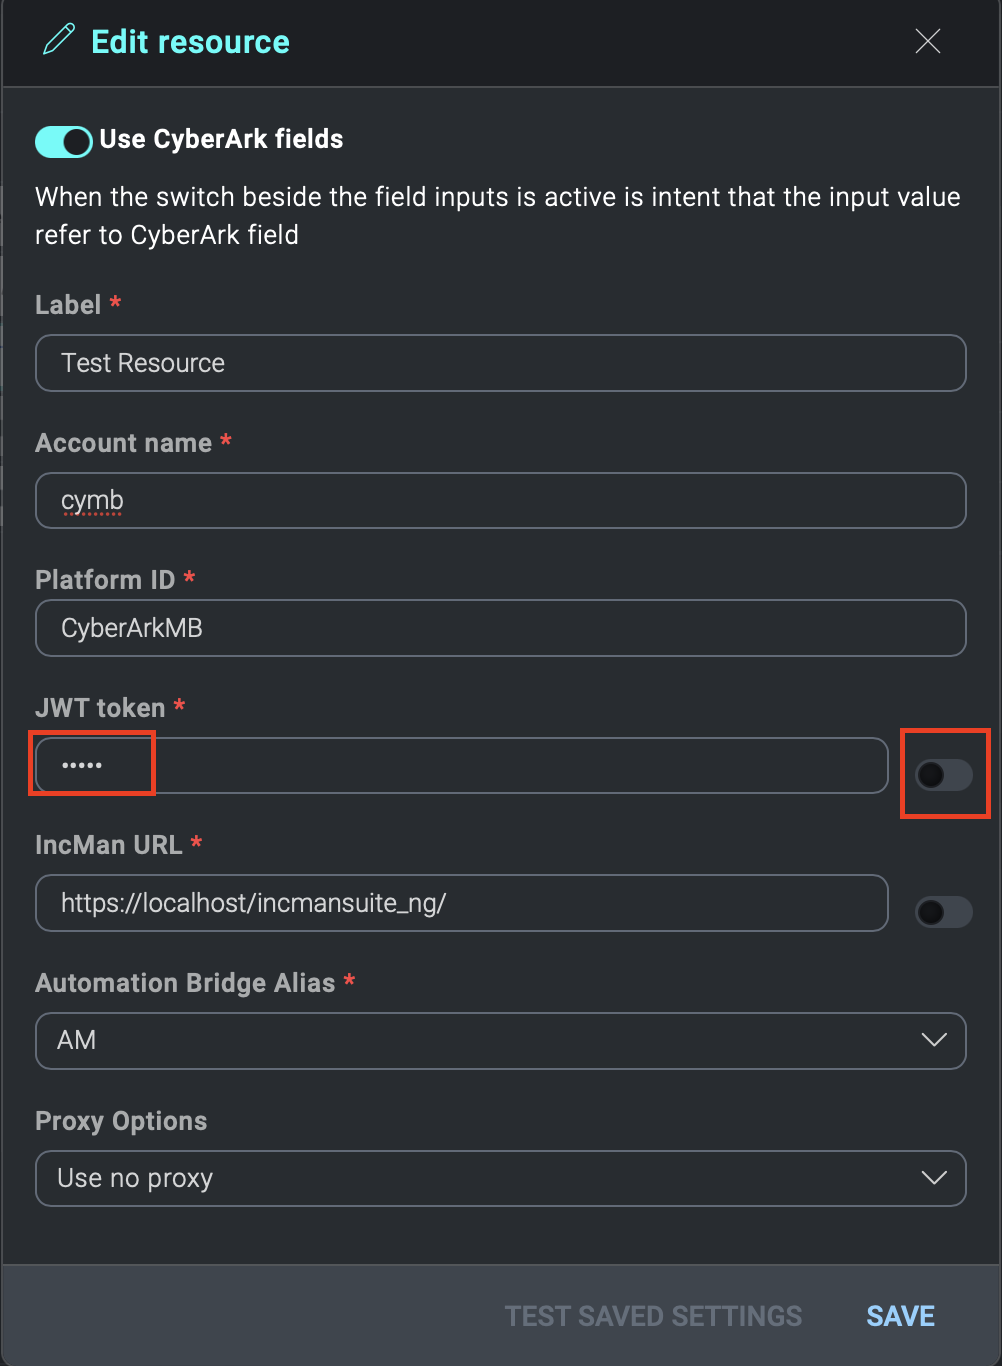
Configuring the automation bridge for CyberArk
If you are using CyberArk, you will need to add the following certificates given by CyberArk:
**RootCA**new.crt**
**client**new.crt**
**client**new.pem**
to the /opt/automation-bridge/ directory.
The names must be exactly the same.
Triage
The Cloud SOAR Triage module ingests events via the Cloud SOAR API. You can use it to triage events which may be unverified or have a low confidence level before they are converted to incidents. The Triage module can be completely customized for use cases from financial fraud to network IDS alerts.
Display Settings
Triage display preferences can be customized from Settings > Customizations > Triage. Triage events can be color coded based on status to easily distinguish them from each other when viewing the list of Triage events.
The name of the module can also be modified from Triage to a name of your choosing. The new name will be displayed in all areas of Cloud SOAR, including the menu and logs.
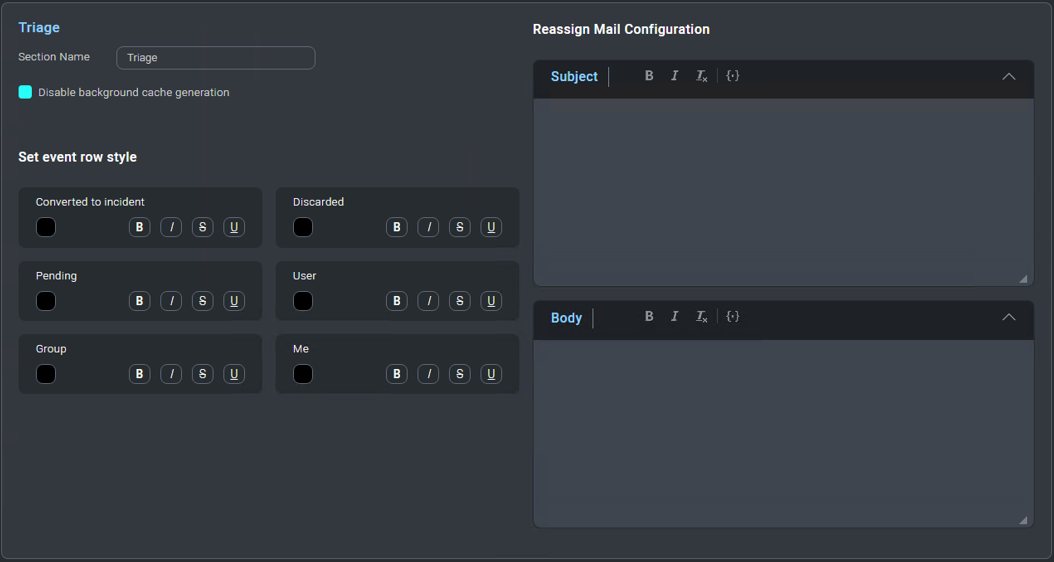
Field Settings
By default, the Triage module contains two fields, Status and Type. Additional values may be added to the Status field; however, the Type field is directly linked to the Incident Type field and cannot be modified directly. New types must be added from the Incidents section of the Custom Fields page.
Up to 100 custom fields and be created for the Triage module, allowing customization for any use case. To add additional fields, navigate to Settings > Customizations > Custom Fields and select Triage Events (or the name of the module if you have renamed it from the default of Triage).
To add a new field, click Add from the upper right-hand corner and configure the field as desired. Note that to be able to filter events in the Triage module based on the values of a field, Use as filter must be checked in the Visualization tab when adding or modifying a field.
As fields are created, they will be assigned a number starting at 1,
which will be used to identify the field when adding events via the API.
The first field added will be identified as opt_1, the second as
opt_2, and so on. Regardless of the ordering of the fields on the
screen, these numbers will remain the same. If a field is deleted, the
number will not be reused. For example, if you have defined opt_1
through opt_8 and delete the field opt_8, the next field added will
still become opt_9. It is important to remember these field numbers, as
they will be used when the API is invoked.
Working with Events
The Triage module is accessible from the Incidents section by clicking on Triage (or the name of the module if you have renamed it from the default of Triage). All events which have not been converted to an Incident will be displayed in a sortable table on the Triage main screen. Events may be sorted by any column values by clicking on the appropriate column.
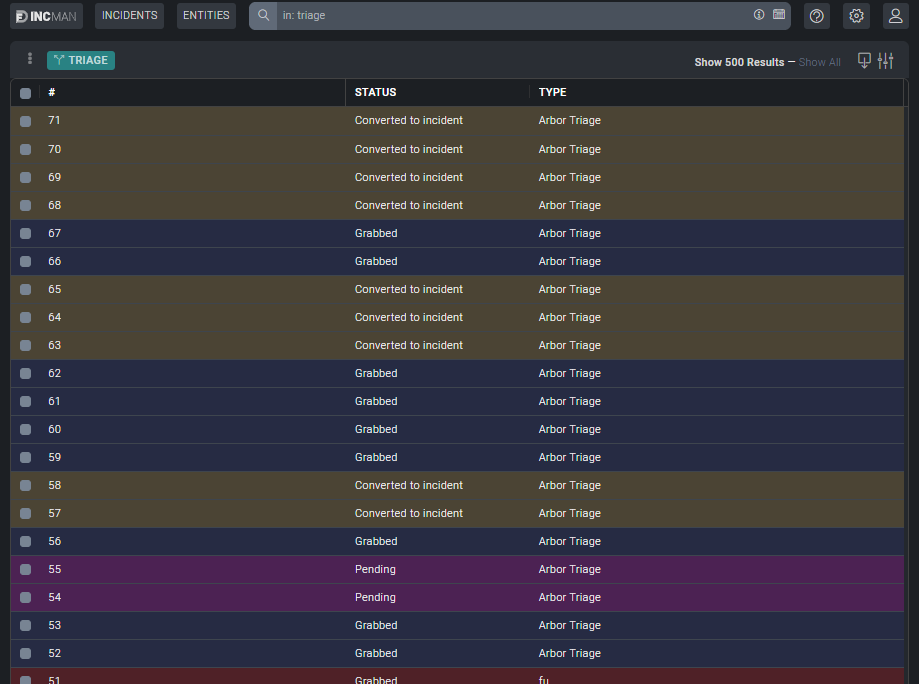
The list of events can be filtered by any of the fields listed in the filter section at the top of the Triage main screen.
To view the details of a Triage event, click on the box and arrow icon in the Actions column for the event. If additional information is available, it will be displayed in this Event Details screen.
To begin triaging an event, click on the person icon in the Actions column for the event to grab the event. Once an event is grabbed by an analyst, any Playbooks defined for that incident type will be automatically executed and the results will be displayed in the Results section of the Event Details screen. Because all Playbooks for the specified incident type are automatically executed as soon as the incident is grabbed, it is recommended that separate incident types and Playbooks be created for Triage events.
After triaging the event, the event may be reassigned to another user for further analysis, discarded or converted to an incident. To reassign the event to another user, click on the circular arrow icon in the Actions column for the event. To discard the event, click on the trashcan icon in the Actions column for the event.
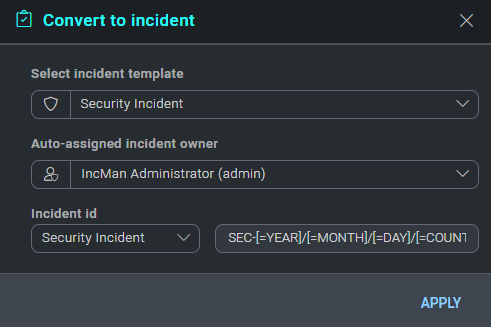
To convert the event to an incident, click Convert to Incident in the far right-hand corner of the Event in question. Select the appropriate incident template, owner and label, then click Save. The event, including all enrichment information gathered from any Playbooks, will be automatically converted to an incident.
