Monitoring Using our Kubernetes Solution
This page provides insights for effectively monitoring your Kubernetes environment with Sumo Logic, and is organized according to the individual areas of the Kubernetes architecture.
Navigating Your Kubernetes Environment
Sumo Logic allows you to monitor and troubleshoot your applications in Kubernetes using an intuitive mental model of Kubernetes hierarchies, instead of the server-based focus.
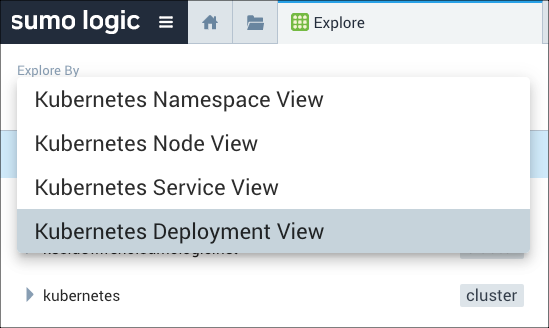
We currently provide four hierarchical Views of the Kubernetes system: Node, Deployment, Service, and Namespace. These views make it easy to traverse your Kubernetes hierarchy to monitor specific components, identify problems, discover root causes, and take progressive action.
- Node: Observe the infrastructure topology of resources (e.g., physical nodes, VMs) on your private cloud, public cloud or bare metal.
- Deployment: Observe how your Kubernetes deployment(s) perform against your specified criteria and manage changes.
- Service: Observe how your Kubernetes Service(s) interacts with your other services within and outside your cluster.
- Namespace: Track environments with many users spread across multiple teams, or projects like dev, lab, and prod.

These intuitive hierarchies can be accessed from the Explore tab.
Open Explore
Explore is an out-of-the-box Sumo Logic view that you can use to navigate a visual representation of your Kubernetes stack.
To open Explore, do the following:
- Log in to Sumo Logic and click + New on the top menu bar.
- From the dropdown menu, choose Explore.
In order to start monitoring your Kubernetes environment, you first have to setup data collection and install the core Kubernetes dashboards by following the steps in our quickstart guide.
To navigate Kubernetes environment and analyze the landscape, do the following:
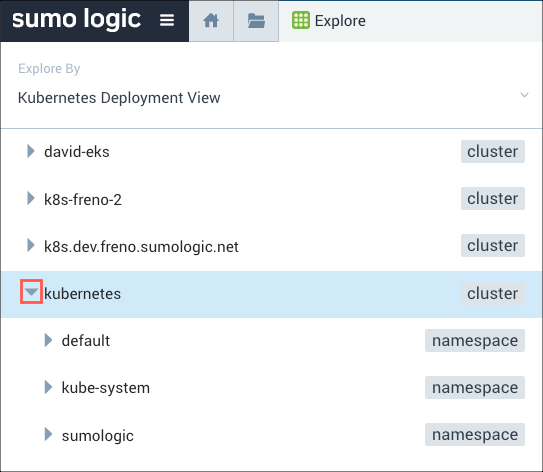
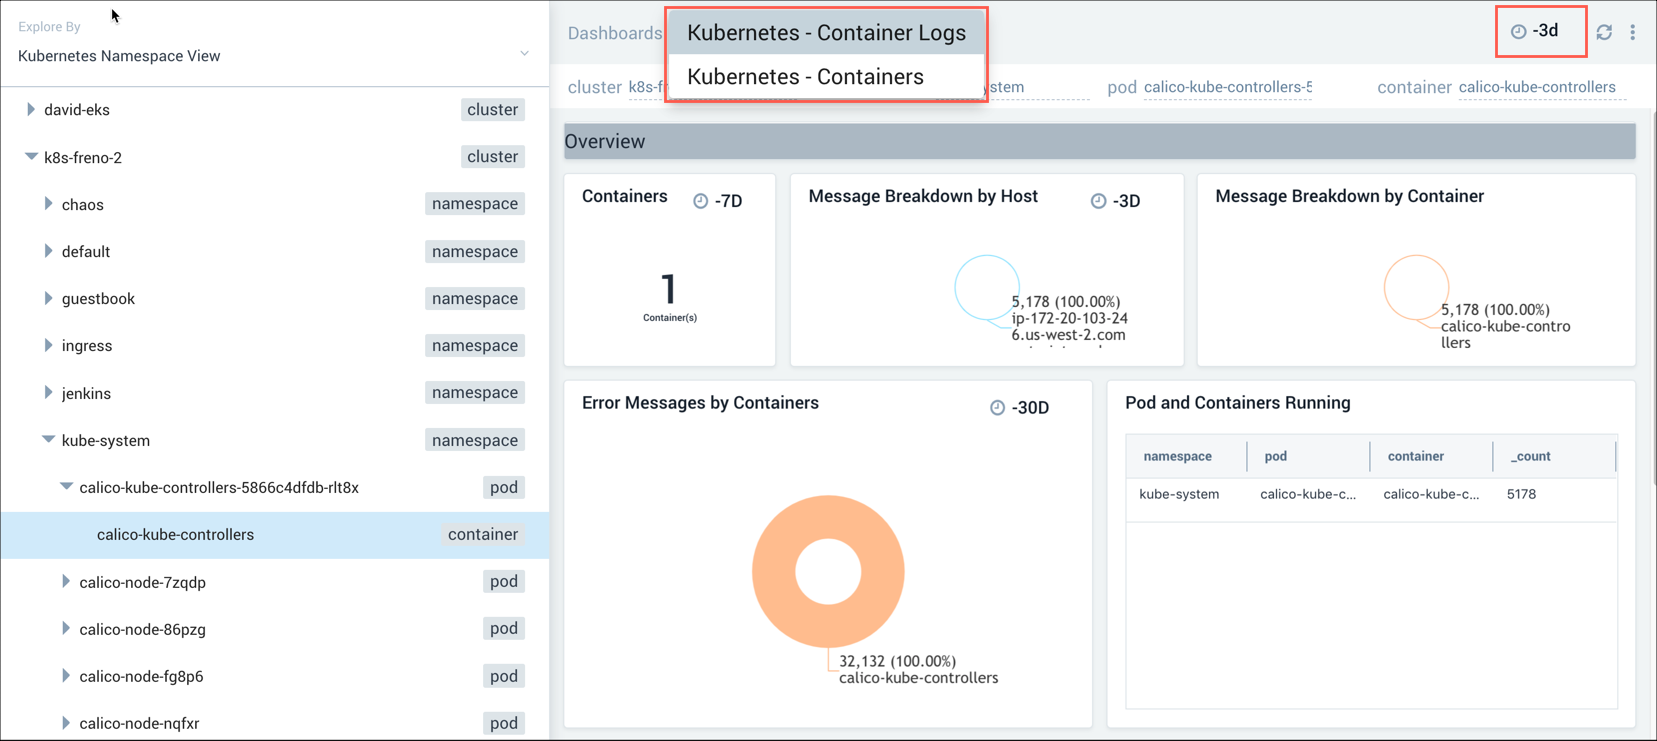
- At the top of the navigation panel, click Explore By to expand the menu and make a selection for the top level hierarchy. The contents of your selection appear below.
- Click the arrow to the left of a content name to expand and view its contents.
- Dead entities are shown faded:
- Drill down into the clusters to view the pods and containers. The data for your selection is displayed in the panels of the dashboard on the right.
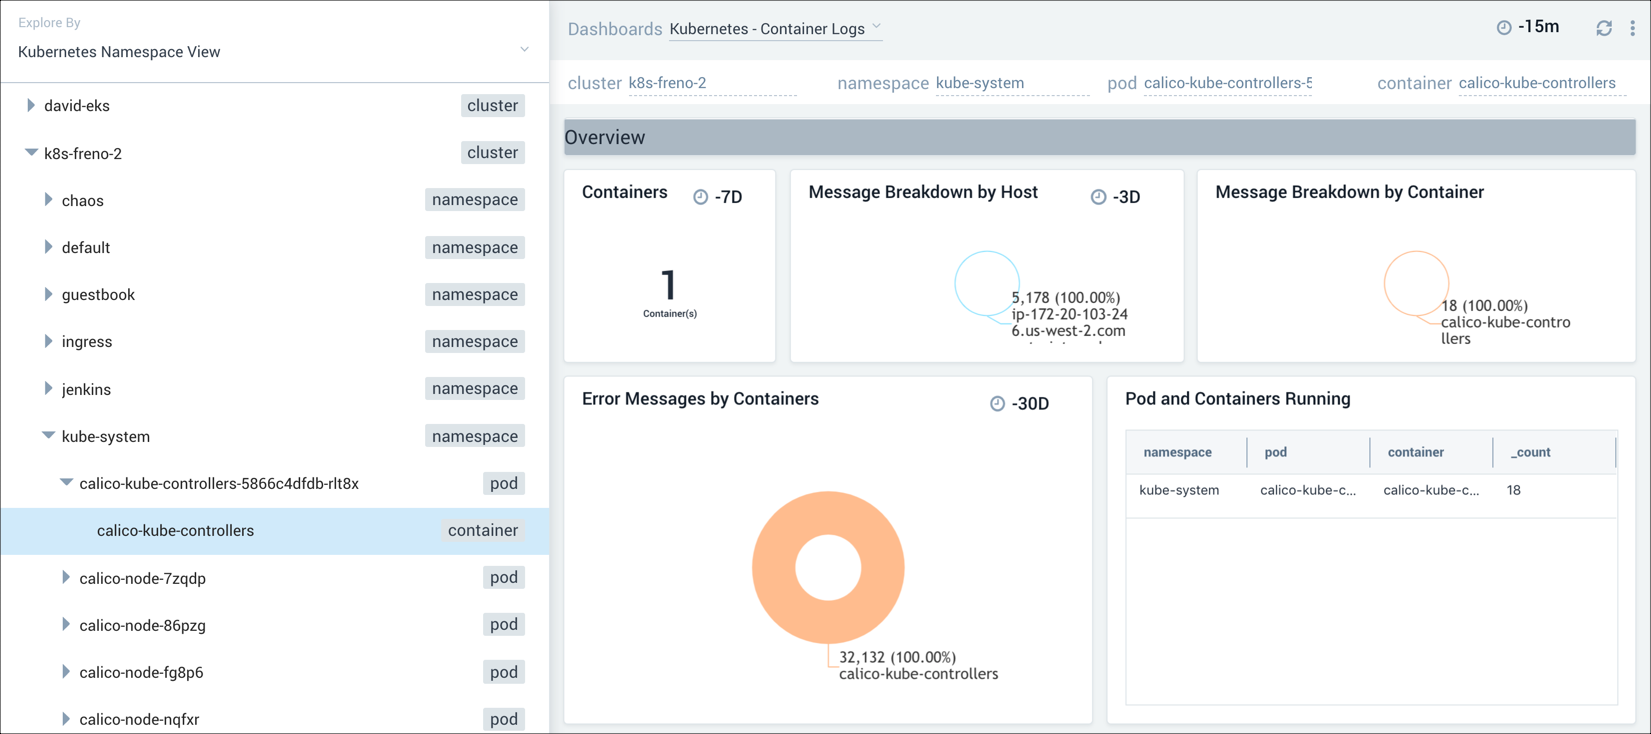
- Optional: Select another type of dashboard display from the dropdown menu at the top of the dashboard, and select another time interval.
Drilling into related content
Sumo Logic provides relevant log searches and dashboards to consider investigating, as well as other locations with relevant content. This facilitates quickly discovering the root cause and devising a plan of action.
To discover and view related content, do the following:
- Select the graph data point you are interested in. In the following screenshot, we selected a cell in a honeycomb chart. A panel appears on the right of the window with details and a list of related content links.
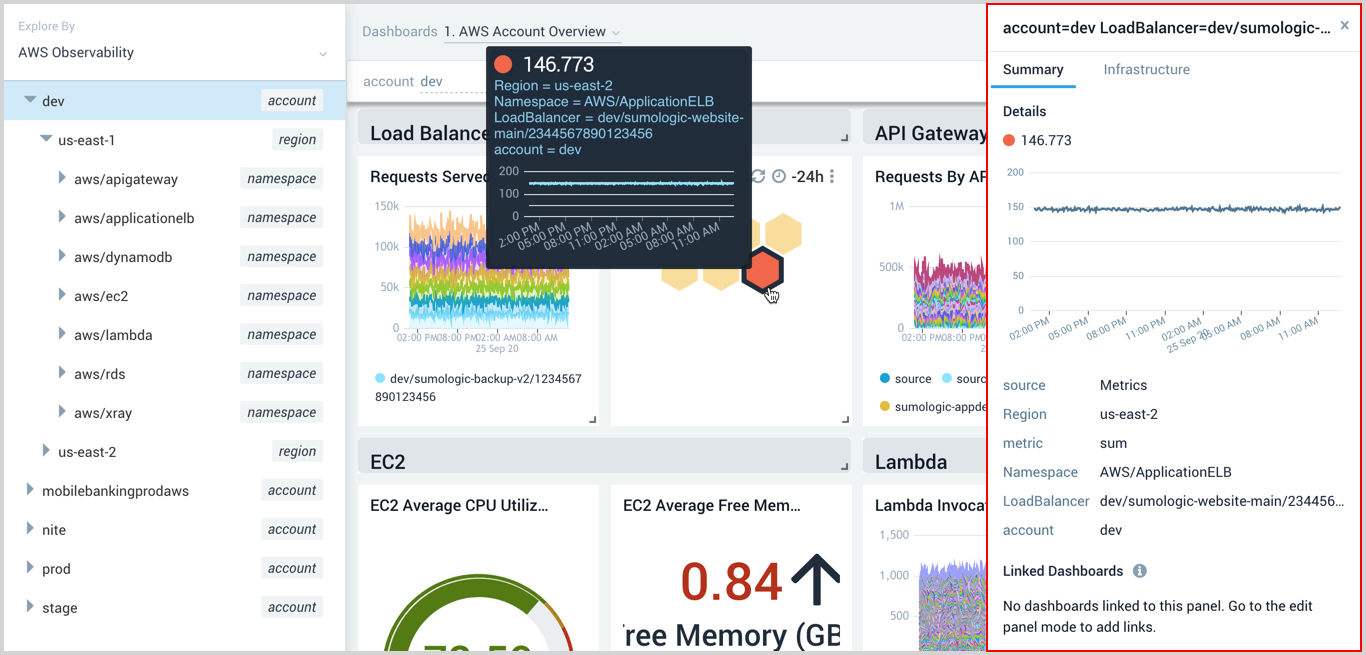
Summary tab
Select links from the Summary tab, to go directly to:
- Linked Dashboards
- Recommended Dashboards - Currently, only dashboards from the Kubernetes App are supported.
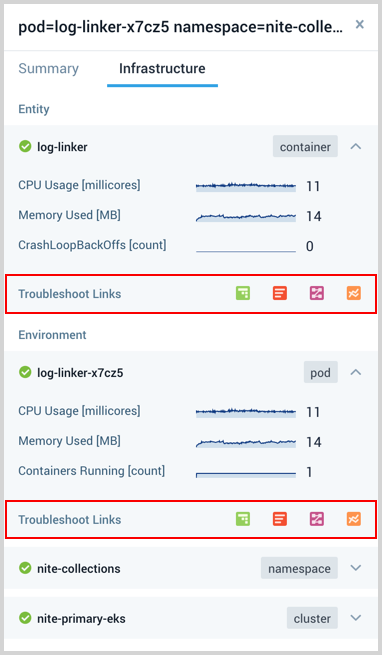
Infrastructure tab
The Infrastructure tab provides the following Troubleshooting Links for related Entities and Environments. To investigate, click an icon to launch another feature against the entity or environment. An icon is not available if it's irrelevant.
 Explore
 Logs
Logs Traces
 Metrics
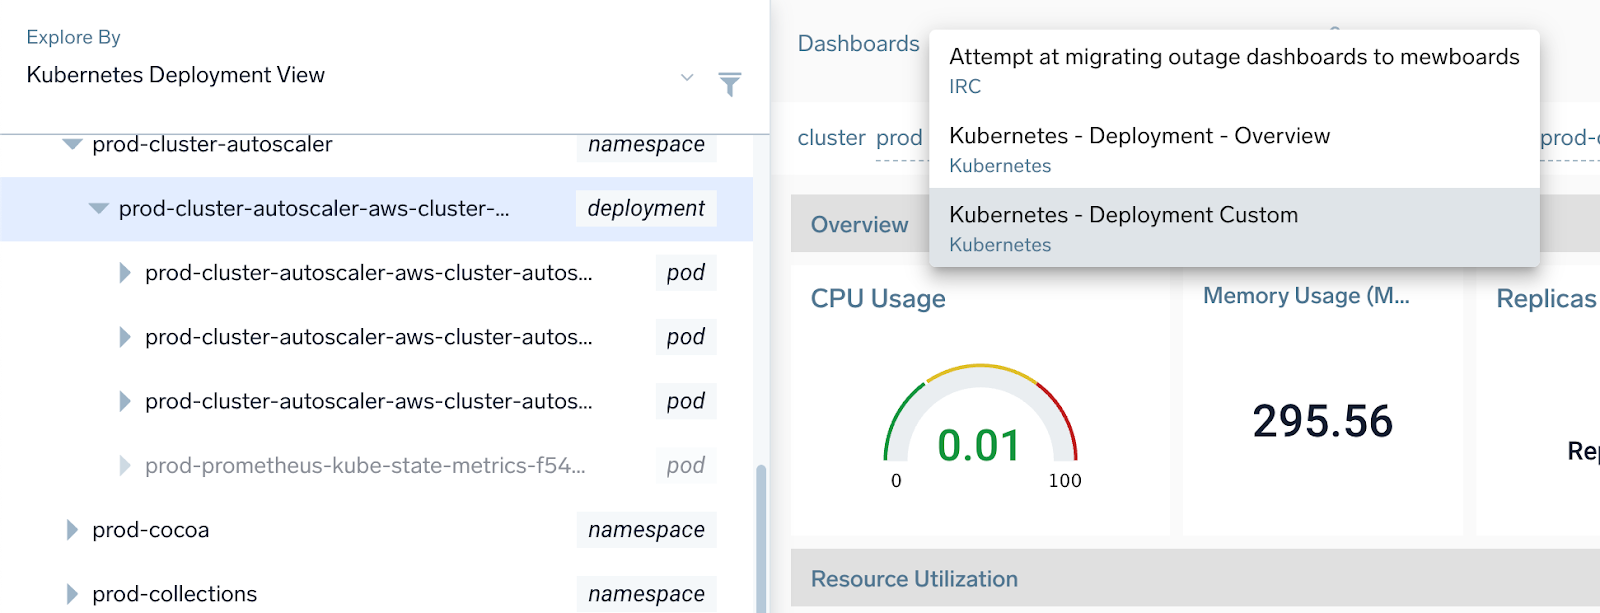
Custom dashboards in Explore View
You can make your own custom dashboards to show up in the Explore view by using the stack linking capability within Dashboards (New).
In order to link a dashboard to an existing Kubernetes hierarchy, your entity key in Stack Linking must be the same as the explored entity on the Explorer View.
For example, if you want you custom Kubernetes deployment dashboard to show up in explorer, you will have to add the following entities in the stack linking (as shown below), since those entities are used as filters on the Explore View:
- Cluster
- Namespace
- Deployment
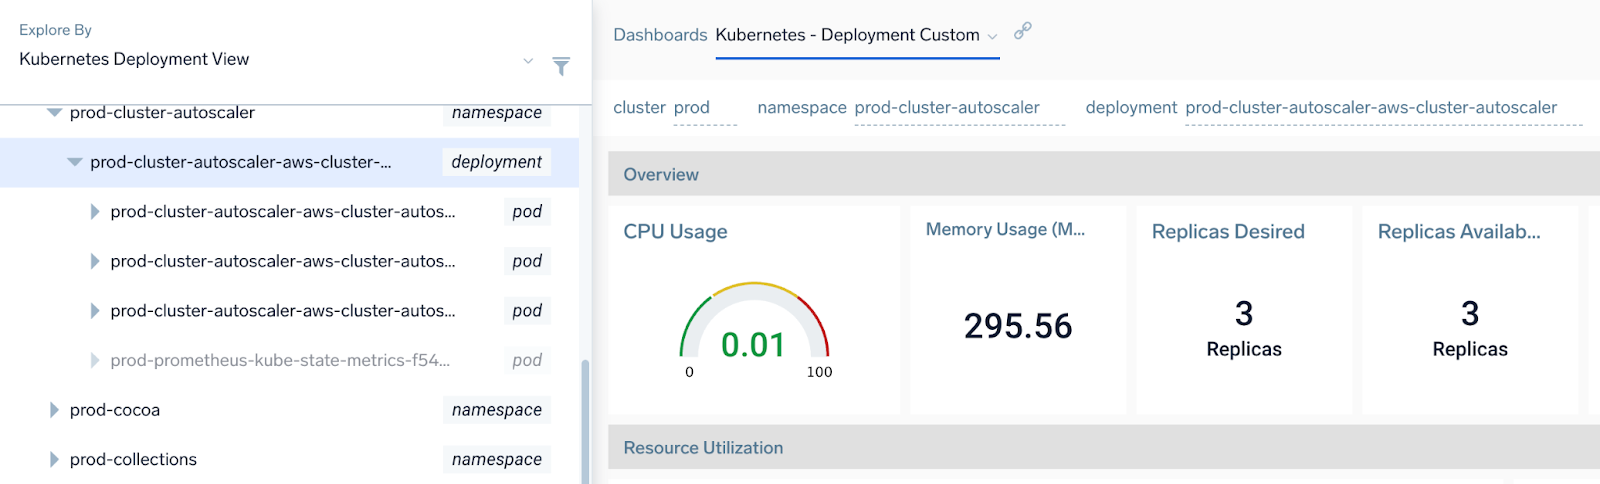
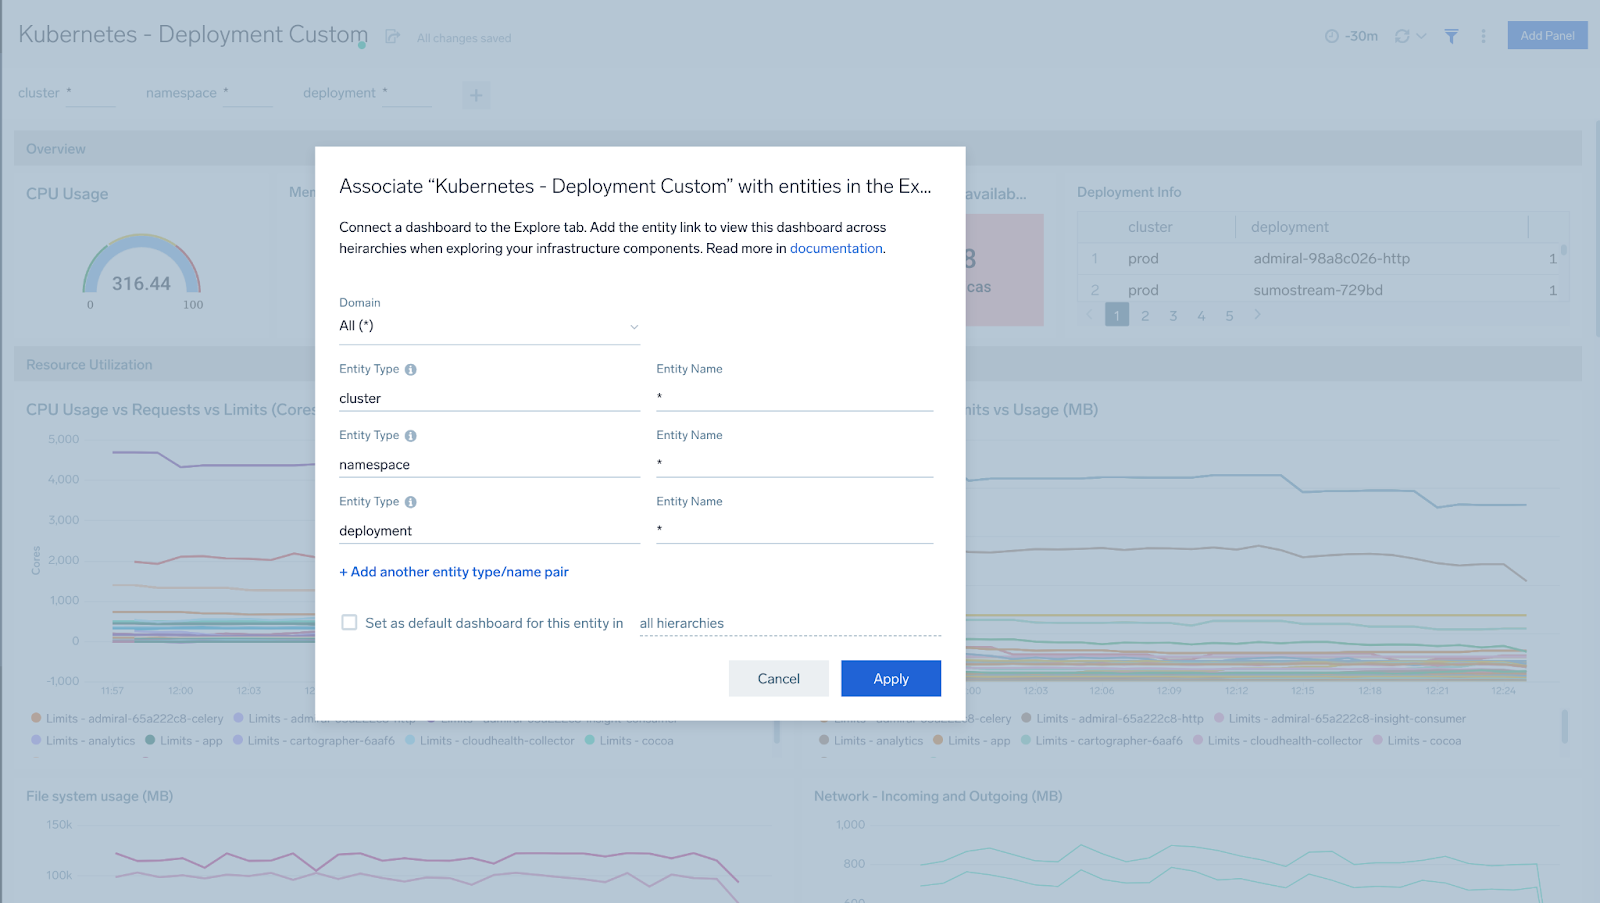
Once you have created the stack linking, your custom dashboard should appear in the list of dashboard associated with a specific entity view in explorer.
Using Metadata to Power Your Search
You can create fields with key-value pairs that label logs with custom metadata. Referencing log data with fields based on meaningful associations makes searches easier and more intuitive. Sumo Logic allows you to add custom fields to collectors that define key-value pairs at the source level. The custom fields in the metadata streams are then automatically extracted for searching, querying, and graphing. This allows you to view results for intuitively referenced subsets not traditionally tagged as source categories.
This page shows you how to define a custom field on a collector, and then how to effectively use the custom metadata to search log data.
To learn more about adding meaningful information to your data so you have more control and an easier time referencing data in searches, see the Data Enrichment and Fields pages.
Adding custom fields to collectors
You can add custom fields to collectors for more intuitive searches, partitions, and Role Based Access Control (RBAC) queries. After which, the log data that passes through the collector automatically inherits the custom metadata. You can create a custom field label for anything that is "collected" and adapt your logs to familiar naming conventions.
Custom metadata is usually set up by your administrator. Check with your site administrator before adding a custom key-value pair to a collector.
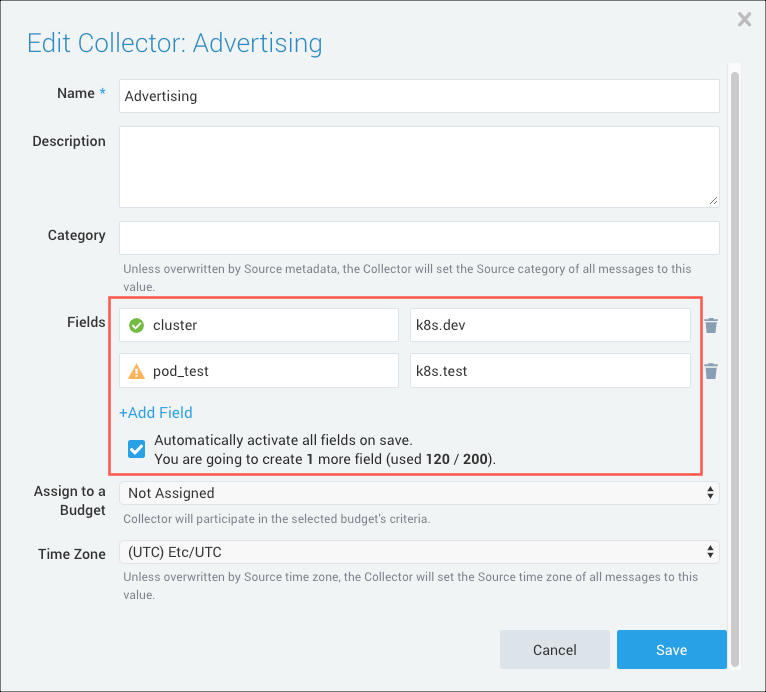
The following task shows you how to create a custom field for a collector. In this process, you assign a custom key-value pair in the field to tag the metadata. In our example, we are create two fields with a key-value pairs, one for a cluster and one for a pod.
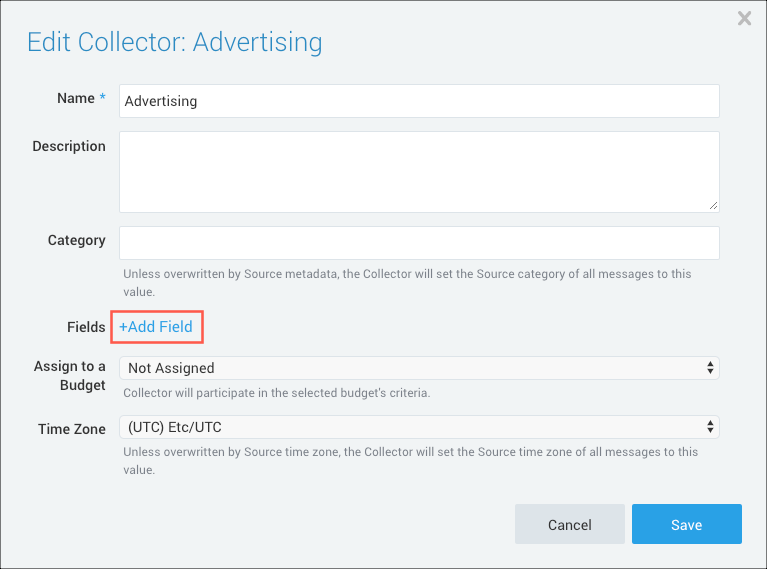
To add a custom field to a collector, do the following:
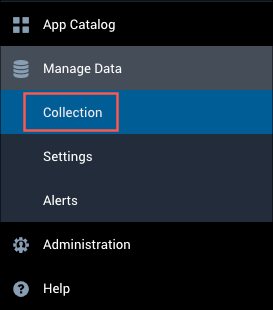
From the main Sumo Logic page, select Manage Data > Collection in the left menu bar.
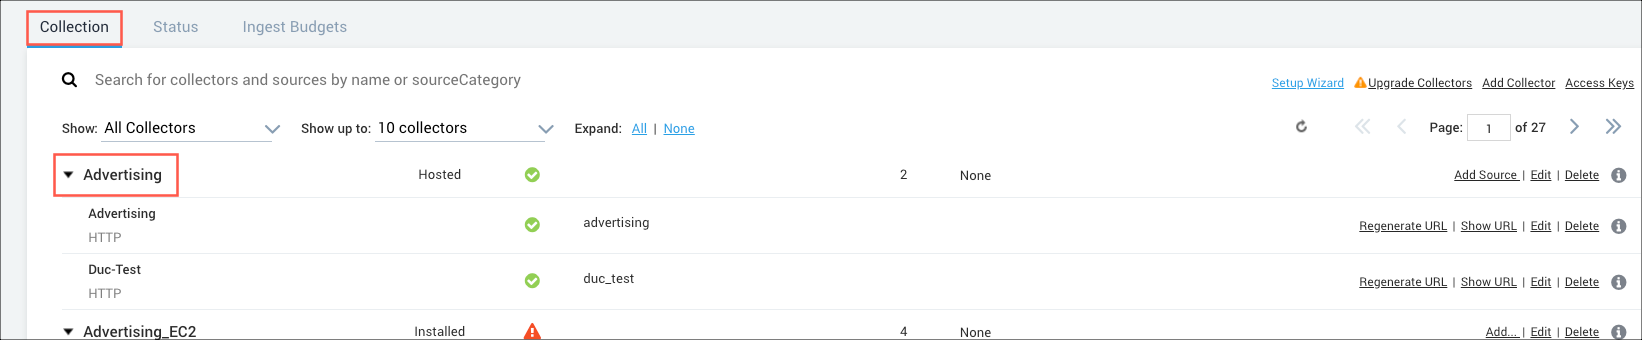
Click Collection at the top left of the window to view a list of available data collectors.
Select the collector to which you want to add a custom key-value pair. In our example, we selected the Falco collector.
The Edit Collector dialog appears.
Click Add Field.
Enter a Field Name and Value in the respective text fields. In our example we created a field for a cluster with the label k8s.dev and a pod with the name pod_test and label k8s.test. This will allow us to easily search for log data for that cluster or pod.
 A green circle with a check mark appears when the field exists and is enabled in the Fields table schema.
 An orange triangle with an exclamation point appears when the field doesn't exist yet, or is disabled, in the Fields table schema. In this case, an option to automatically add or enable the nonexistent fields to the Fields table schema is provided. If a field is sent to Sumo that does not exist in the Fields schema or is disabled it is ignored, known as dropped.
Click Save.
Now, any logs sent to this Collector will have these key-value pairs associated with it. With this association, you can search for cluster=k8s.dev or pod_test=k8s.test to return your logs.
Leveraging metadata for quicker results
In this section you learn how to use metadata to search by components of the Kubernetes environment, such as containers, pods, and namespaces, for localized investigation and analysis. You will also use metadata set with key-value pairs to effectively find the log data, and display Kubernetes labels and view the respective data in your query results.
To use metadata to view Kubernetes components and display Kubernetes label results, do the following:
On the Home page, click +New to open a query.
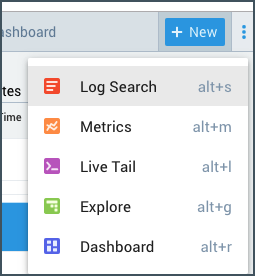
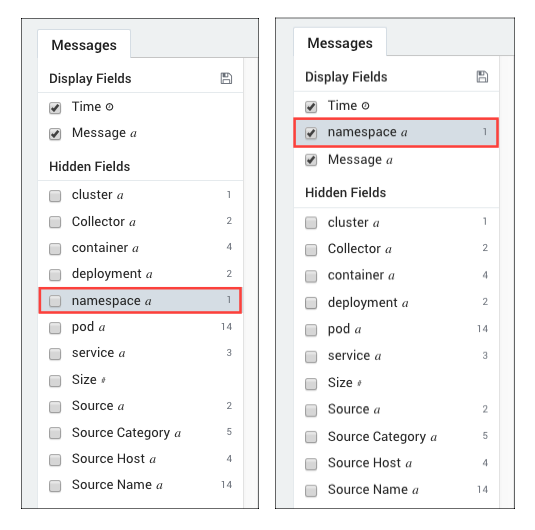
Select Log Search, and then indicate the metadata namespace. In our example, we entered namespace=sumologic..
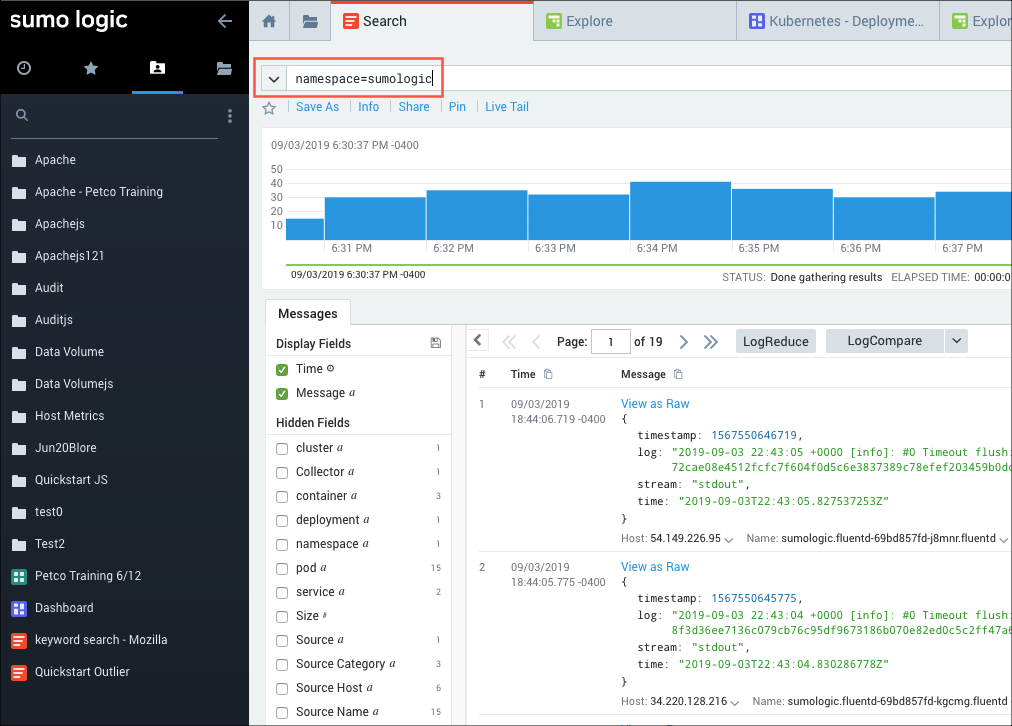
Click Start to run the query, then under Hidden Fields on the Messages tab, click namespace to display the metadata for that Kubernetes component. Notice that the namespace field moves Hidden Fields to Display Fields.
To view metadata for a key-value pair, enter the key-value pair in the query text field. In our example, we wanted to view the metadata for the prometheus container and entered container=prometheus.
Then we expanded the search range by changing the time interval from the last 15 minutes to the Last 60 minutes.
To further investigate the container, we clicked Logreduce, to group common log messages into signature groupings.
To examine the details of the smaller set of signatures that appear, under Select Count we selected. Oftentimes when troubleshooting a problem, our lesser quantity contains the root cause.
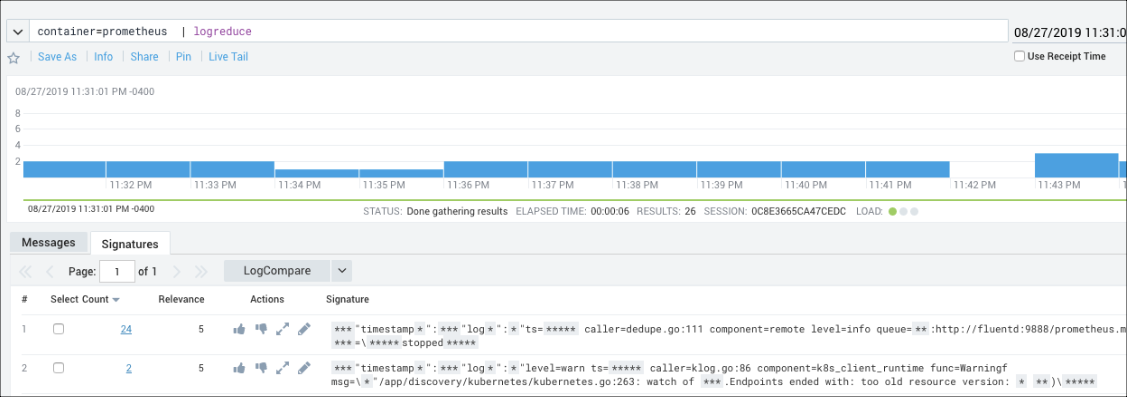
There is a warning indicating Endpoints ended with: too old resource version, that may be something to investigate, or just the indication of an ongoing upgrade
To check data for other Kubernetes components, we can enable them one by one by selecting the box to the left** of each: namespace, cluster, container, pod, service and Source Host.
If this was an ongoing upgrade, the Source Host ip address would help pinpoint the servers that may still need upgrading.