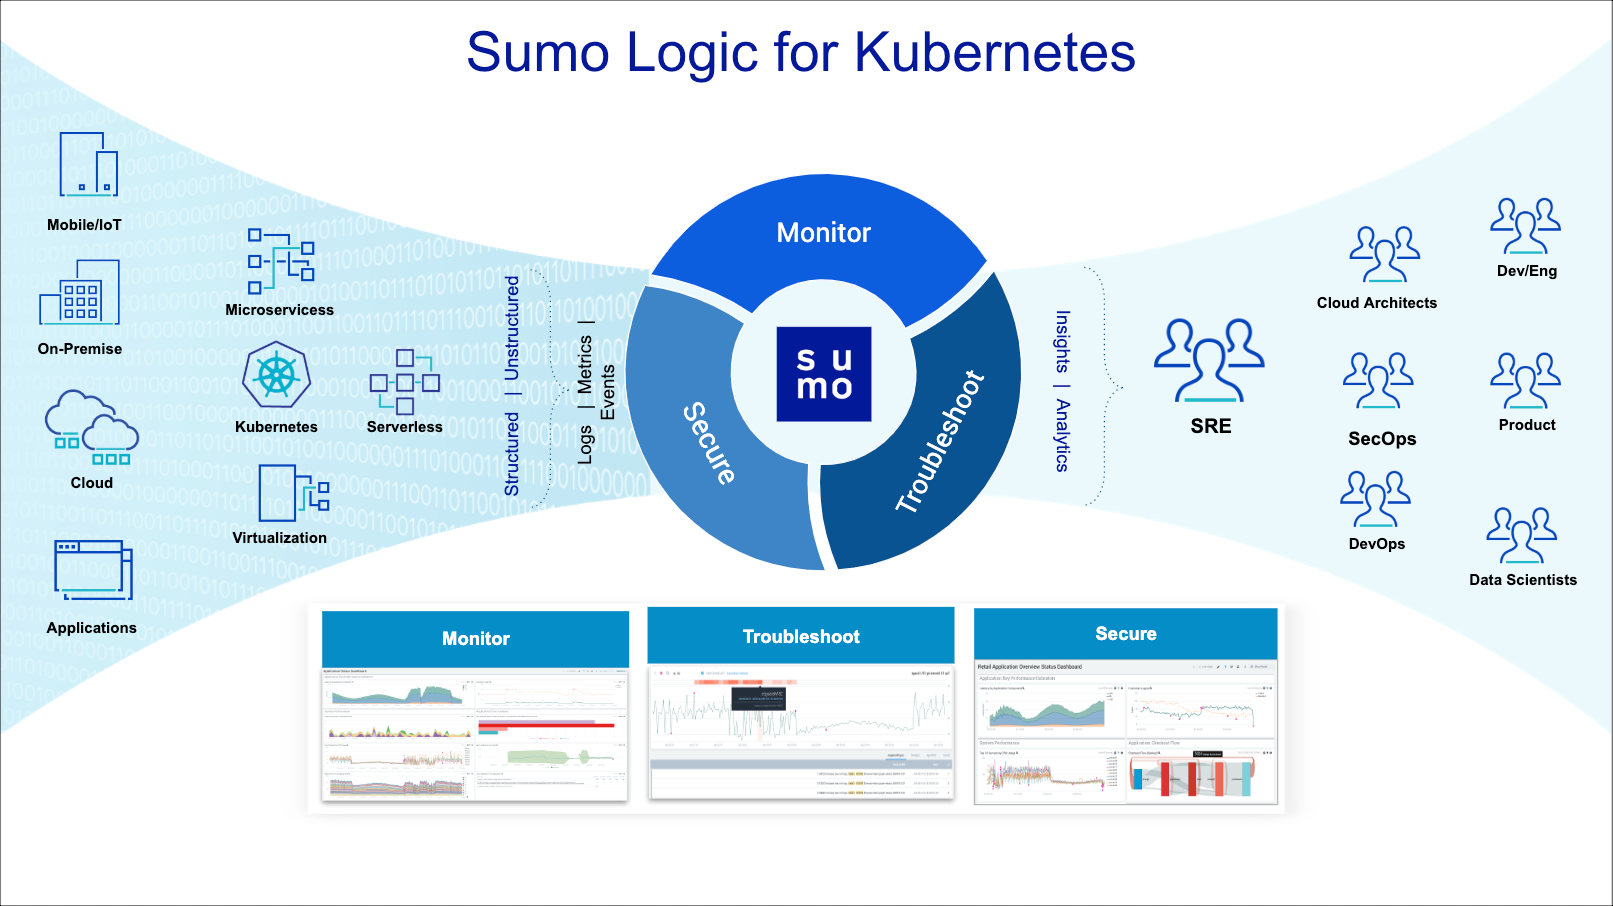
About the Sumo Logic Kubernetes Solution
The Sumo Logic Kubernetes Solution provides an end-to-end experience that takes you from configuring collection and installing apps, to monitoring, managing, and troubleshooting your Kubernetes environment.
What is Kubernetes?
Kubernetes is an open source container orchestration platform developed by Google, that is now managed by the Cloud Native Computing Foundation.
Kubernetes provides for automatic deployment, scaling, and operations across clusters in your environment. Kubernetes provides Desired State Management for clusters by defining a system of cluster services that operates on a set of specified criteria. Kubernetes is ephemeral by design, with elastic scalability and control over how containers and pods are deployed. Kubernetes can run in a public cloud, on a private network, or on bare metal.
Critical areas to monitor
The critical areas for monitoring in Kubernetes include the control plane, individual nodes, and pods. The following illustration provides a high-level view of the Kubernetes cluster architecture.
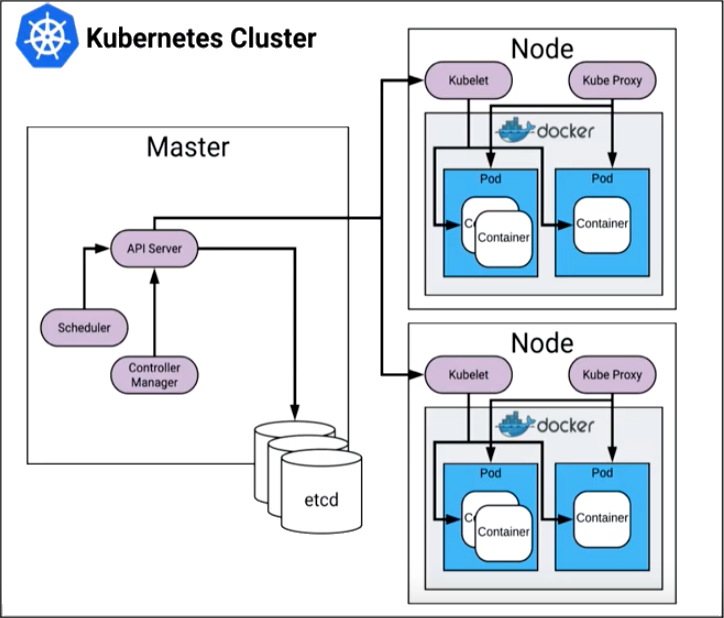
Control Plane
The Kubernetes control plane manages how Kubernetes communicates with your cluster. The various parts of the control plane work together in managing the health and performance of a cluster. The control plane consists of the API server, etcd, controller manager, and scheduler. Each part of the control plane has specific areas that should be monitored for the optimum health and performance of your cluster.
API Server - kube-apiserver
The API server is the front door to Kubernetes. Any changes you make in the environment are communicated through the API server. The API server uses all your resources to commit the changes inside the cluster. For the kube-apiserver, you should monitor the following:
- API server latency
- Requests per minute (RPM)
- Threshold issues with etcd
ectd
The ectd of the control plane is a value store that Kubernetes uses this for storing all of the desired states for the cluster. Changes in the cluster are compared to the desired state to determine the necessary response. For ectd, you should monitor the following:
- Leader changes
- Quorum - if quorum is lost, etcd falls into a read-only state and you can't make changes to the API or get new state coming back from your cluster
- Disk space - if you lose your backup for etcd you may lose all the state for the entire cluster
Controller Manager
The controller manager is responsible for continually coalescing the running state of the cluster versus the desired state. The controller manager monitors all changes made to the API server to see if the changes are in alignment with the desired state of the cluster, and is in constant contact with the cloud provider. The controller manager checks to see if all nodes are running and that there are enough pods; continually iterating to make sure the cluster maintains the desired state. For the controller manager, you should monitor:
- End-to-end scheduling latency
- Cloud provider latency
- Failed requests to your cloud provider
Scheduler - kube-scheduler
The scheduler is responsible for scheduling the individual pods on the nodes. In order to schedule a pod, the scheduler compares the available resources with resource requests, as well as the availability of individual nodes and new nodes that are coming online due to scaling. For the scheduler, you should monitor:
- Pods that fail to schedule
- Requests, quota limits, anti-affinity
- Bin packing - the number of pods that can fit on an individual node
Nodes
A node is a worker machine in a Kubernetes cluster that serves as a delivery vehicle for your applications. Nodes can be virtual machines (VMs) or physical machines. Nodes are essentially bare-bones servers. Like any other server, you should monitor the following on each node:
- CPU
- Memory consumption
- System load
- File system activity
- Network activity
Each node is managed by the cluster and contains the services necessary to run pods. Node services include kubelet and kube-proxy.
Kubelet
The kubelet daemon runs on each individual node and monitors the health of the containers on the node, interacting with the container manager. The container manager can be Docker, rkt (pronounced Rocket), or any other Open Source container manager that is supported by Kubernetes.
For the kubelet, you should monitor the container manager which is itself a monitoring service.
Kube Proxy - kube-proxy
The kube-proxy is a network proxy that runs on each node in your cluster. The kube-proxy maintains network rules on nodes that facilitate network communication to the pods from network sessions inside or outside of the cluster. For the kube proxy, you should monitor:
- Network traffic load
- Cluster DNS
- Service cluster IPs and ports
Pods
Pods reside on a given node, and a container can contain several pods. For pods, you should monitor:
- Scheduler health for individual pods - so they don't get stuck in a restart loop
- Pod health - availability, resource consumption, and performance
Sumo Logic Kubernetes Solution
The Sumo Logic Kubernetes Solution provides observability into all the critical areas of your Kubernetes environment mentioned above. The solution provides an easy way to setup collection to collect, logs, metrics and traces from your Kubernetes environment. It also helps you install the relevant OOB dashboards, alerts and other content to monitor, manage, and troubleshoot your Kubernetes environment quickly and effectively.
Our solution provides visibility across the full K8s application stack. It allows you to monitor and track the health of:
- Nodes (Physical or Virtual) that are running the Kubernetes Cluster
- Kubernetes Control Plane, including the API server, etcd, controller manager, and scheduler that manage the provisioning of containerized applications on the cluster
- Pods and the associated containers that are running within the Kubernetes Cluster
- Application services and components that are running inside of the Kubernetes cluster
With Sumo Logic Kubernetes, you can monitor and troubleshoot container health, replication, load balancing, pod state, and hardware resource allocation. Falco events are utilized to monitor and detect abnormal container, application, host, and network activity.
Sumo Logic Kubernetes allows you to:
- Collect and centralize logs, metrics, and events.
- Monitor your environment and track alerts using dashboard intuitive visual displays.
- Troubleshoot issues with advanced analytics to successfully reach a root cause.
- Optimize performance and ensure the security of your apps and environment as a whole.