AWS EC2 Metrics
Amazon Elastic Compute Cloud (Amazon EC2) is a web service that provides secure, resizable compute capacity in the cloud, enabling you with complete control of your computing resources. The Sumo Logic app for AWS EC2 Metrics collects local host metrics and displays them using predefined search queries and dashboards. App dashboards provide a visual analysis of local host metrics for CPU, disk, memory, network, and TCP.
Metrics Types
Host metrics are gathered by the open-source SIGAR library. The metrics that are collected are described in Host Metrics for Installed Collectors.
Time Intervals
The time interval determines how frequently the source is scanned for metrics data. Sumo Logic supports pre-specified time intervals (10 seconds, 15 seconds, 30 seconds, 1 minute, and 5 minutes).
You can also specify a time interval in JSON by using the interval parameter, as follows: "interval" : 60000.
The JSON parameter is in milliseconds. We recommend 60 seconds (60000 ms) or longer granularity. Specifying a shorter interval will increase the message volume and could cause your deployment to incur additional charges.
AWS Metadata
Collectors running on AWS EC2 instances can optionally collect AWS Metadata such as EC2 tags to make it easier to search for Host Metrics. Only one AWS Metadata Source for Metrics is required to collect EC2 tags from multiple hosts. For more information, see AWS Metadata Source for Metrics.
Sample Query
Average CPU Utilization:
metric=CPU_Sys _sourcecategory=Labs/AWS/Host/Metrics _sourceHost=* _collector=* _source = * account=* region=* instancetype=* namespace=hostmetrics instanceid=* | avg
AWS EC2 Metrics Dashboards
This page provides examples and descriptions for each of the AWS Observability EC2 Metrics pre-configured dashboards.
Amazon Elastic Compute Cloud (Amazon EC2) is a web service that provides secure, resizable compute capacity in the cloud, enabling you with complete control of your computing resources.
The Sumo Logic AWS Observability EC2 Metrics Dashboards collects local host metrics and displays them using dashboards to aid with troubleshooting issues and to optimize resource allocation and costs. App dashboards provide a visual analysis of local host metrics for CPU, disk, memory, network, and TCP traffic.
We highly recommend you view these dashboards in the Explore View of the AWS Observability solution.
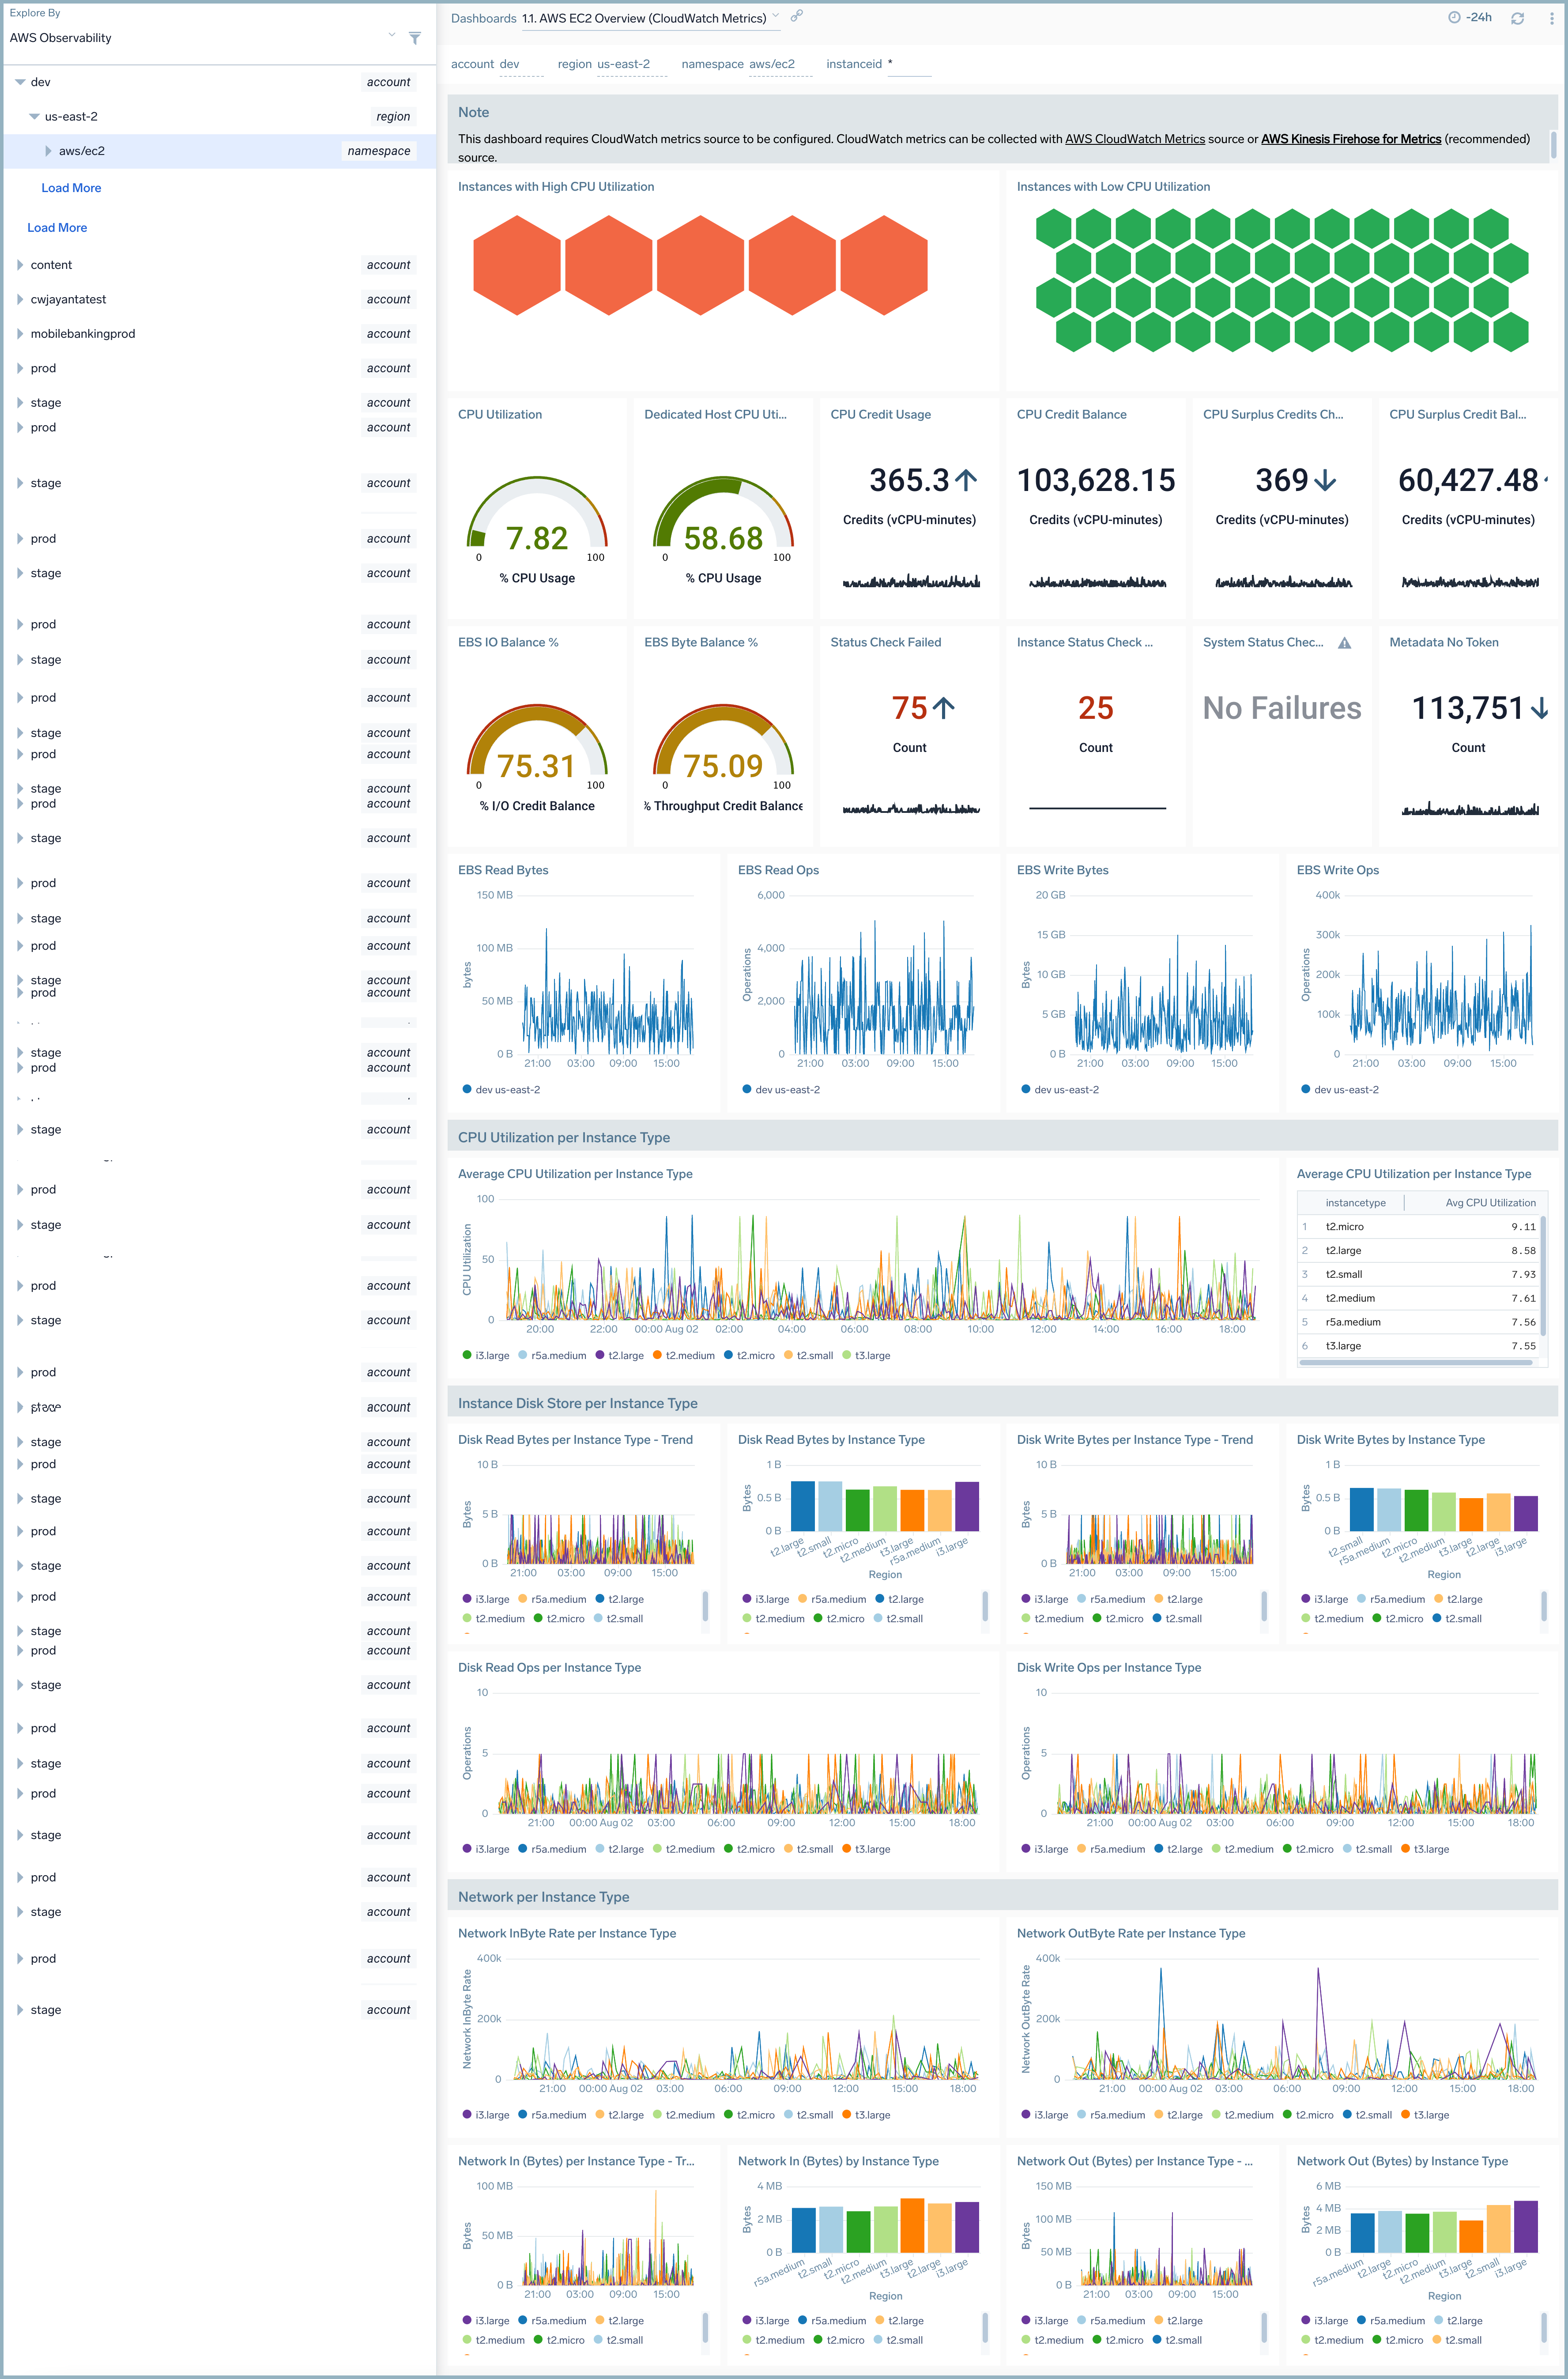
AWS EC2 Metrics - Overview
The AWS EC2 Metrics - Overview dashboard provides insights into EC2 performance throughout your infrastructure, including CPU utilization, network rates, disk, and memory usage.
Use this dashboard to:
- Quickly identify instances with high and low CPU and memory utilization.
- Monitor average statistics across various resource dimensions across all of your EC2 instances.
- Identify trends and deviations in resource usage across instance types, based upon which you can identify which instance types need to be resized.
- Monitor average CPU utilization by instance type.
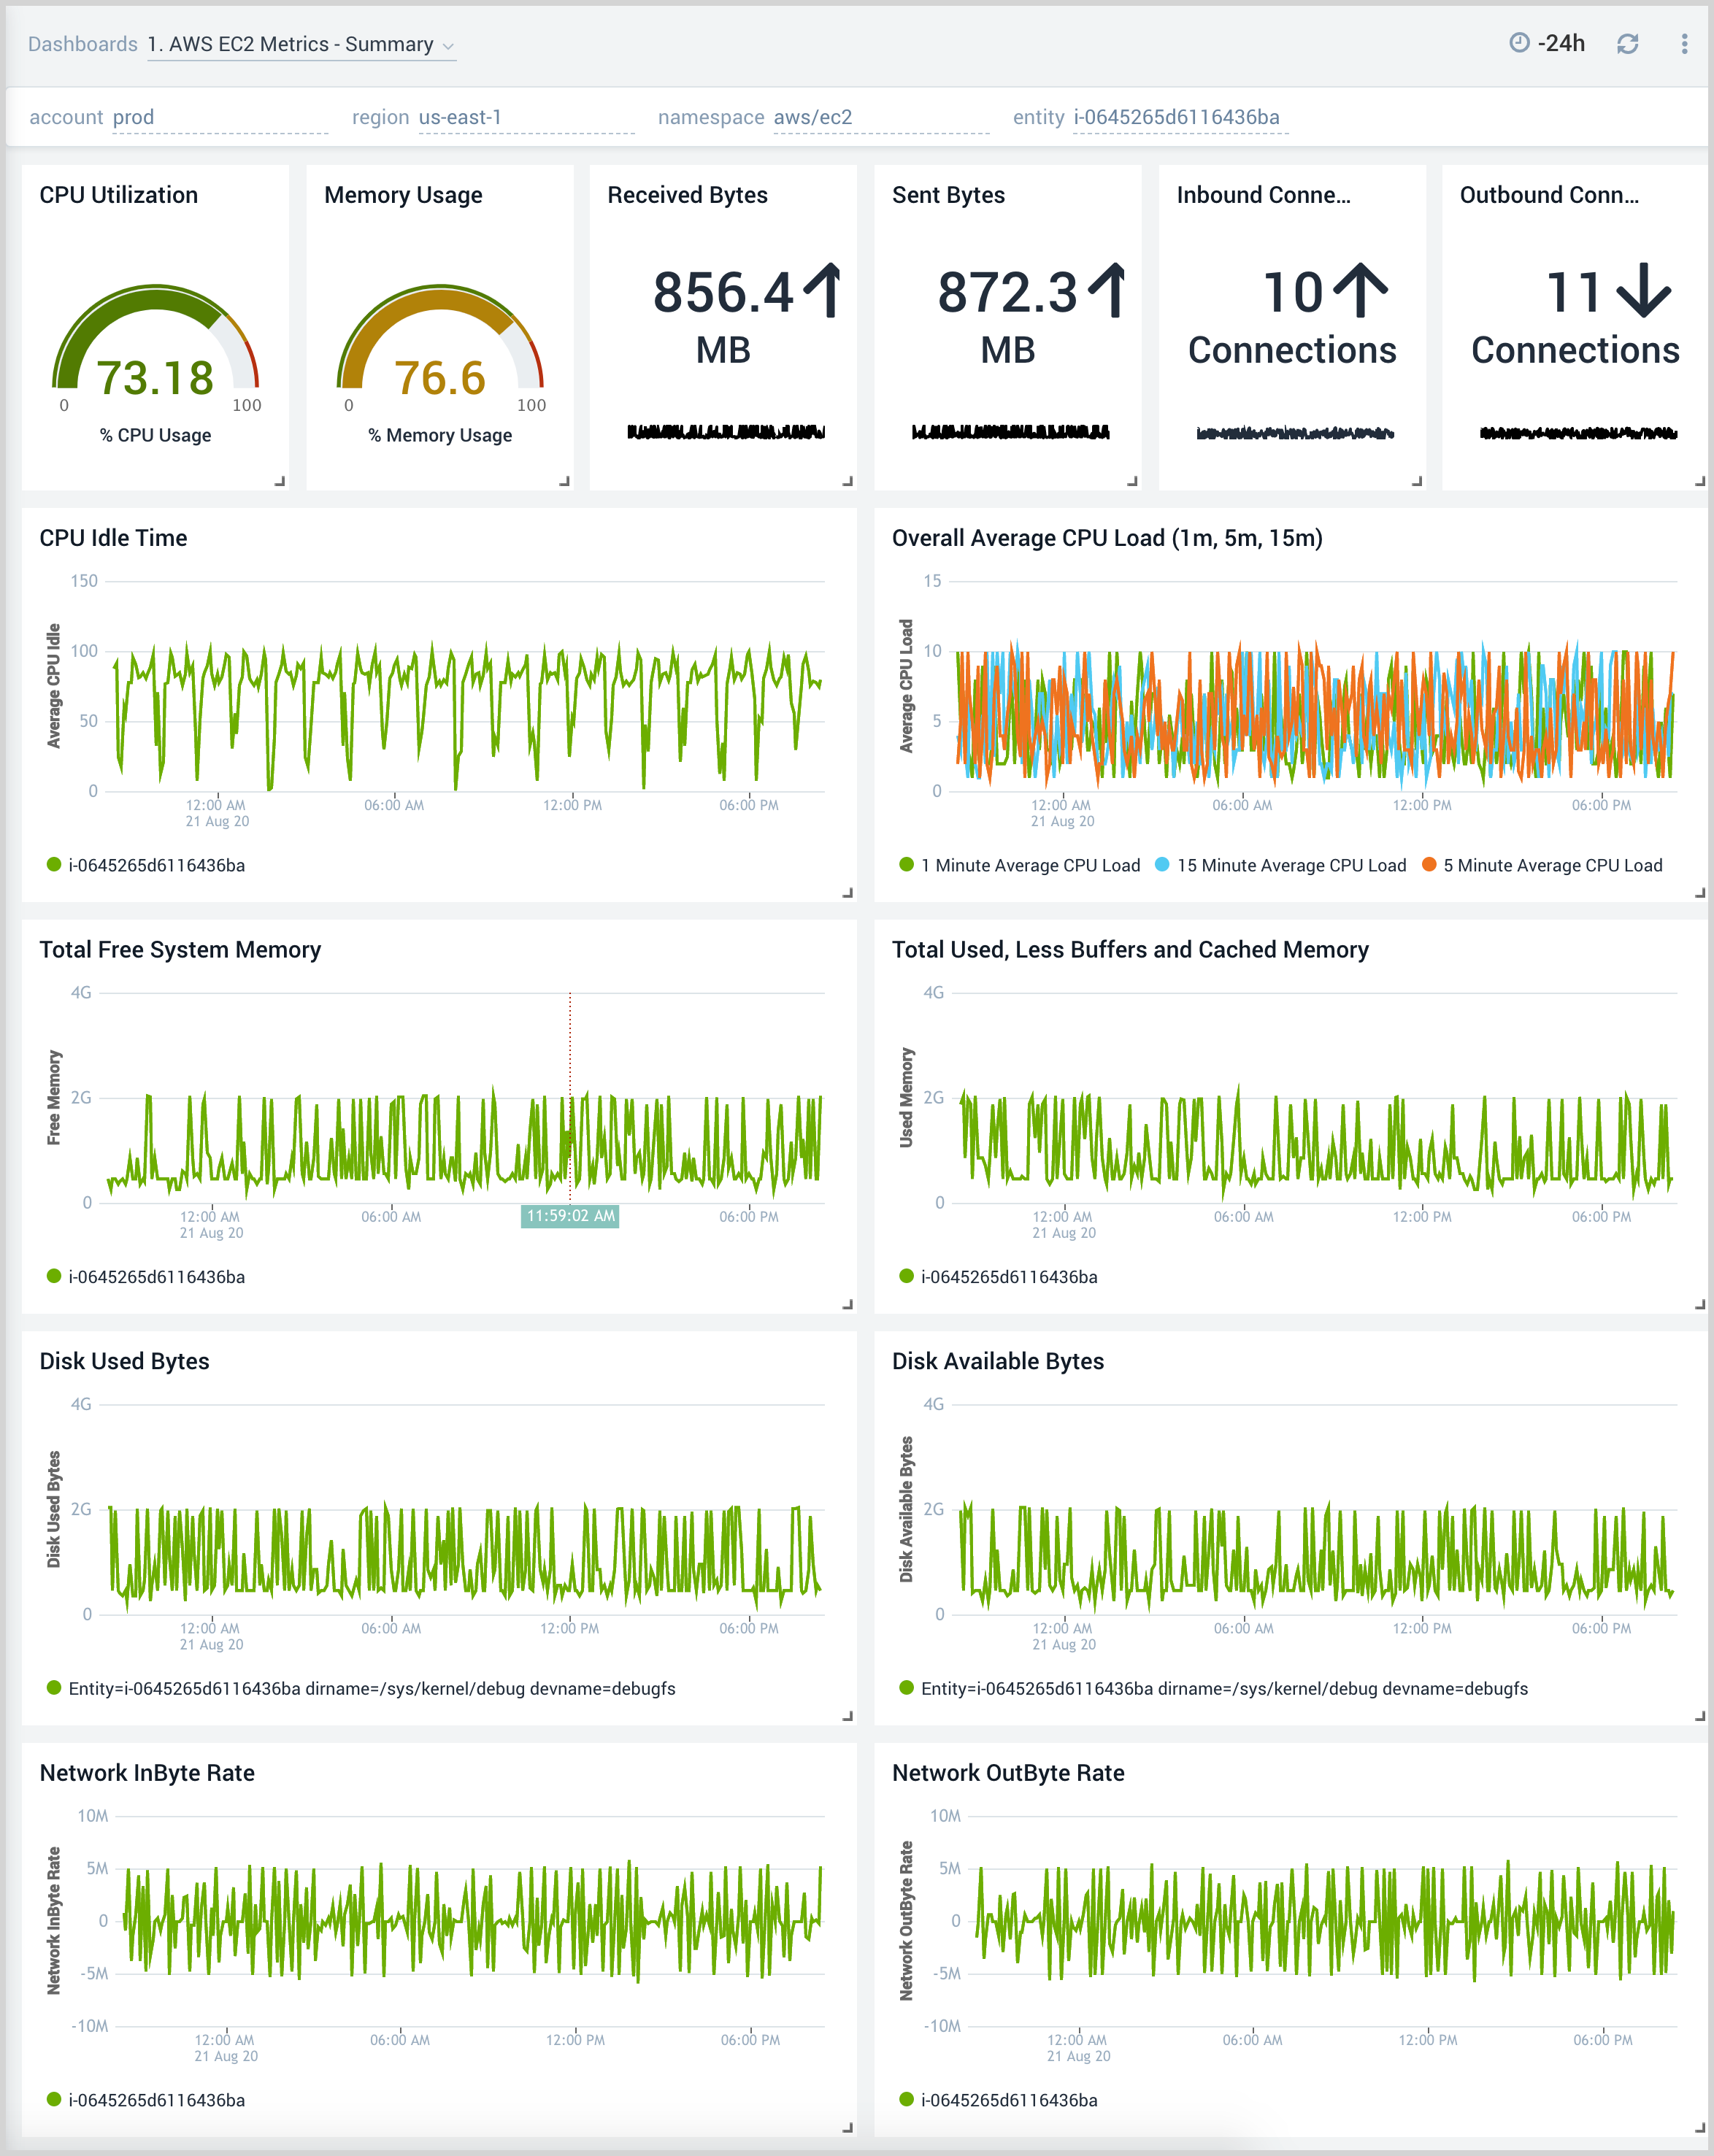
1. AWS EC2 Metrics - Summary
The AWS EC2 Metrics - Summary dashboard provides resource utilization insights for a specific EC2 instance.
Use this dashboard to:
- Monitor resource utilization statistics for a specific EC2 instance.
- Determine if an instance needs to be resized based on utilization.
- Identify potential infrastructure issues by identifying deviations in trends and monitoring.
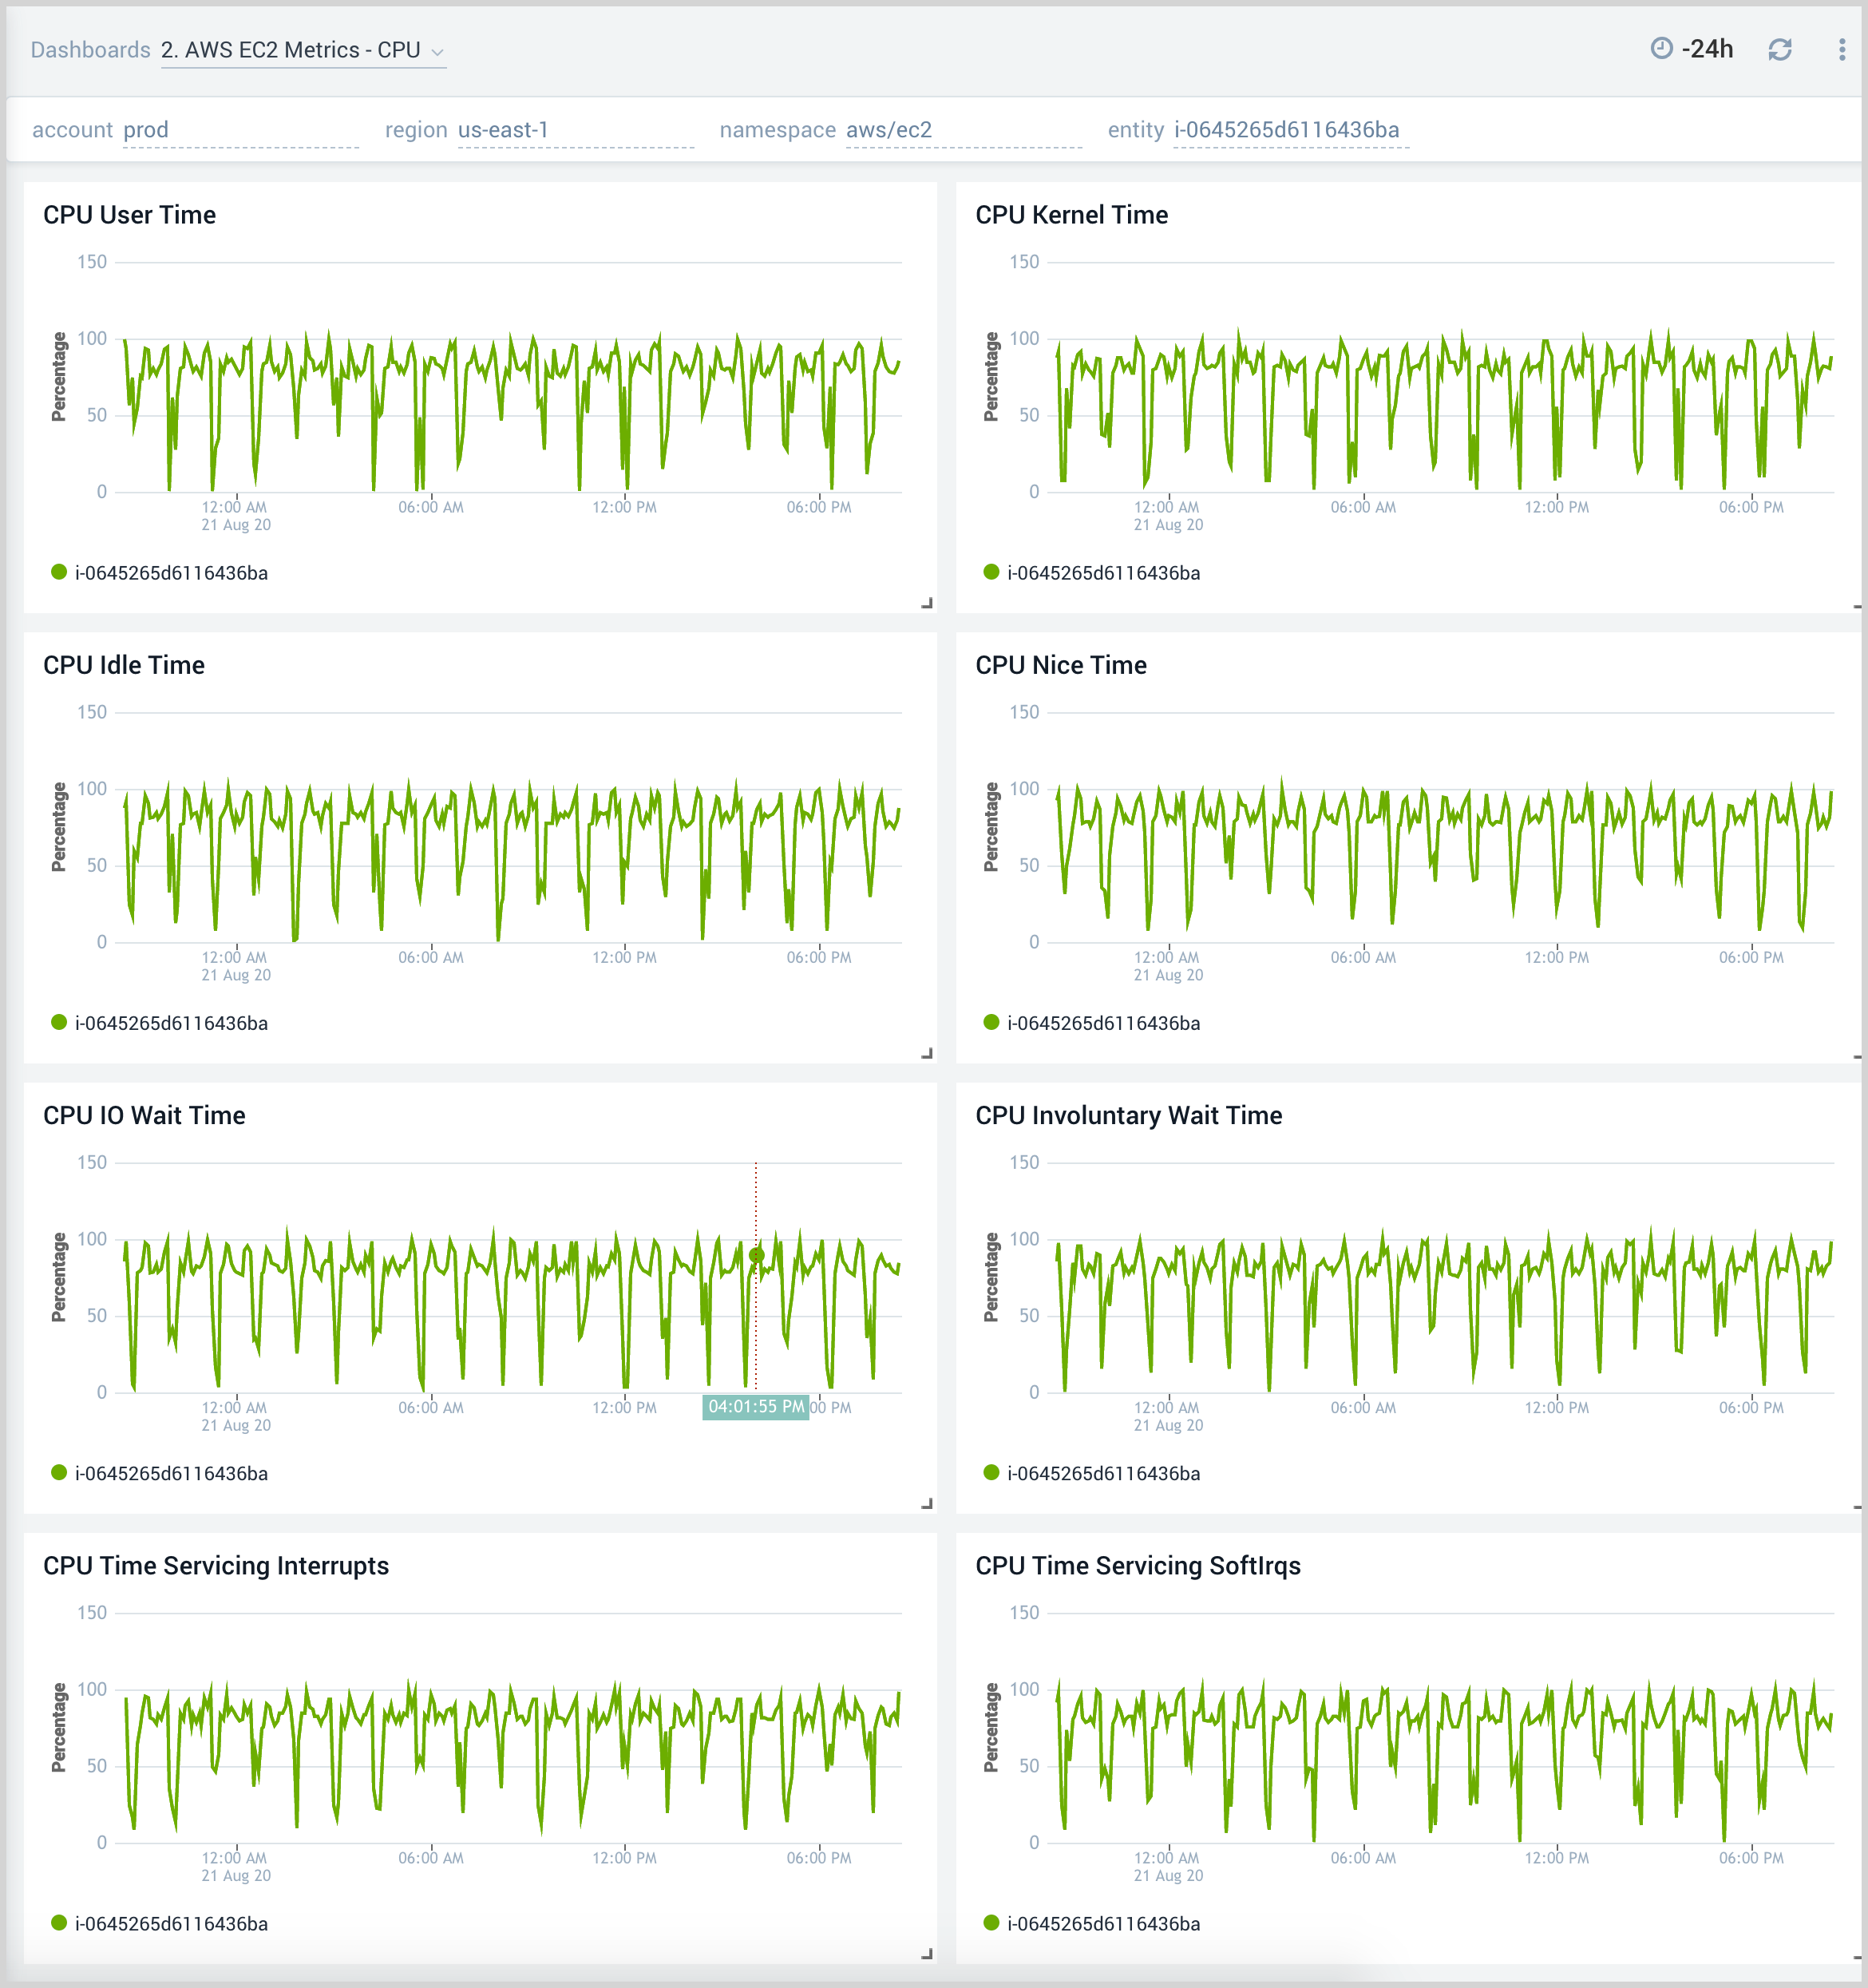
2. AWS EC2 Metrics - CPU
The AWS EC2 Metrics - CPU dashboard provides insights into EC2 CPU performance throughout your infrastructure, including average CPU load, system, user, idle, and wait times, as well as statistics per instance.
Use this dashboard to:
- Quickly identify if high CPU utilization for an EC2 instance is potentially causing a production issue.
- Determine how CPU cycles are being spent across CPU user time, system time, and IO wait time.
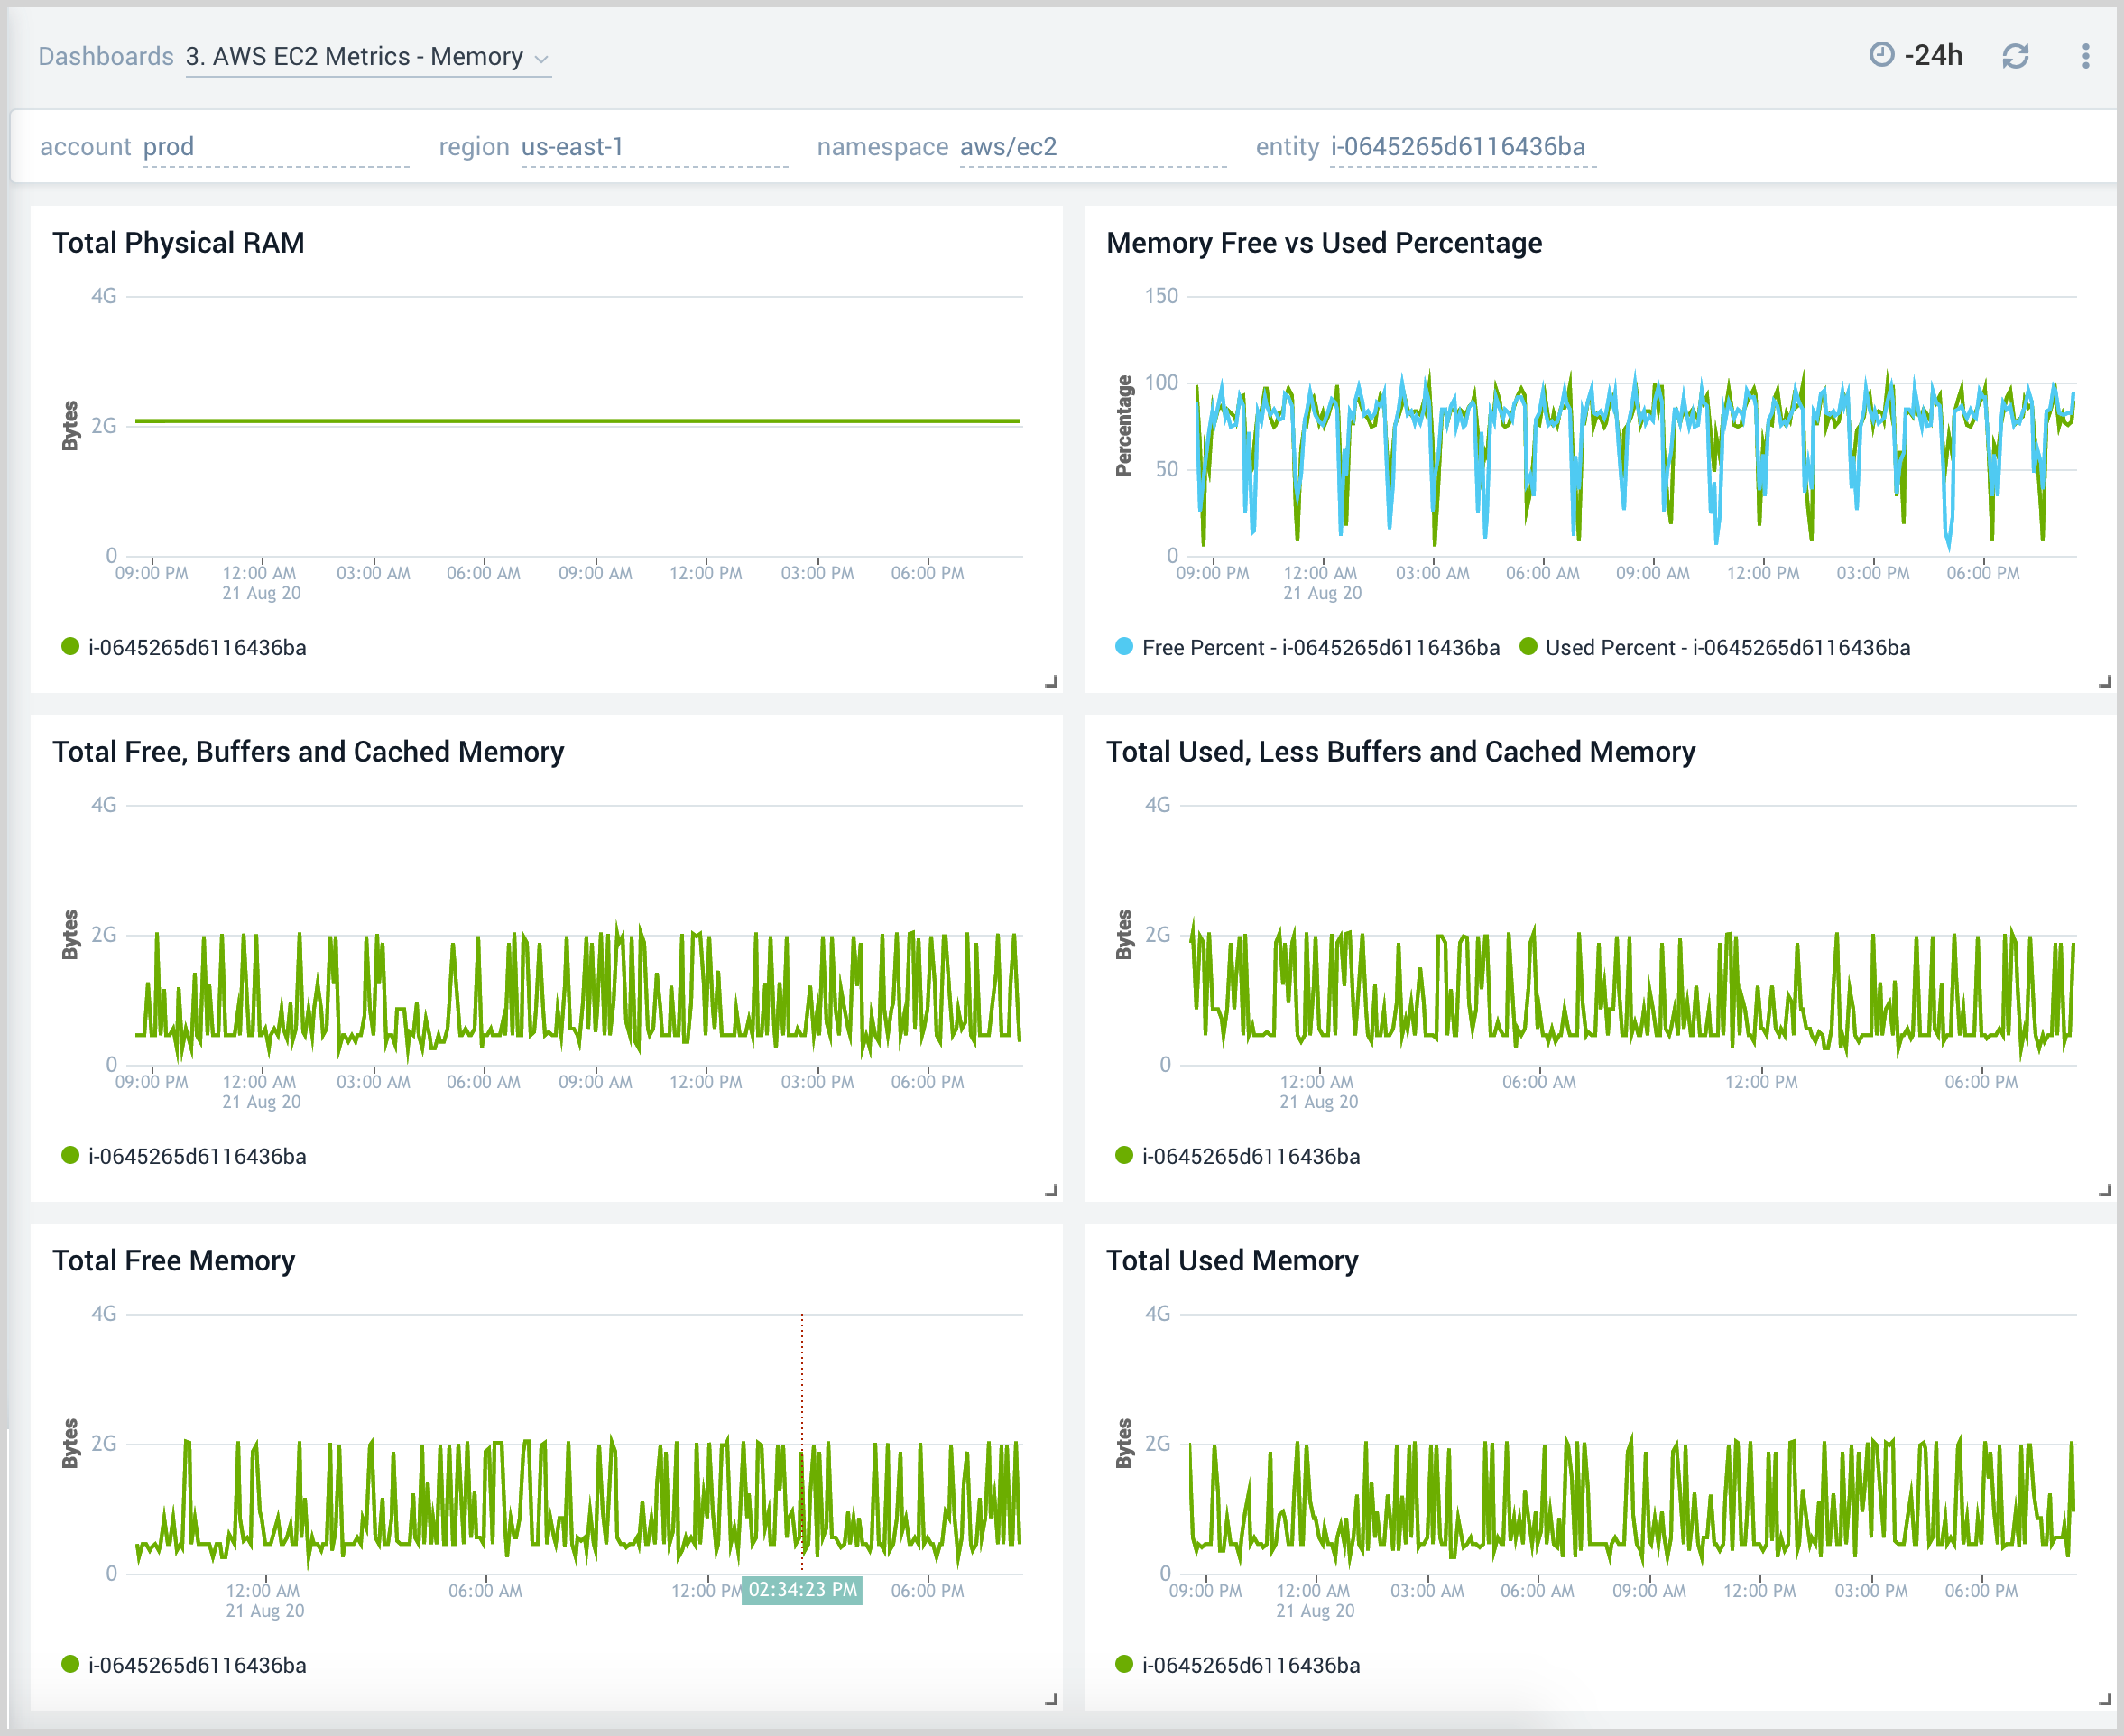
3. AWS EC2 Metrics - Memory
The AWS EC2 Metrics - Memory dashboard provides insights into EC2 memory usage per instance for total and percentage memory usage, free memory use, buffers, cache memory, and system memory.
Use this dashboard to:
- Quickly identify if high memory utilization for an EC2 instance is potentially causing a production issue
- Determine how memory is being used across buffers and cache memory.
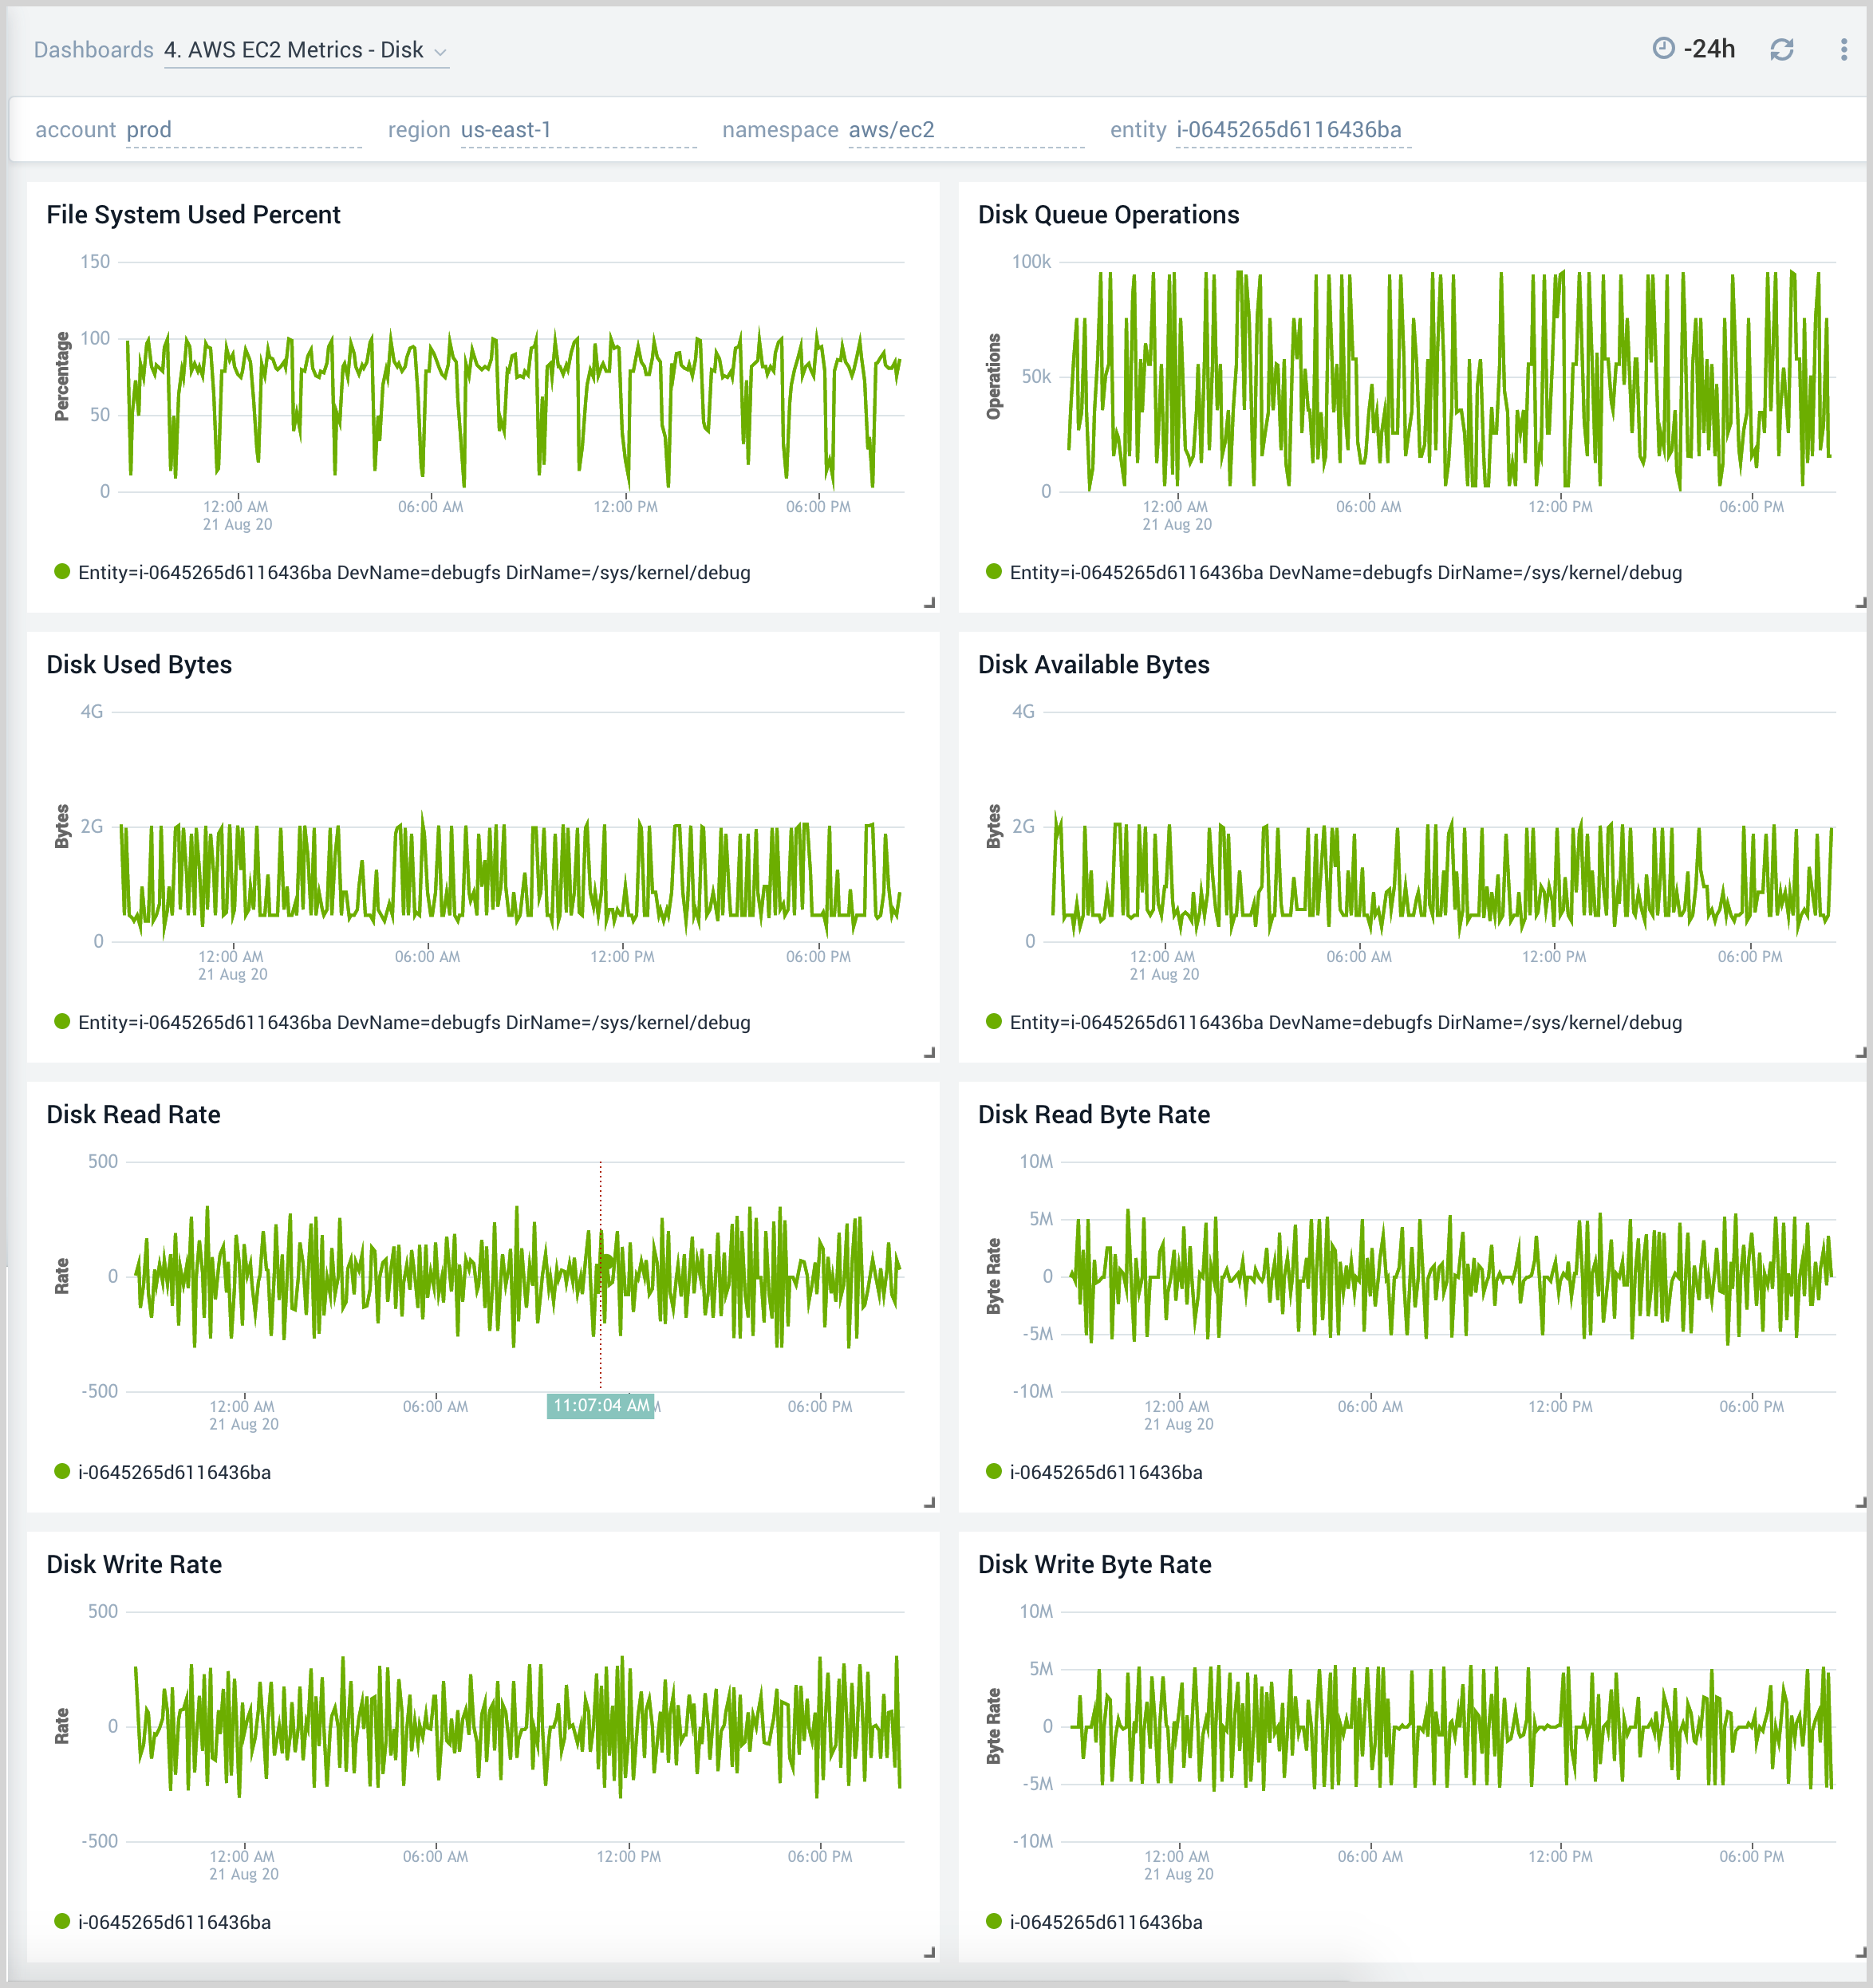
4. AWS EC2 Metrics - Disk
The AWS EC2 Metrics - Disk dashboard provides insights into EC2 disk usage per instance throughout your infrastructure, including directory, writes and usage, available bytes, used bytes, and byte read and write rates.
Use this dashboard to:
- Quickly identify if high disk utilization for an EC2 instance is potentially causing a production issue.
- Determine which directories have the most disk usage.
- Determine the performance of your storage by monitoring disk read/write rates.
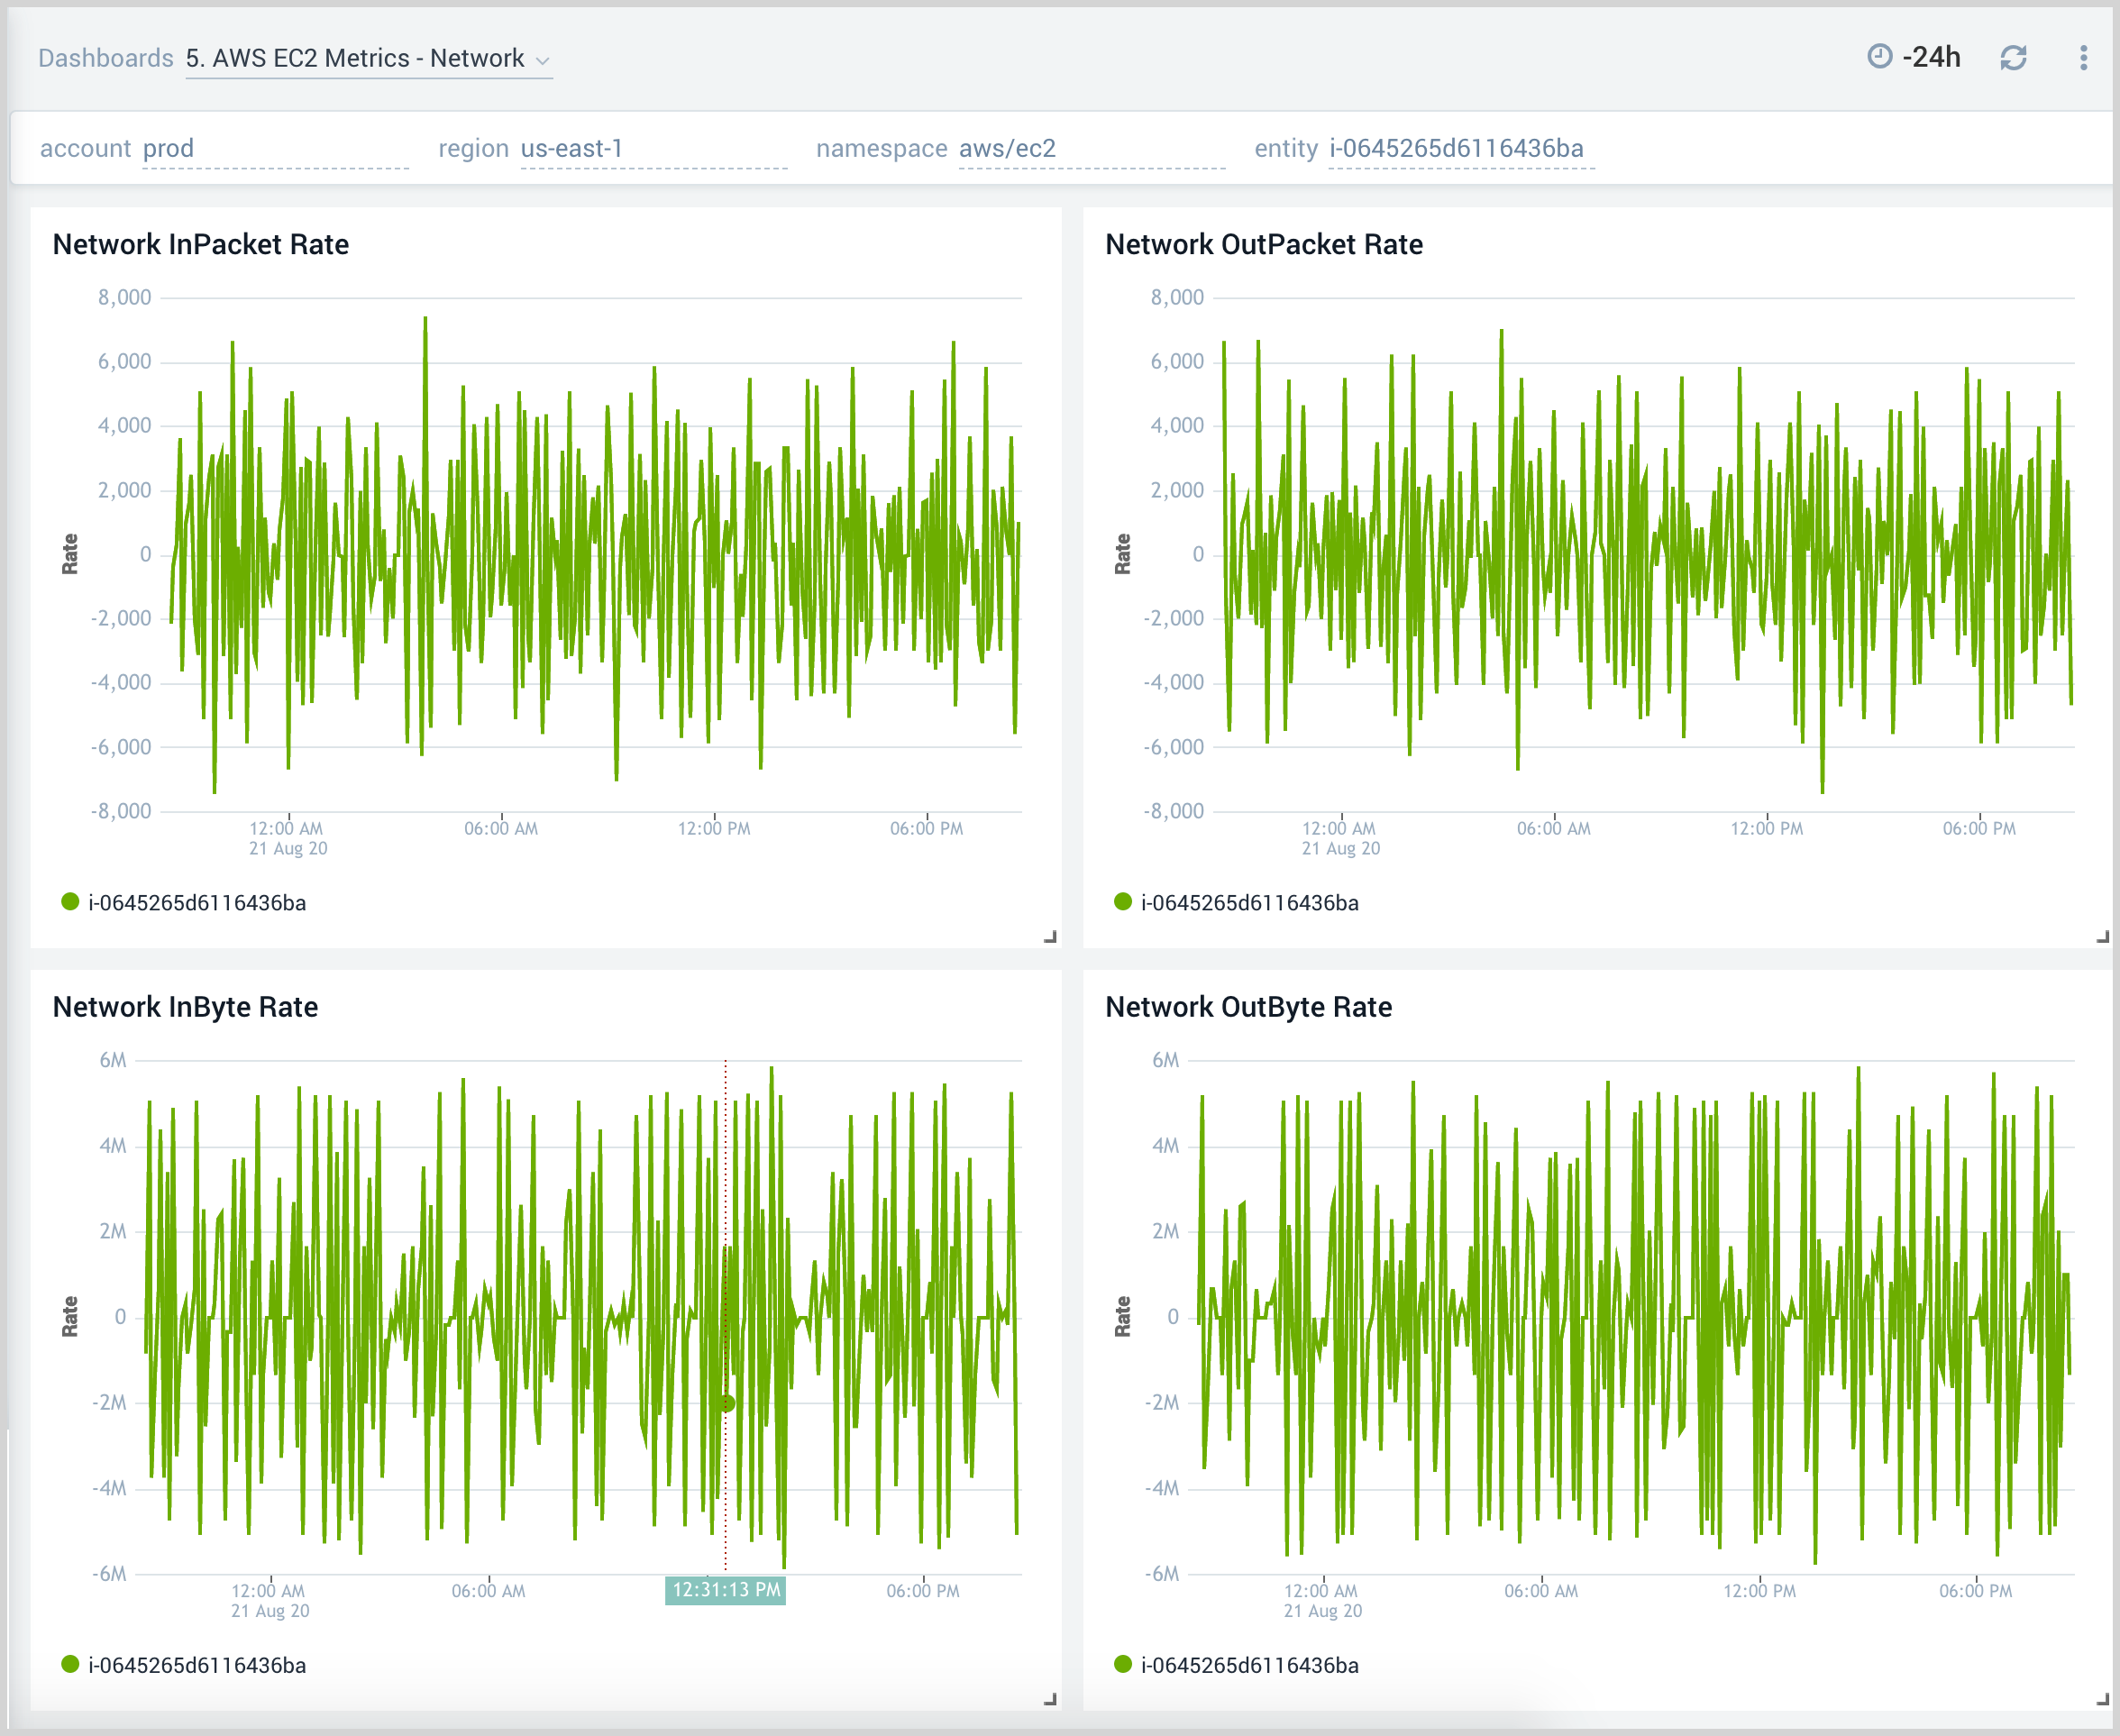
5. AWS EC2 Metrics - Network
The AWS EC2 Metrics - Network dashboard provides insights into EC2 network performance per instance across your infrastructure, including metrics for the average number of packets in and out, packet rate in and out, and byte rate in and out.
Use this dashboard to:
- Quickly identify if traffic sent and received rates for an EC2 instance is potentially causing a production issue.
- Determine if any improvements need to be made to your AWS networking infrastructure for optimal performance.
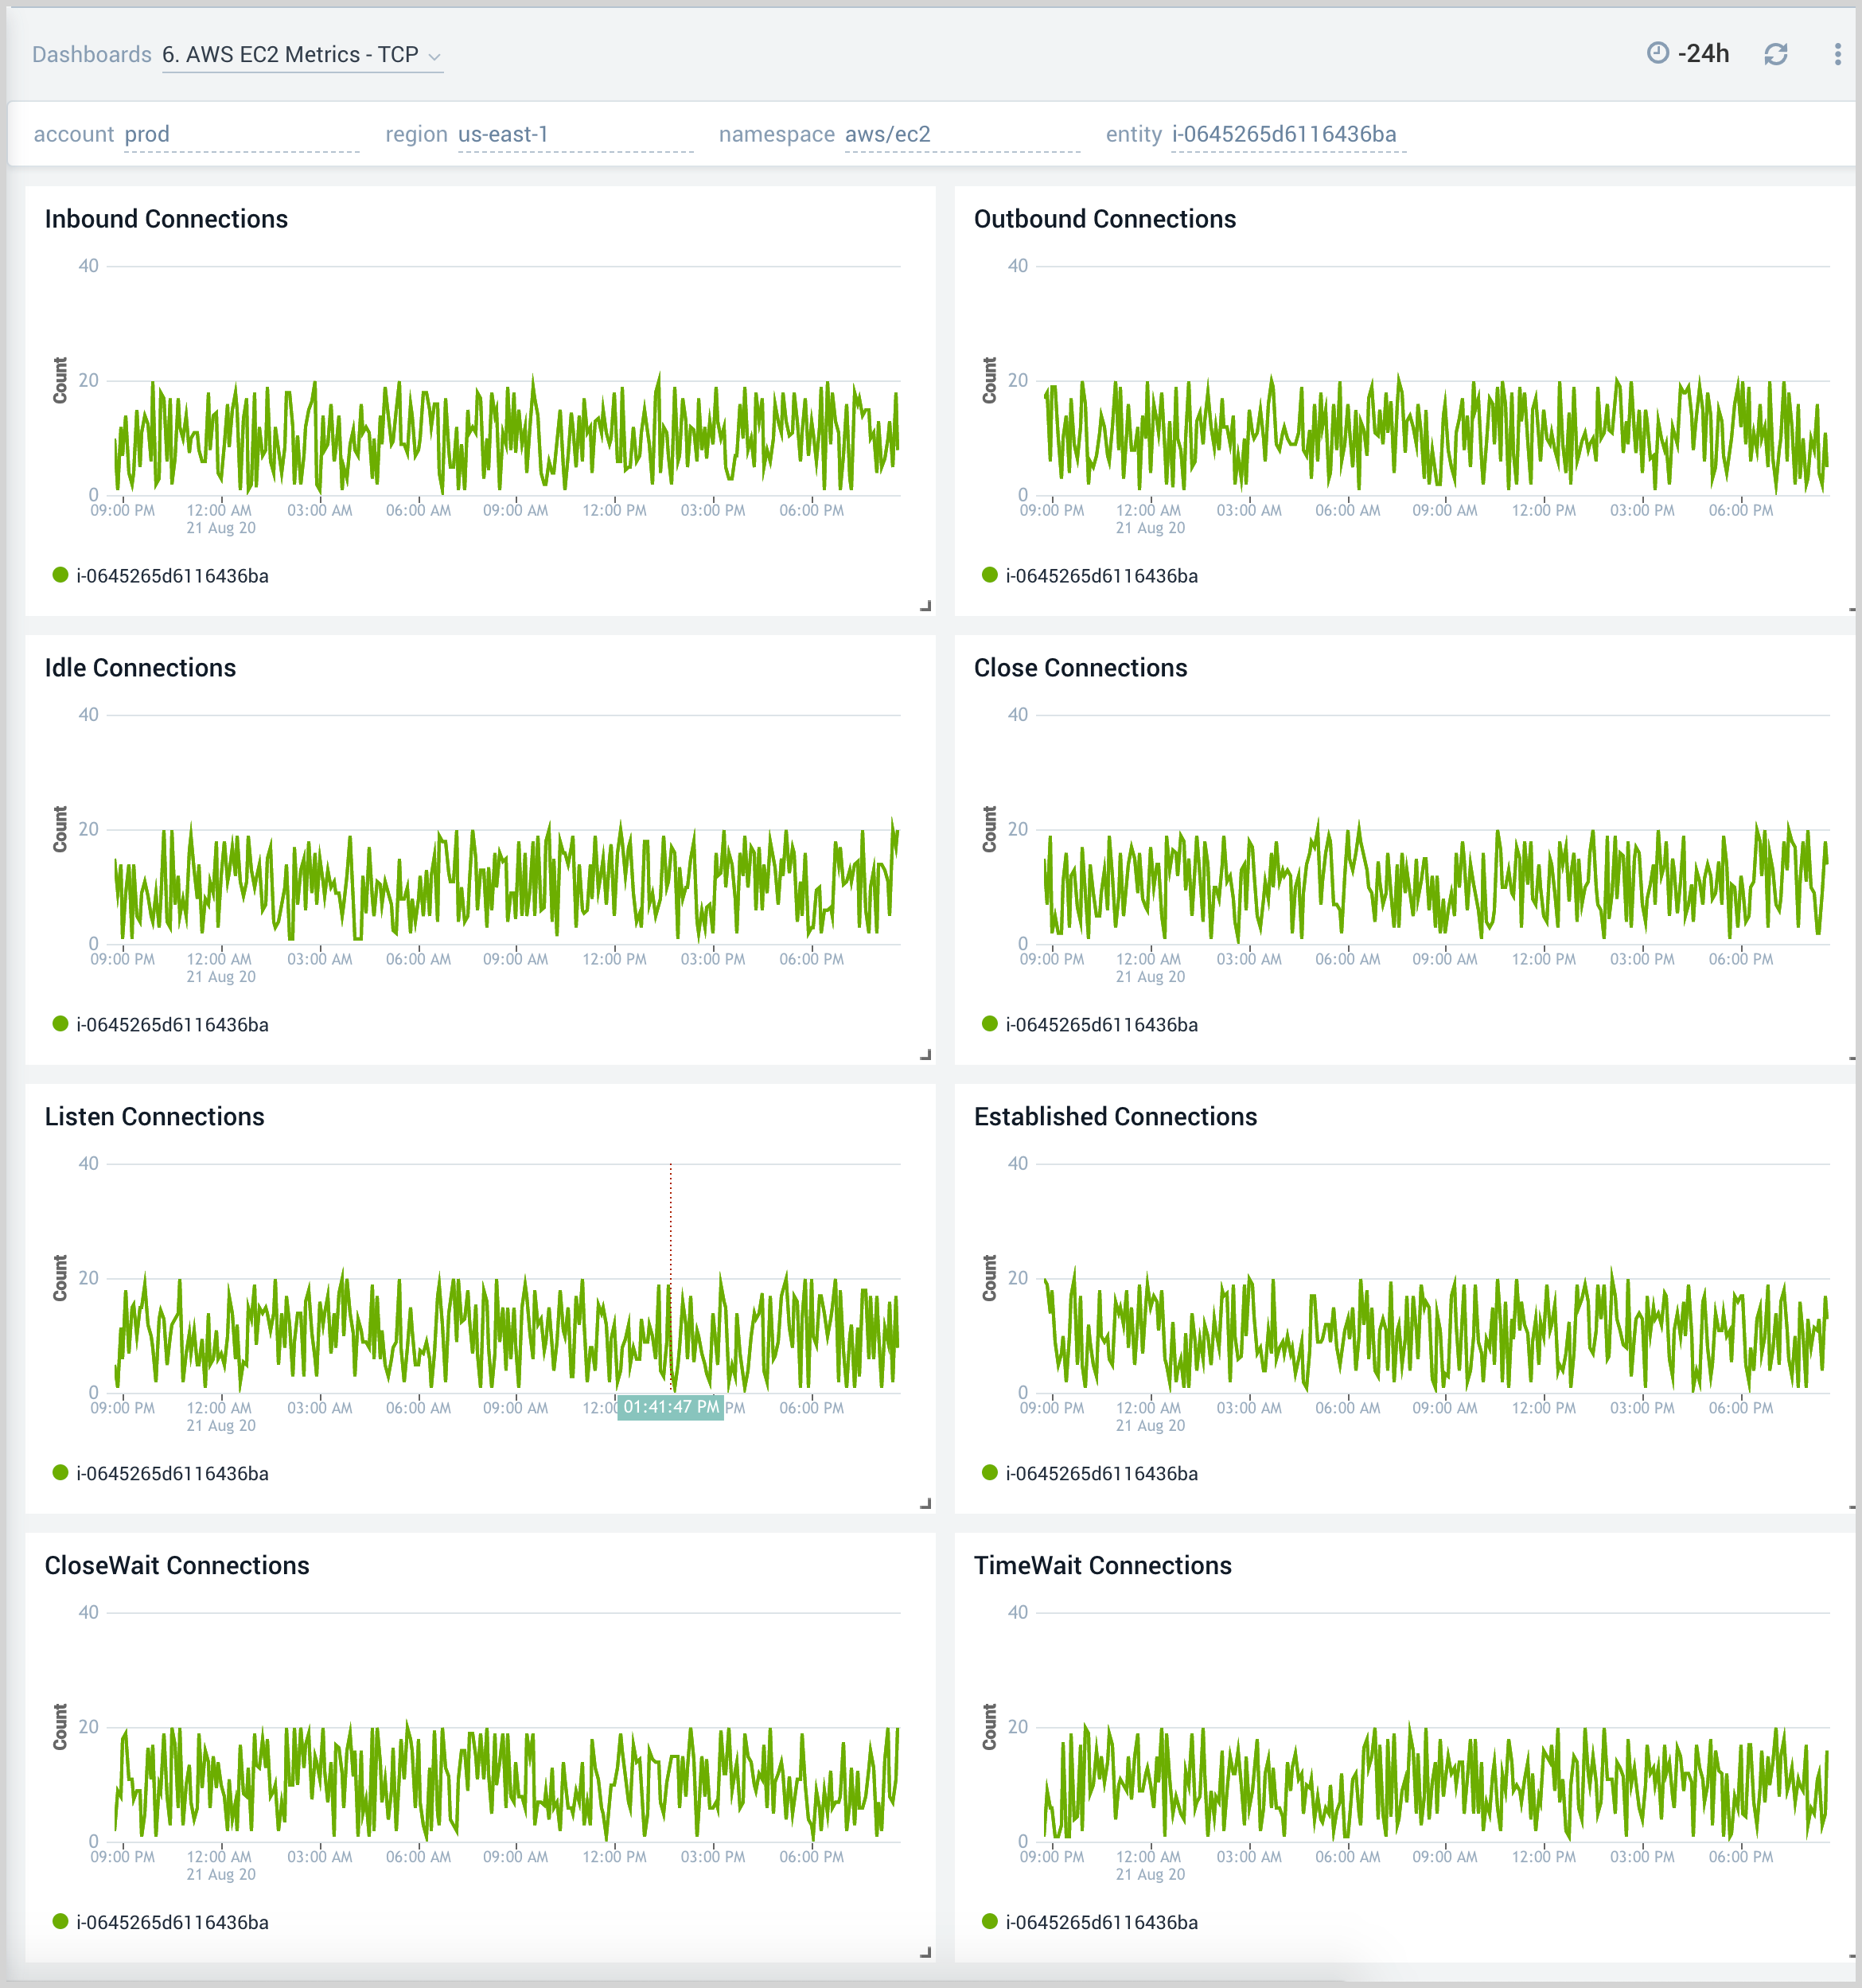
6. AWS EC2 Metrics - TCP
The AWS EC2 Metrics - TCP dashboard provides insights into TCP traffic performance per EC2 instance throughout your infrastructure, including metrics for inbound and outbound connections, listen and established connections, and close wait and time wait connections.
Use this dashboard to:
- Quickly identify if TCP traffic for an EC2 instance is potentially causing a production issue.
- Identify if any improvements need to be made to optimize TCP traffic by analyzing various TCP connection states.
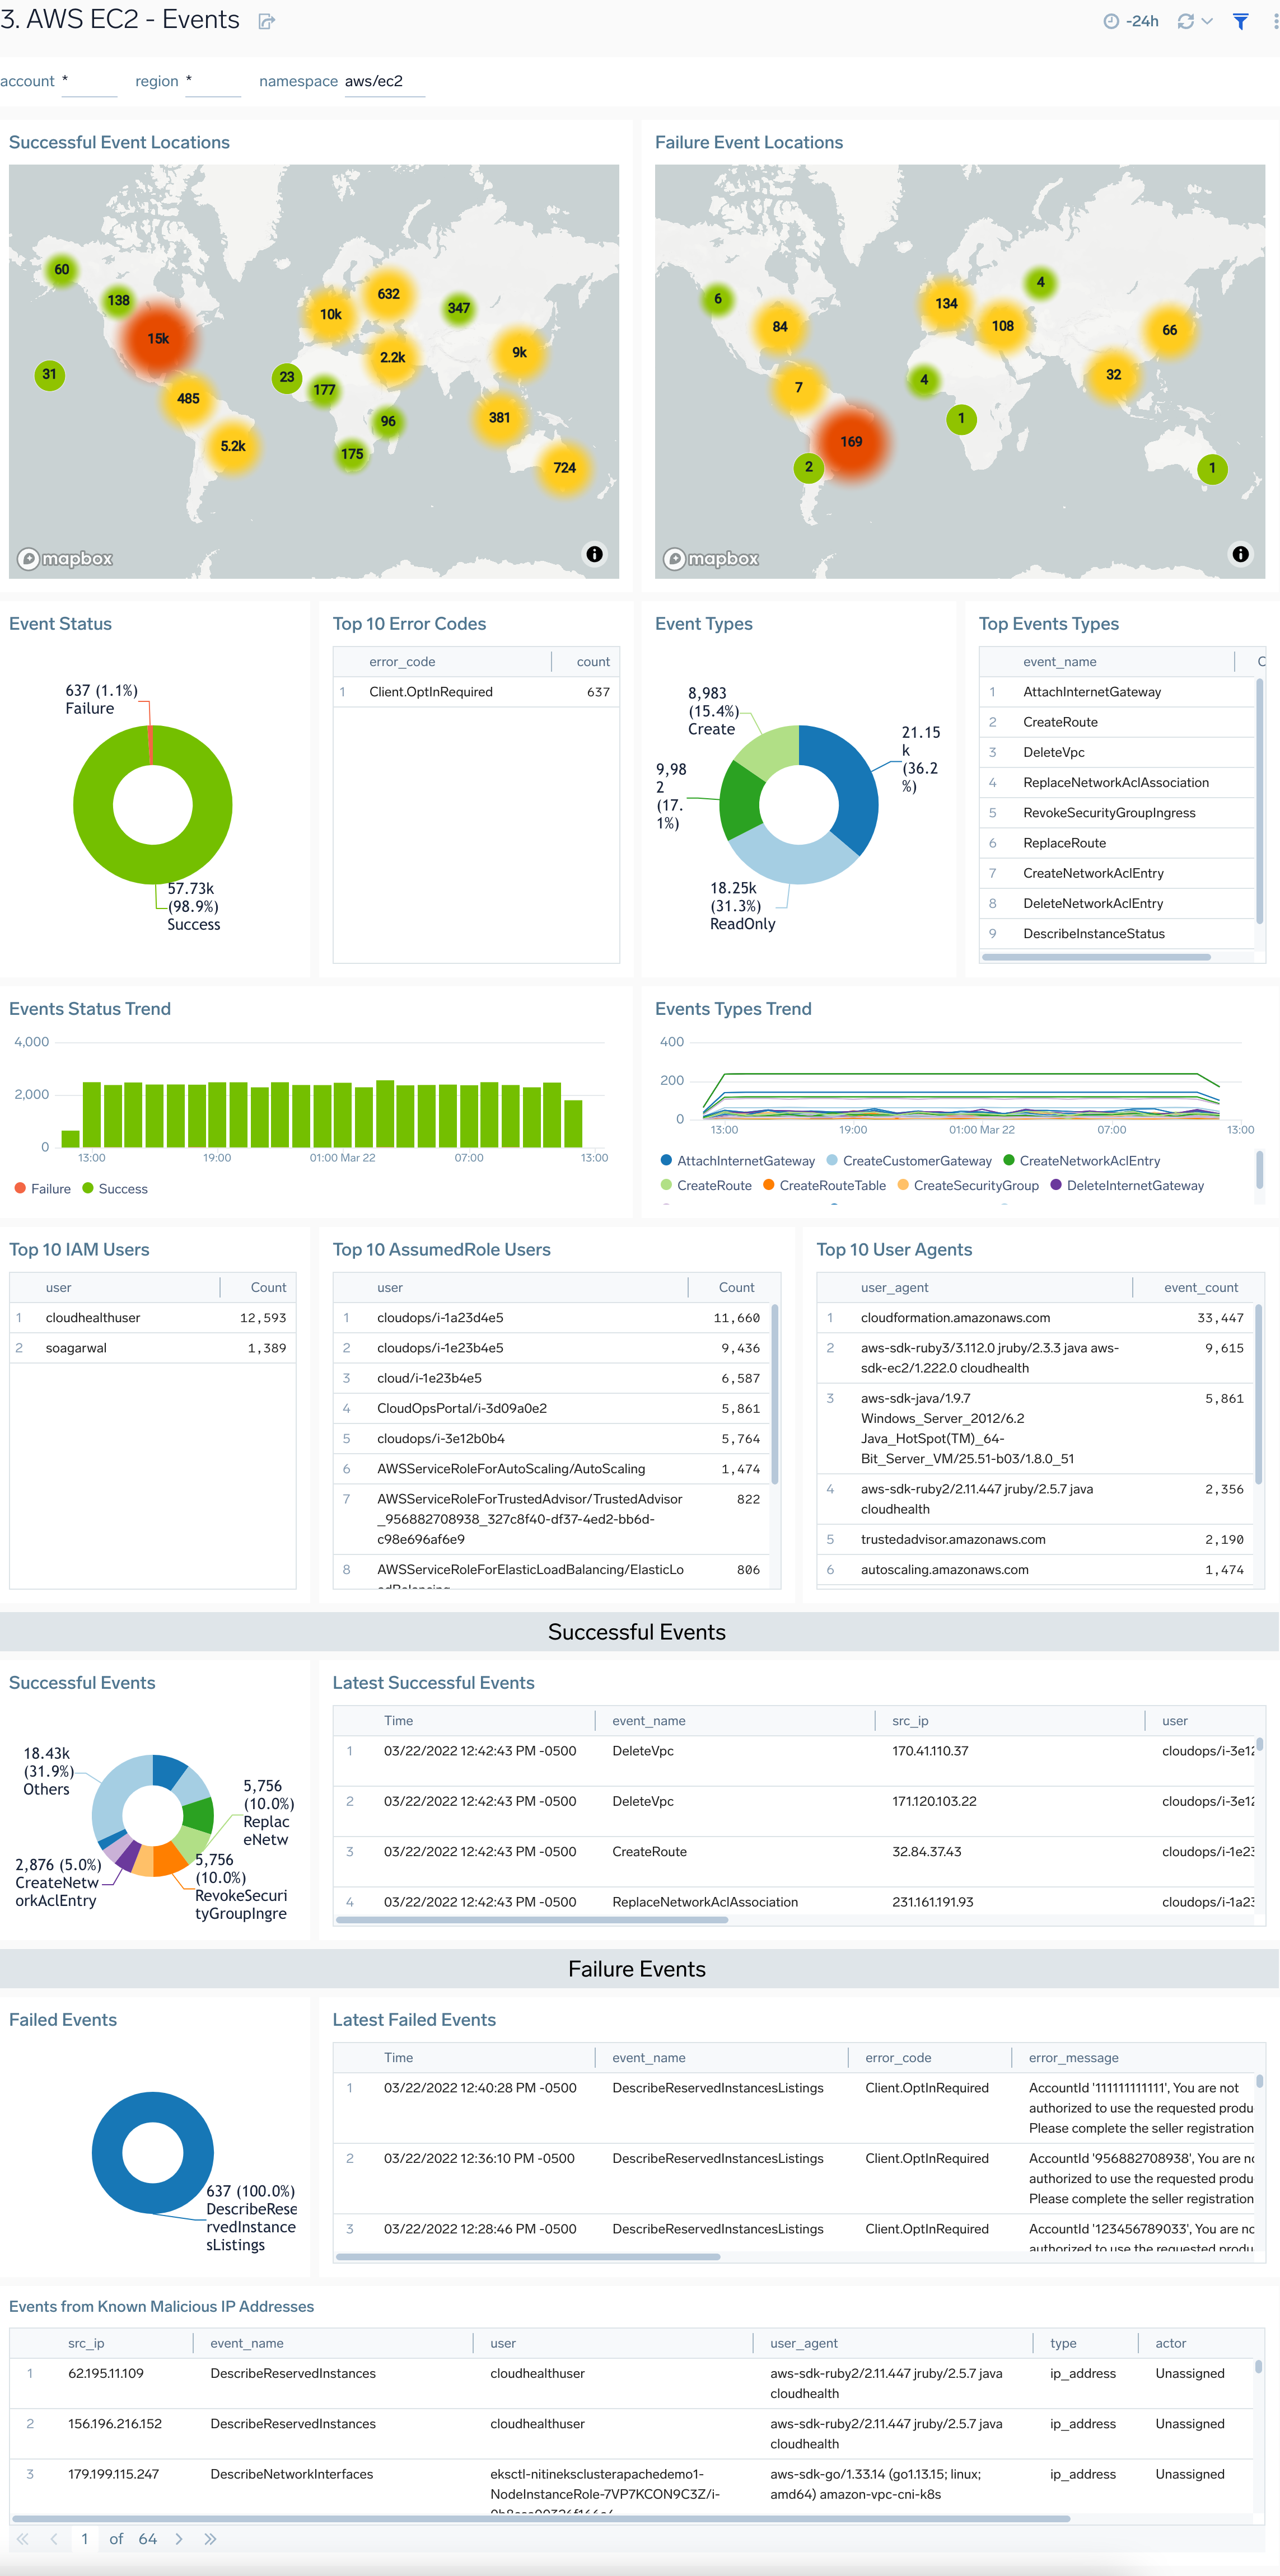
7. AWS EC2 - Events
The AWS EC2 - Events dashboard provides detailed insights into all CloudTrail audit events associated with EC2 instances and specifically helps identify changes, errors, user activities along with location details.
Use this dashboard to:
- Monitor all EC2 related audit logs available via CloudTrail events.
- Monitor incoming user activity locations for both successful and failed events with failure reasons, location of incoming user activity, top IAM users, AssumedRole users, and user agents to ensure they match with expectations
- Quickly identify top error codes to diagnose any outages
- Monitor trends around failed events to identify potential service disruptions that could warrant deeper investigation
- Monitor requests coming in from known malicious IP addresses detected via Sumo Logic Threat Intel.