AWS Classic Load Balancer
The AWS Classic Load Balancer (ELB) distributes incoming application traffic across multiple EC2 instances in multiple Availability Zones and operates at both the request level and connection level.
The Sumo Logic App for AWS Observability Classic Load Balancer is a unified logs and metrics (ULM) App that gives you visibility into the health of your Classic Load Balancer. Use the pre-configured dashboards to understand the latency, request and host status, threat intel, and HTTP backend codes by availability zone.
Log and Metric Types
The AWS Classic Load Balancer ULM App uses the following log and metric types:
- Metrics included in the AWS/ELB namespace. For more details, see this AWS Services help page.
The logs are stored in a .gzip format in the specified S3 bucket and contain these fields in this order: timestamp, elb client:port, backend:port, request_processing_time, backend_processing_time, response_processing_time, elb_status_code, backend_status_code, received_bytes, sent_bytes, request, user_agent, ssl_cipher, ssl_protocol
For more details on the Classic Load Balancer Access log, see the Classic Load Balancer Access Logs.
Sample Access Log Message
2022-03-02T12:02:58.135502Z sumo-classicelb 2.57.121.10:61001 172.31.82.43:80 0.000039 0.001338 0.000026 404 404 0 196 "GET http://localhost:80/admin/config.php HTTP/1.1" "gbrmss/7.29.0" - -
Sample Query
The following query sample was taken from the 5XX Backend Response Codes panel on the AWS Classic Load Balancer - Connections and Host Status dashboard.
account=dev region=us-east-1 Namespace=aws/elb loadbalancername=long-api-lb AvailabilityZone=* metric=HTTPCode_Backend_5XX Statistic=Sum | sum by account, region, namespace, loadbalancername, AvailabilityZone
AWS Classic Load Balancer Dashboards
This page provides examples and descriptions for each of the AWS Observability Classic Load Balancer pre-configured dashboards.
Elastic Load Balancing automatically distributes your incoming traffic across multiple targets, such as EC2 instances, containers, and IP addresses, in one or more Availability Zones. It monitors the health of its registered targets, and routes traffic only to the healthy targets.
The Sumo Logic AWS Observability Classic Load Balancer Dashboards provides visibility into the health of Classic Load Balancer and backend server in your AWS environment. Use the pre-configured dashboards to understand the load, errors, response codes, and latency by backend servers, hosts as well as requests from malicious sources, and HTTP response codes.
We highly recommend you view these dashboards in the Explore View of the AWS Observability solution.
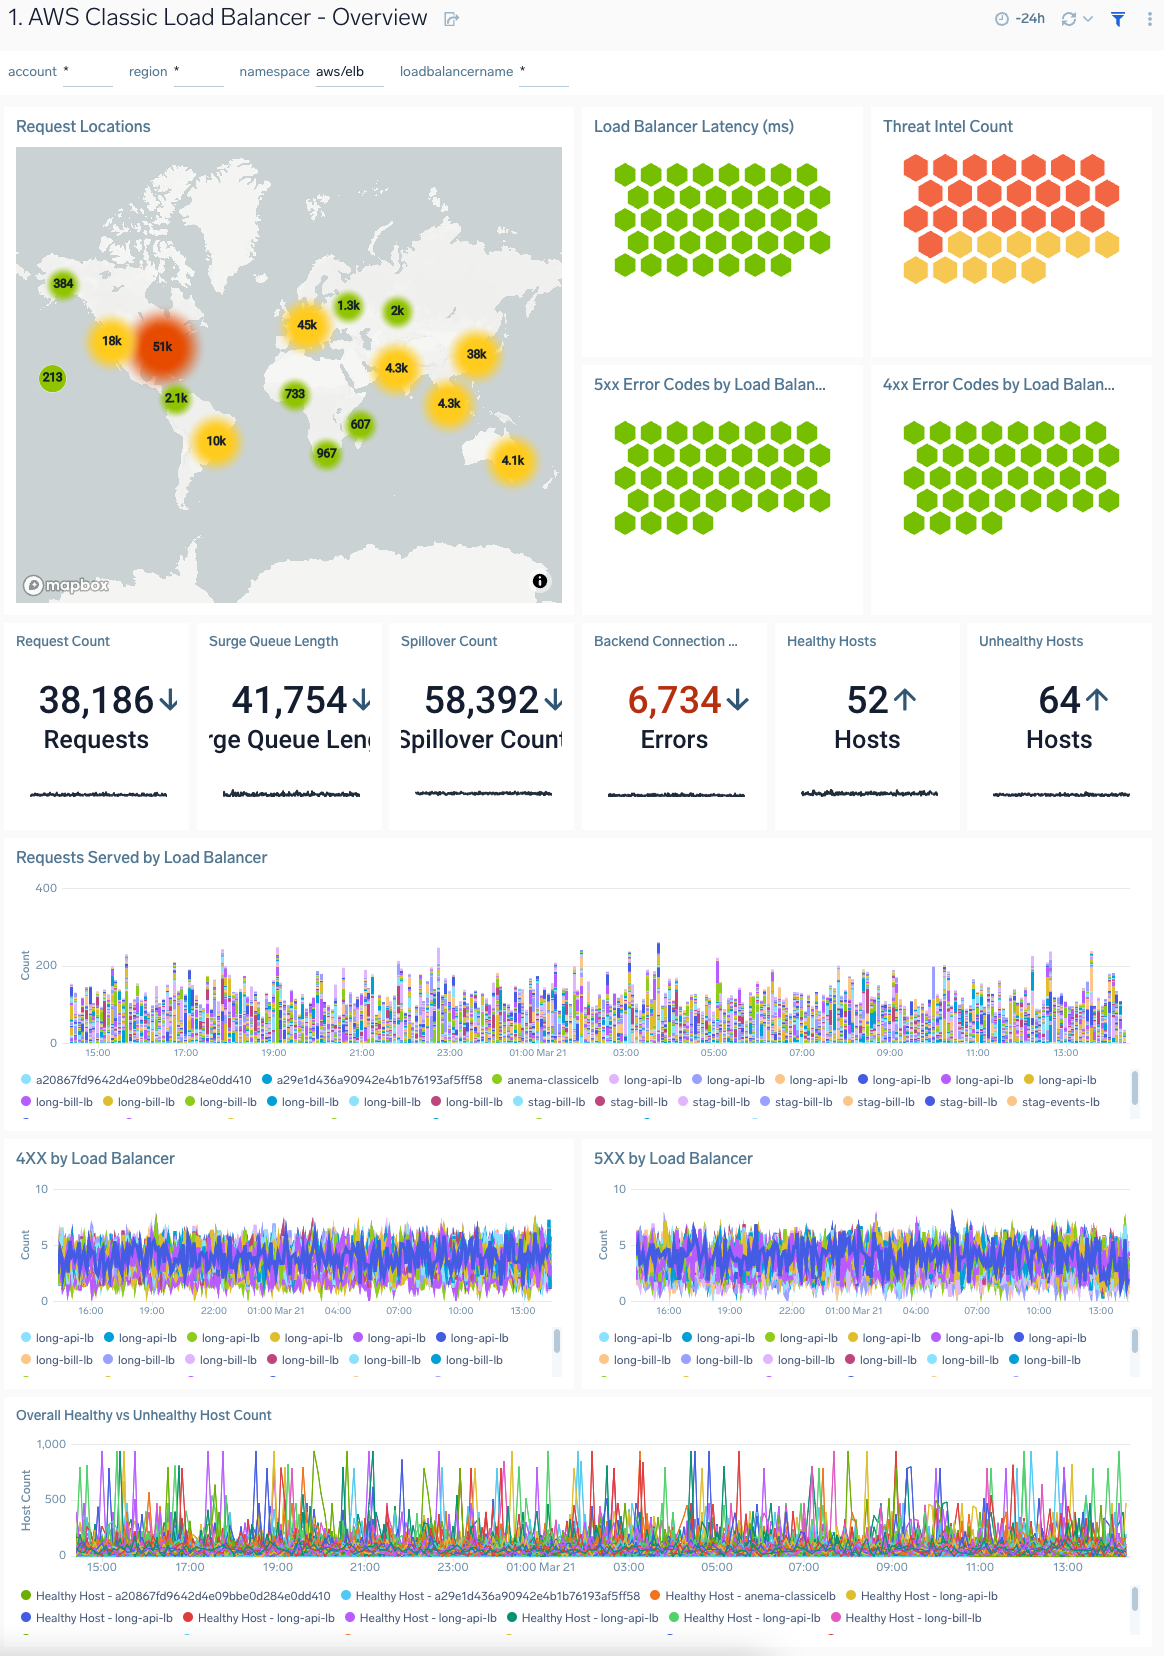
AWS Classic Load Balancer - Overview
AWS Classic Load Balancer - Overview dashboard provides visibility into the health of your Classic Load Balancer, with at-a-glance views of latency, request and host status, requests from malicious sources, and HTTP backend codes.
Use this dashboard to:
- Monitor requests to each load balancer to ensure load is being distributed as desired
- Monitor trends for load balancers errors, 4xx and 5xx errors, as well as healthy and unhealthy hosts
- Monitor the current state across all load balancers via active connections, new connections, backend connection errors, and rejected connections
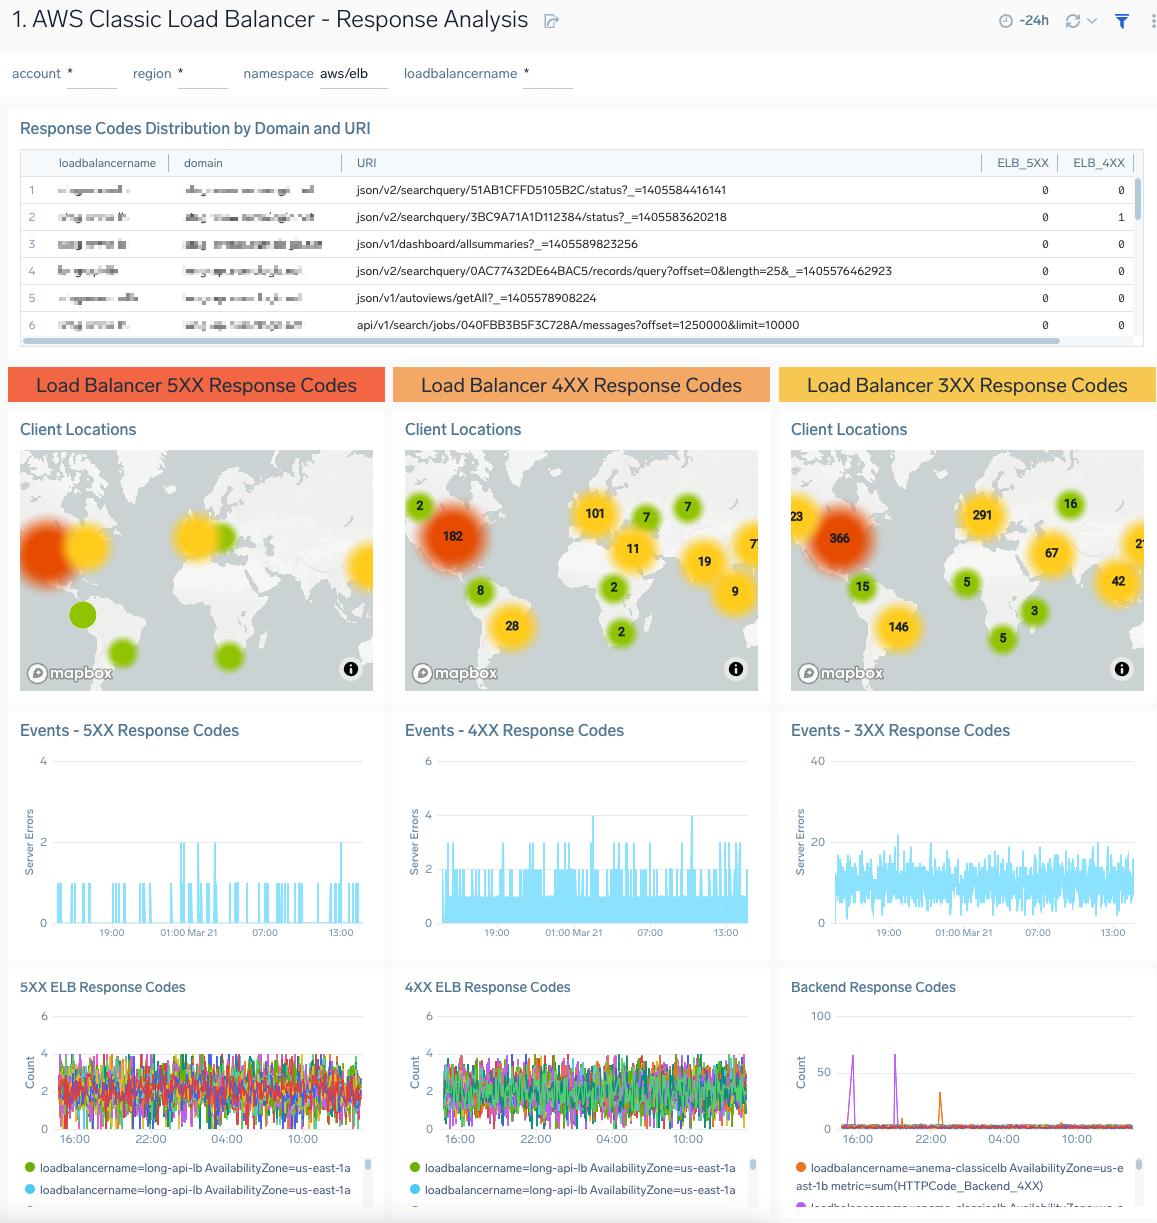
1. AWS Classic Load Balancer - Response Analysis
AWS Classic Load Balancer - Response Analysis dashboard provides insights into how your load balancers are responding to clients.
Use this dashboard to:
- Monitor incoming client locations for all 5XX, 4XX and 3XX error responses.
- Quickly correlate error responses using load balancer access logs and AWS CloudWatch metrics to determine the possible cause for failures and decide corrective actions.
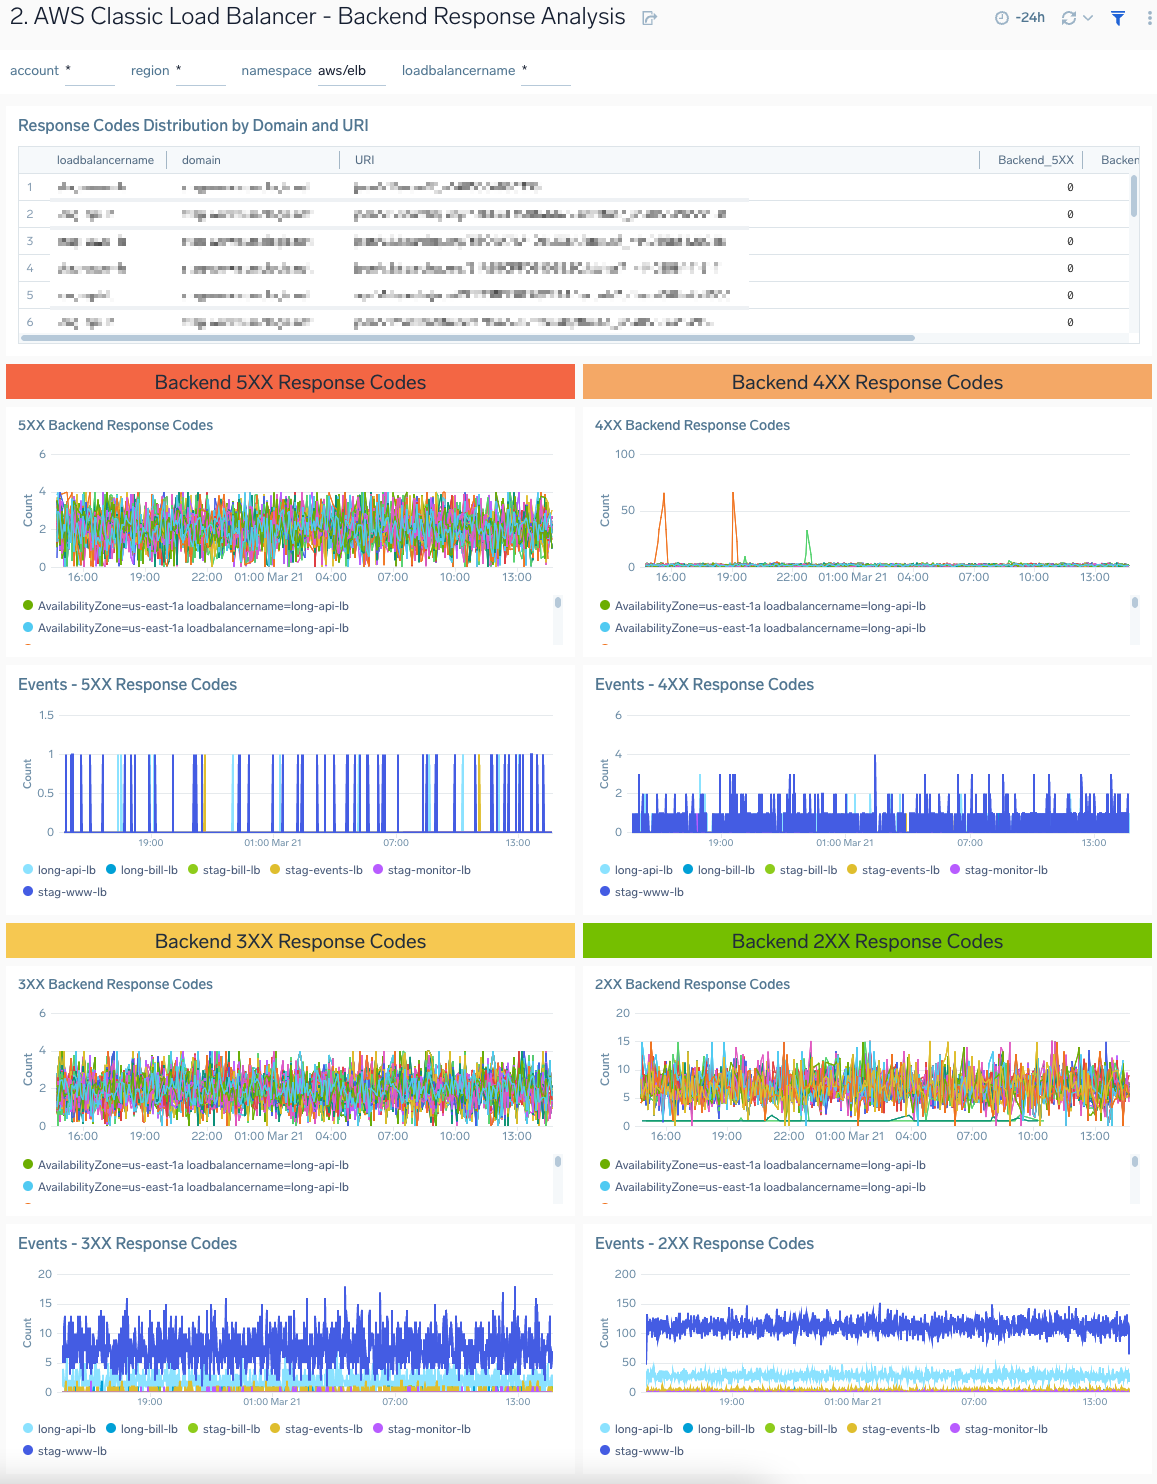
2. AWS Classic Load Balancer - Backend Response Analysis
The AWS Classic Load Balancer - Backend Response Analysis dashboard provides insights into how various backend servers are responding to client requests.
Use this dashboard to:
- Monitor trends of all response codes for your backend servers by LoadBalancer and availability zones.
- Correlate response code trends across load balancer access logs and CloudWatch metrics to determine the root cause for failures
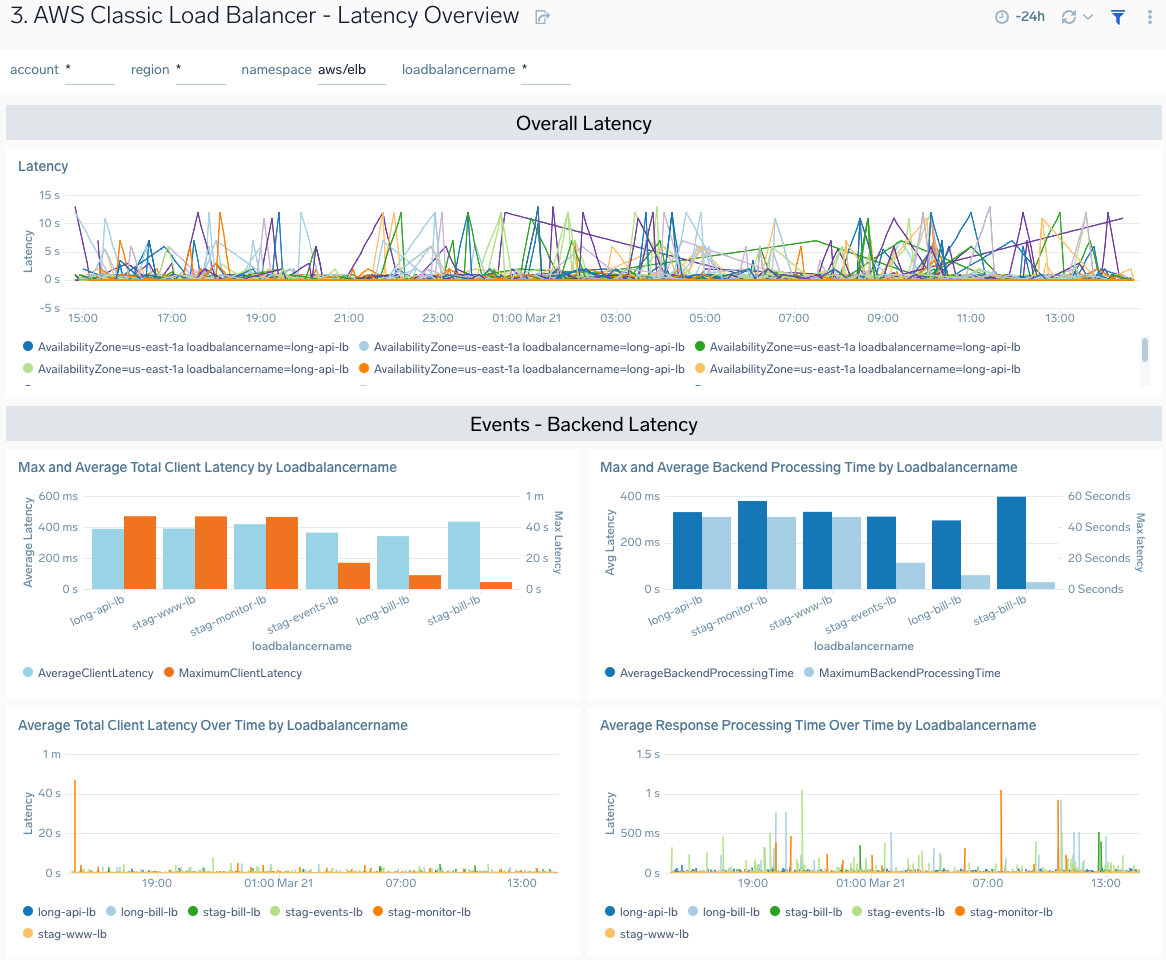
3. AWS Classic Load Balancer - Latency Overview
The AWS Classic Load Balancer - Latency Overview dashboard provides insights into response times for load balancers, and availability zones, including backend log response times.
Use this dashboard to:
- Monitor response times by load balancer, and availability zone.
- Monitor client latency and processing times for backend servers.
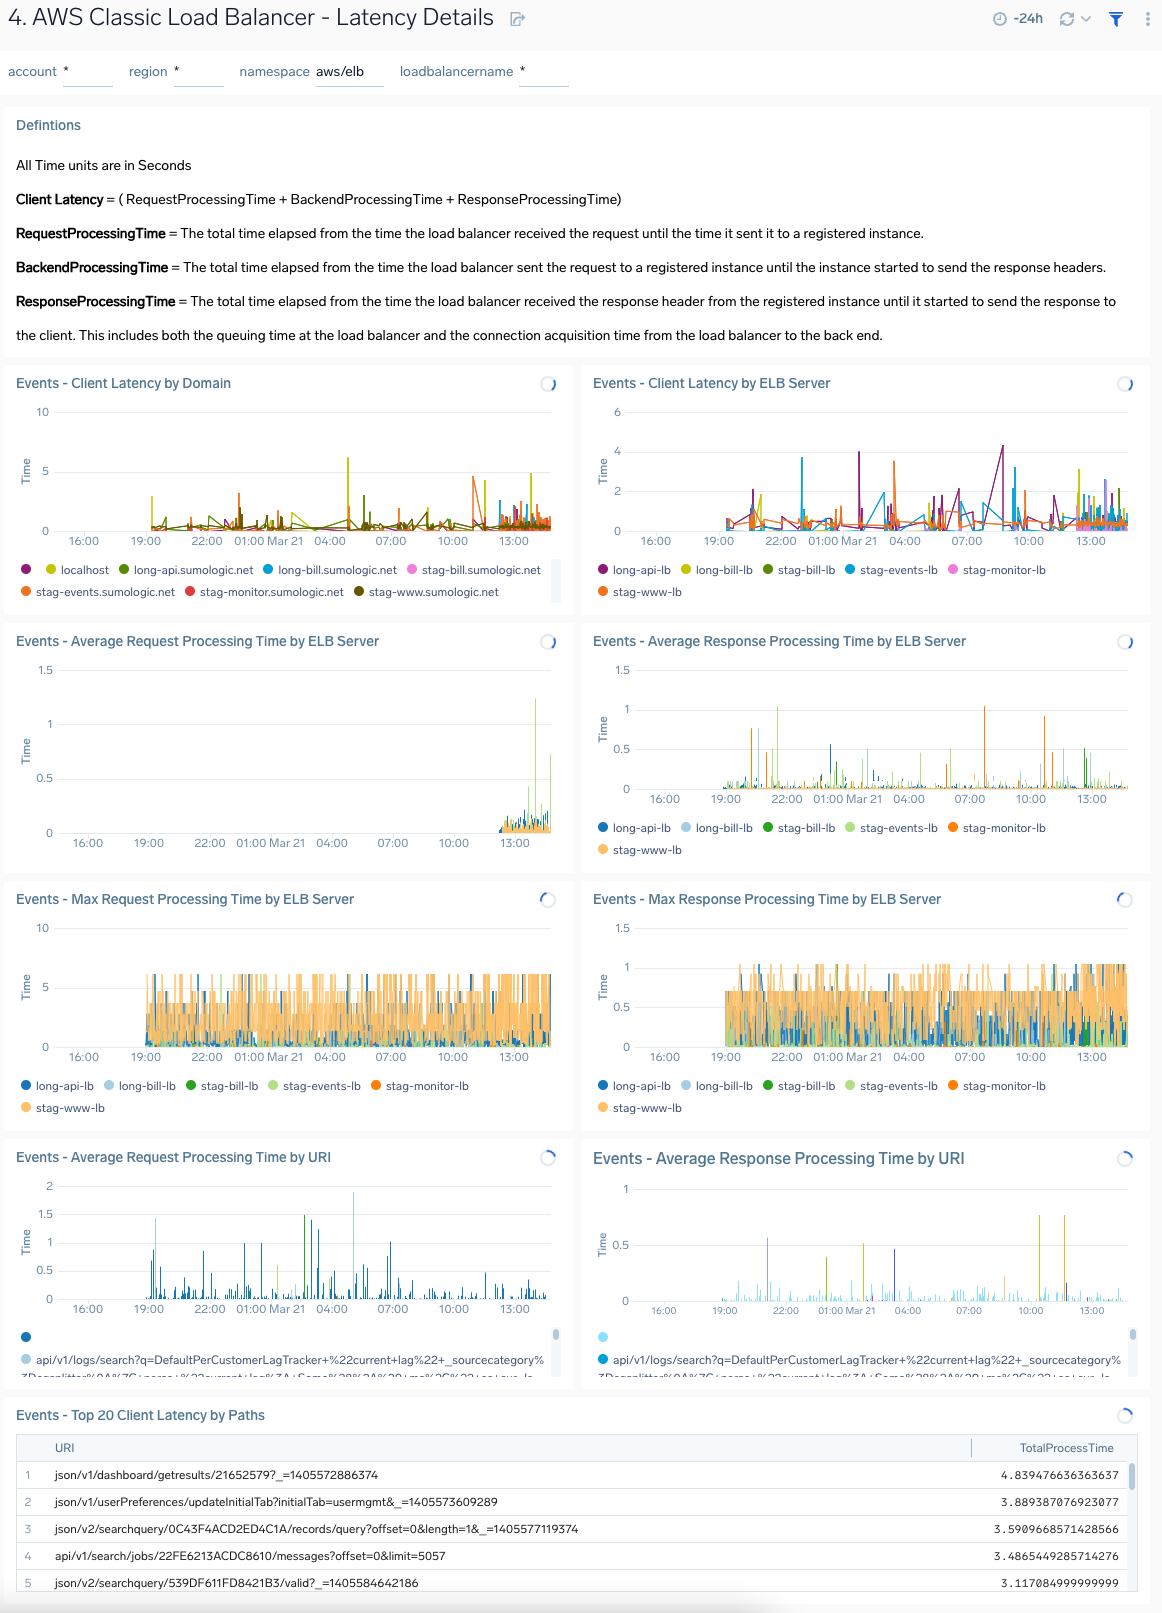
4. AWS Classic Load Balancer - Latency Details
The AWS Classic Load Balancer - Latency Details dashboard provides insights into client latency by domain and ELB server, as well as processing times by ELB server throughout your infrastructure.
Use this dashboard to:
- Troubleshoot load balancer performance via detailed views across client, request processing and response time latencies.
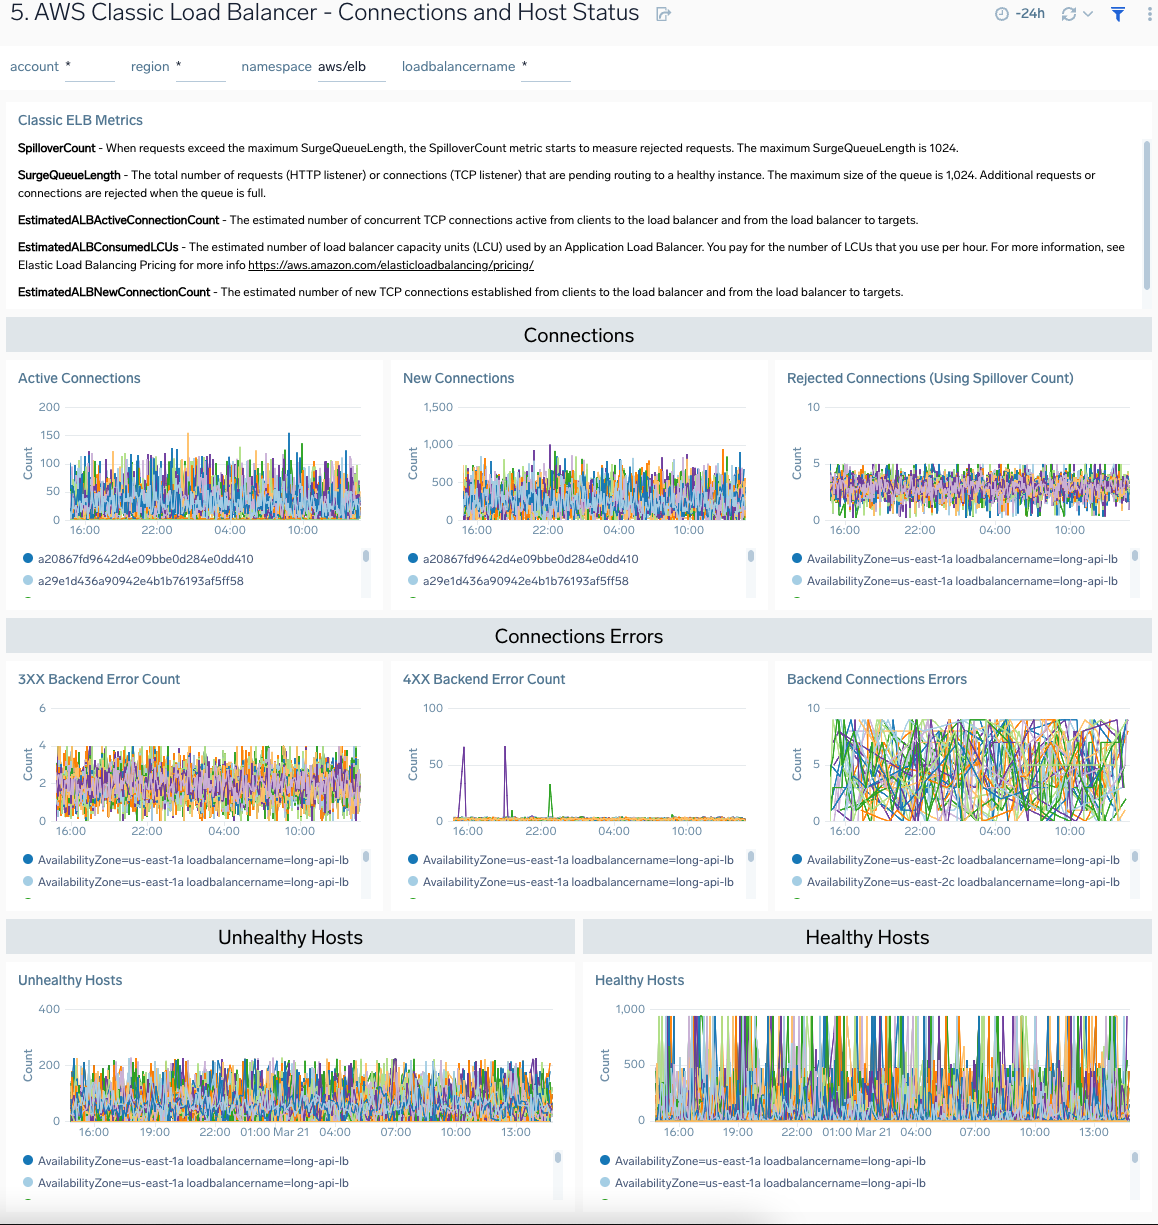
5. AWS Classic Load Balancer - Connection and Host Status
The AWS Classic Load Balancer - Connection and Host Status dashboard provides insights into active and rejected connections, backend connection errors, and healthy and unhealthy hosts.
Use this dashboard to:
- Monitor active connections, new connections, rejected connections, and connection errors for load balancers
- Monitor healthy and unhealthy host counts by load balancer, and availability zone across your infrastructure
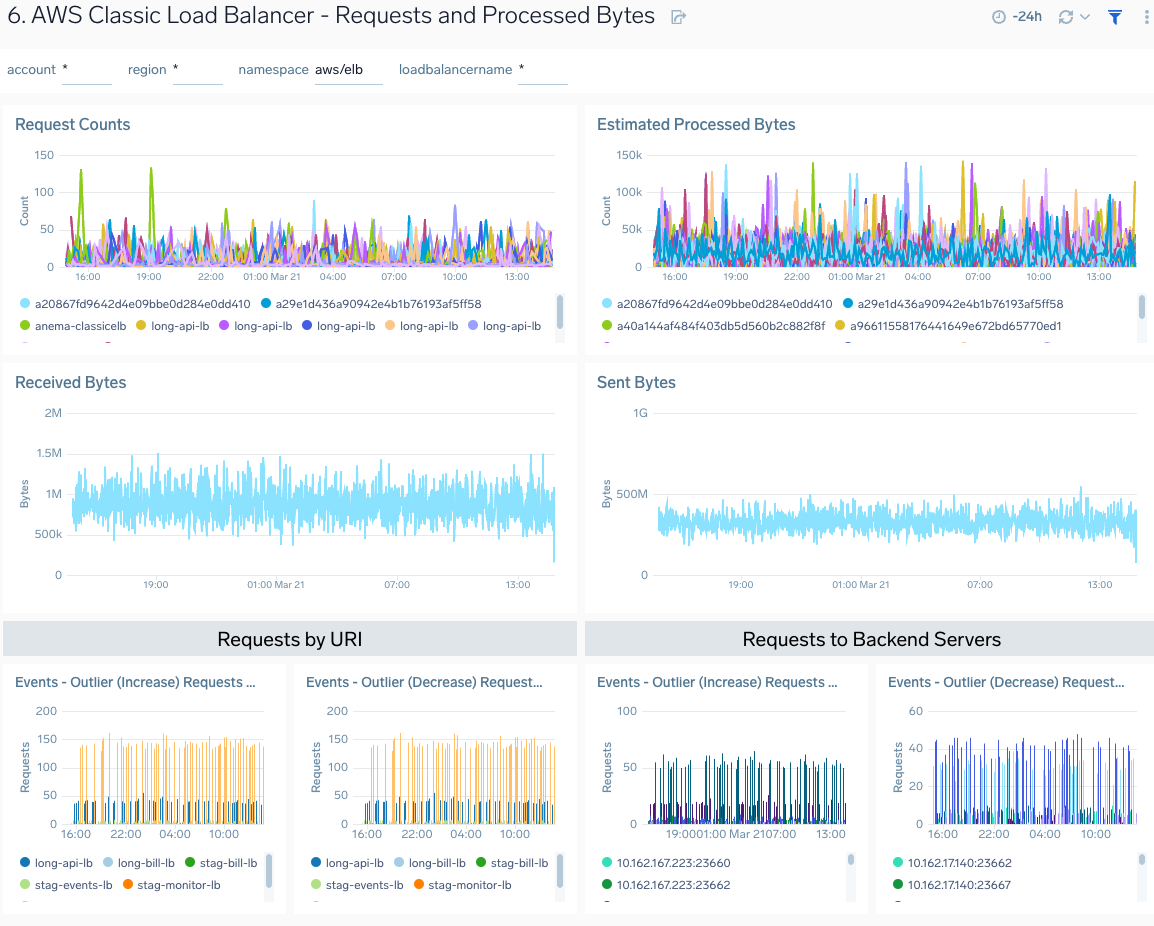
6. AWS Classic Load Balancer - Requests and Processed Bytes
AWS Classic Load Balancer - Requests and Processed Bytes dashboard provides insights into client requests, network traffic and processed data.
Use this dashboard to:
- Monitor client request load, network traffic and processed bytes to determine how to best configure load balancers for optimal performance
- Determine how to best allocate backend resources based on load
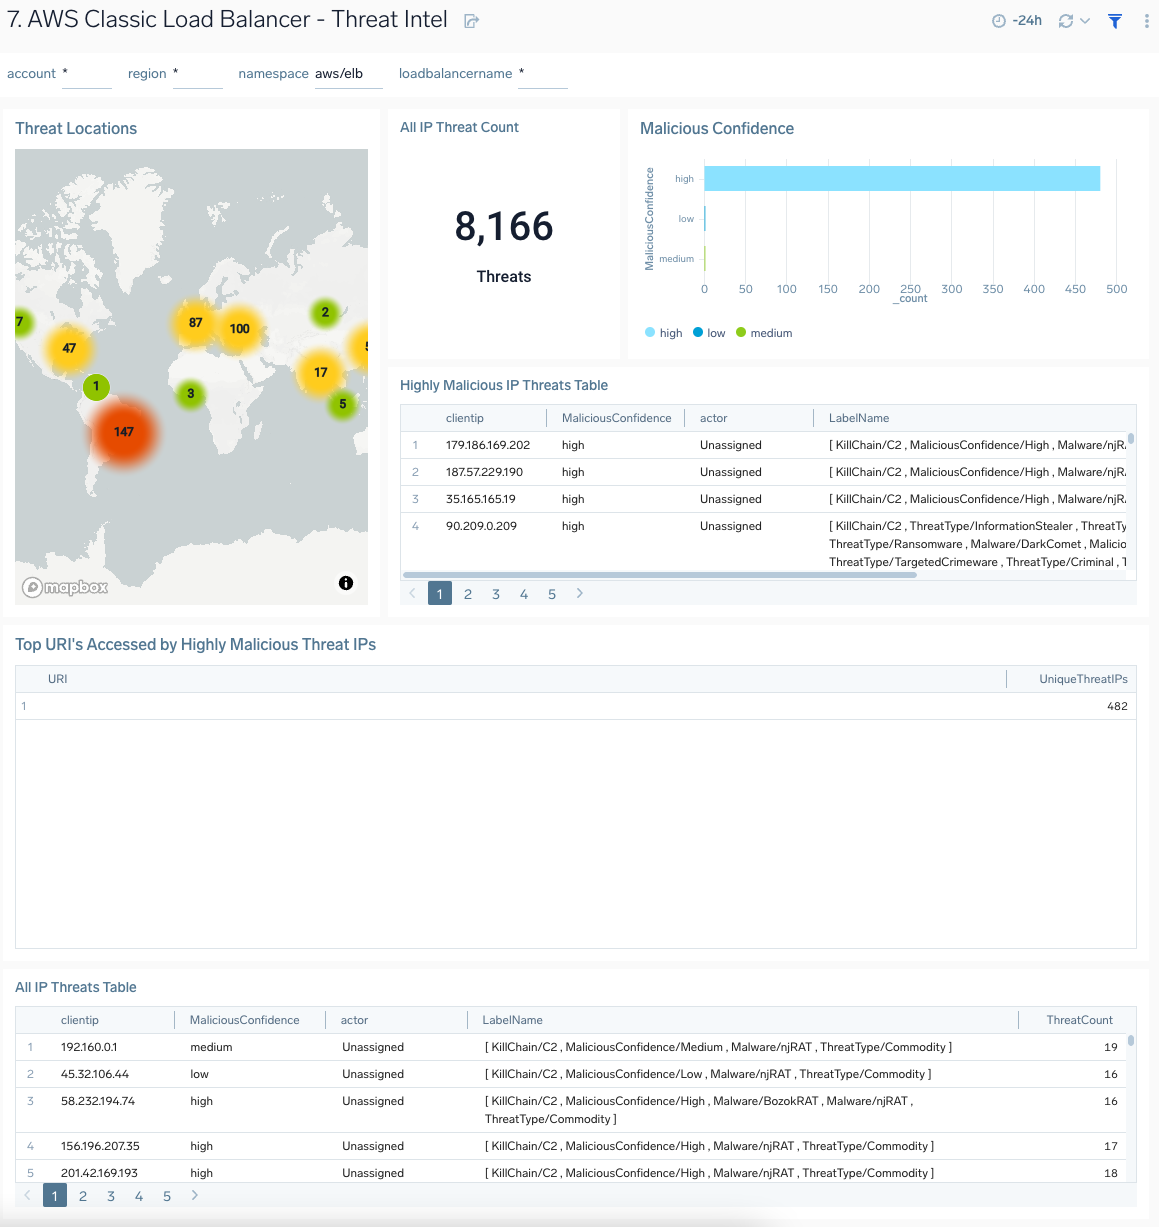
7. AWS Classic Load Balancer - Threat Intel
AWS Classic Load Balancer - Threat Intel dashboard provides insights into incoming requests from malicious sources determined via Sumo Logic’s Threat Intel feature. Panels show detailed information on malicious IPs and the malicious confidence of each threat
Use this dashboard to:
- Identify known malicious IPs that are accessing your load-balancers and use firewall access control lists to prevent them from sending you traffic going forward
- Monitor malicious confidence level for all incoming malicious IP addresses posing the threats.