Sumo Logic Data Volume App
The Data Volume App provides you with a summary and detailed views of your account's data usage volume by data type, tier, category, collector, source name, and hosts via predefined searches and dashboards.
Before you can install and use the Data Volume app, an administrator must first enable the feature. For more information, see Enable and Manage the Data Volume Index.
The Data Volume Index gathers volume data as soon as it is enabled. It will not gather data from legacy versions or backfill data.
Installing the Data Volume App
To install the app:
- From App Catalog, search for the Data Volume app.
- Click Data Volume.
- Select the version and click Add to Library. This opens a new window. Within the window, click on Advanced and choose a location to install the app.
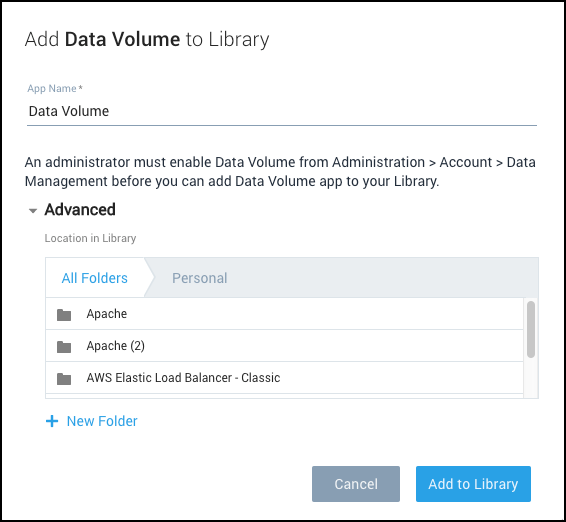
- Choose a location for Data Volume in your Personal folder.
- Click Add to Library. A dialog will confirm the app is installed successfully.
Set up Burndown Rates for Consumables
Burndown rate is the ratio for logs is the number of Credits consumed per 1 GB of ingested data. This ratio is different for each tier. Similarly, CSE ingest, Metrics and Tracing have their own burndown rates.
| Credit Variable | Unit | Default Credits per Unit |
| Cloud SIEM Enterprise | 1 GB | 25 |
| Logs - Continuous Analytics | 1 GB | 20 |
| Logs - Frequent Analytics | 1 GB | 9 |
| Metrics | 1,000 DPM | 3 |
| Logs - Infrequent Ingest | 1 GB | 0.4 |
| Tracing- Ingest | 1 GB | 14 |
The Data Volume App is set up to use these default burn down rates. However, these may vary for your Sumo Logic account based on your contract. Please confirm and change these default burn-down rates if necessary by working with your Sumo Logic Account Executive. This will ensure that the Credits dashboard will match the usage reported on the Accounts page.
Viewing Data Volume Dashboards
For each panel in a dashboard, you can perform the following actions:
- To display details for the panel time range, hover over the text in the top right corner.
- To zoom into a panel for more information, click the magnifying glass icon in the header.
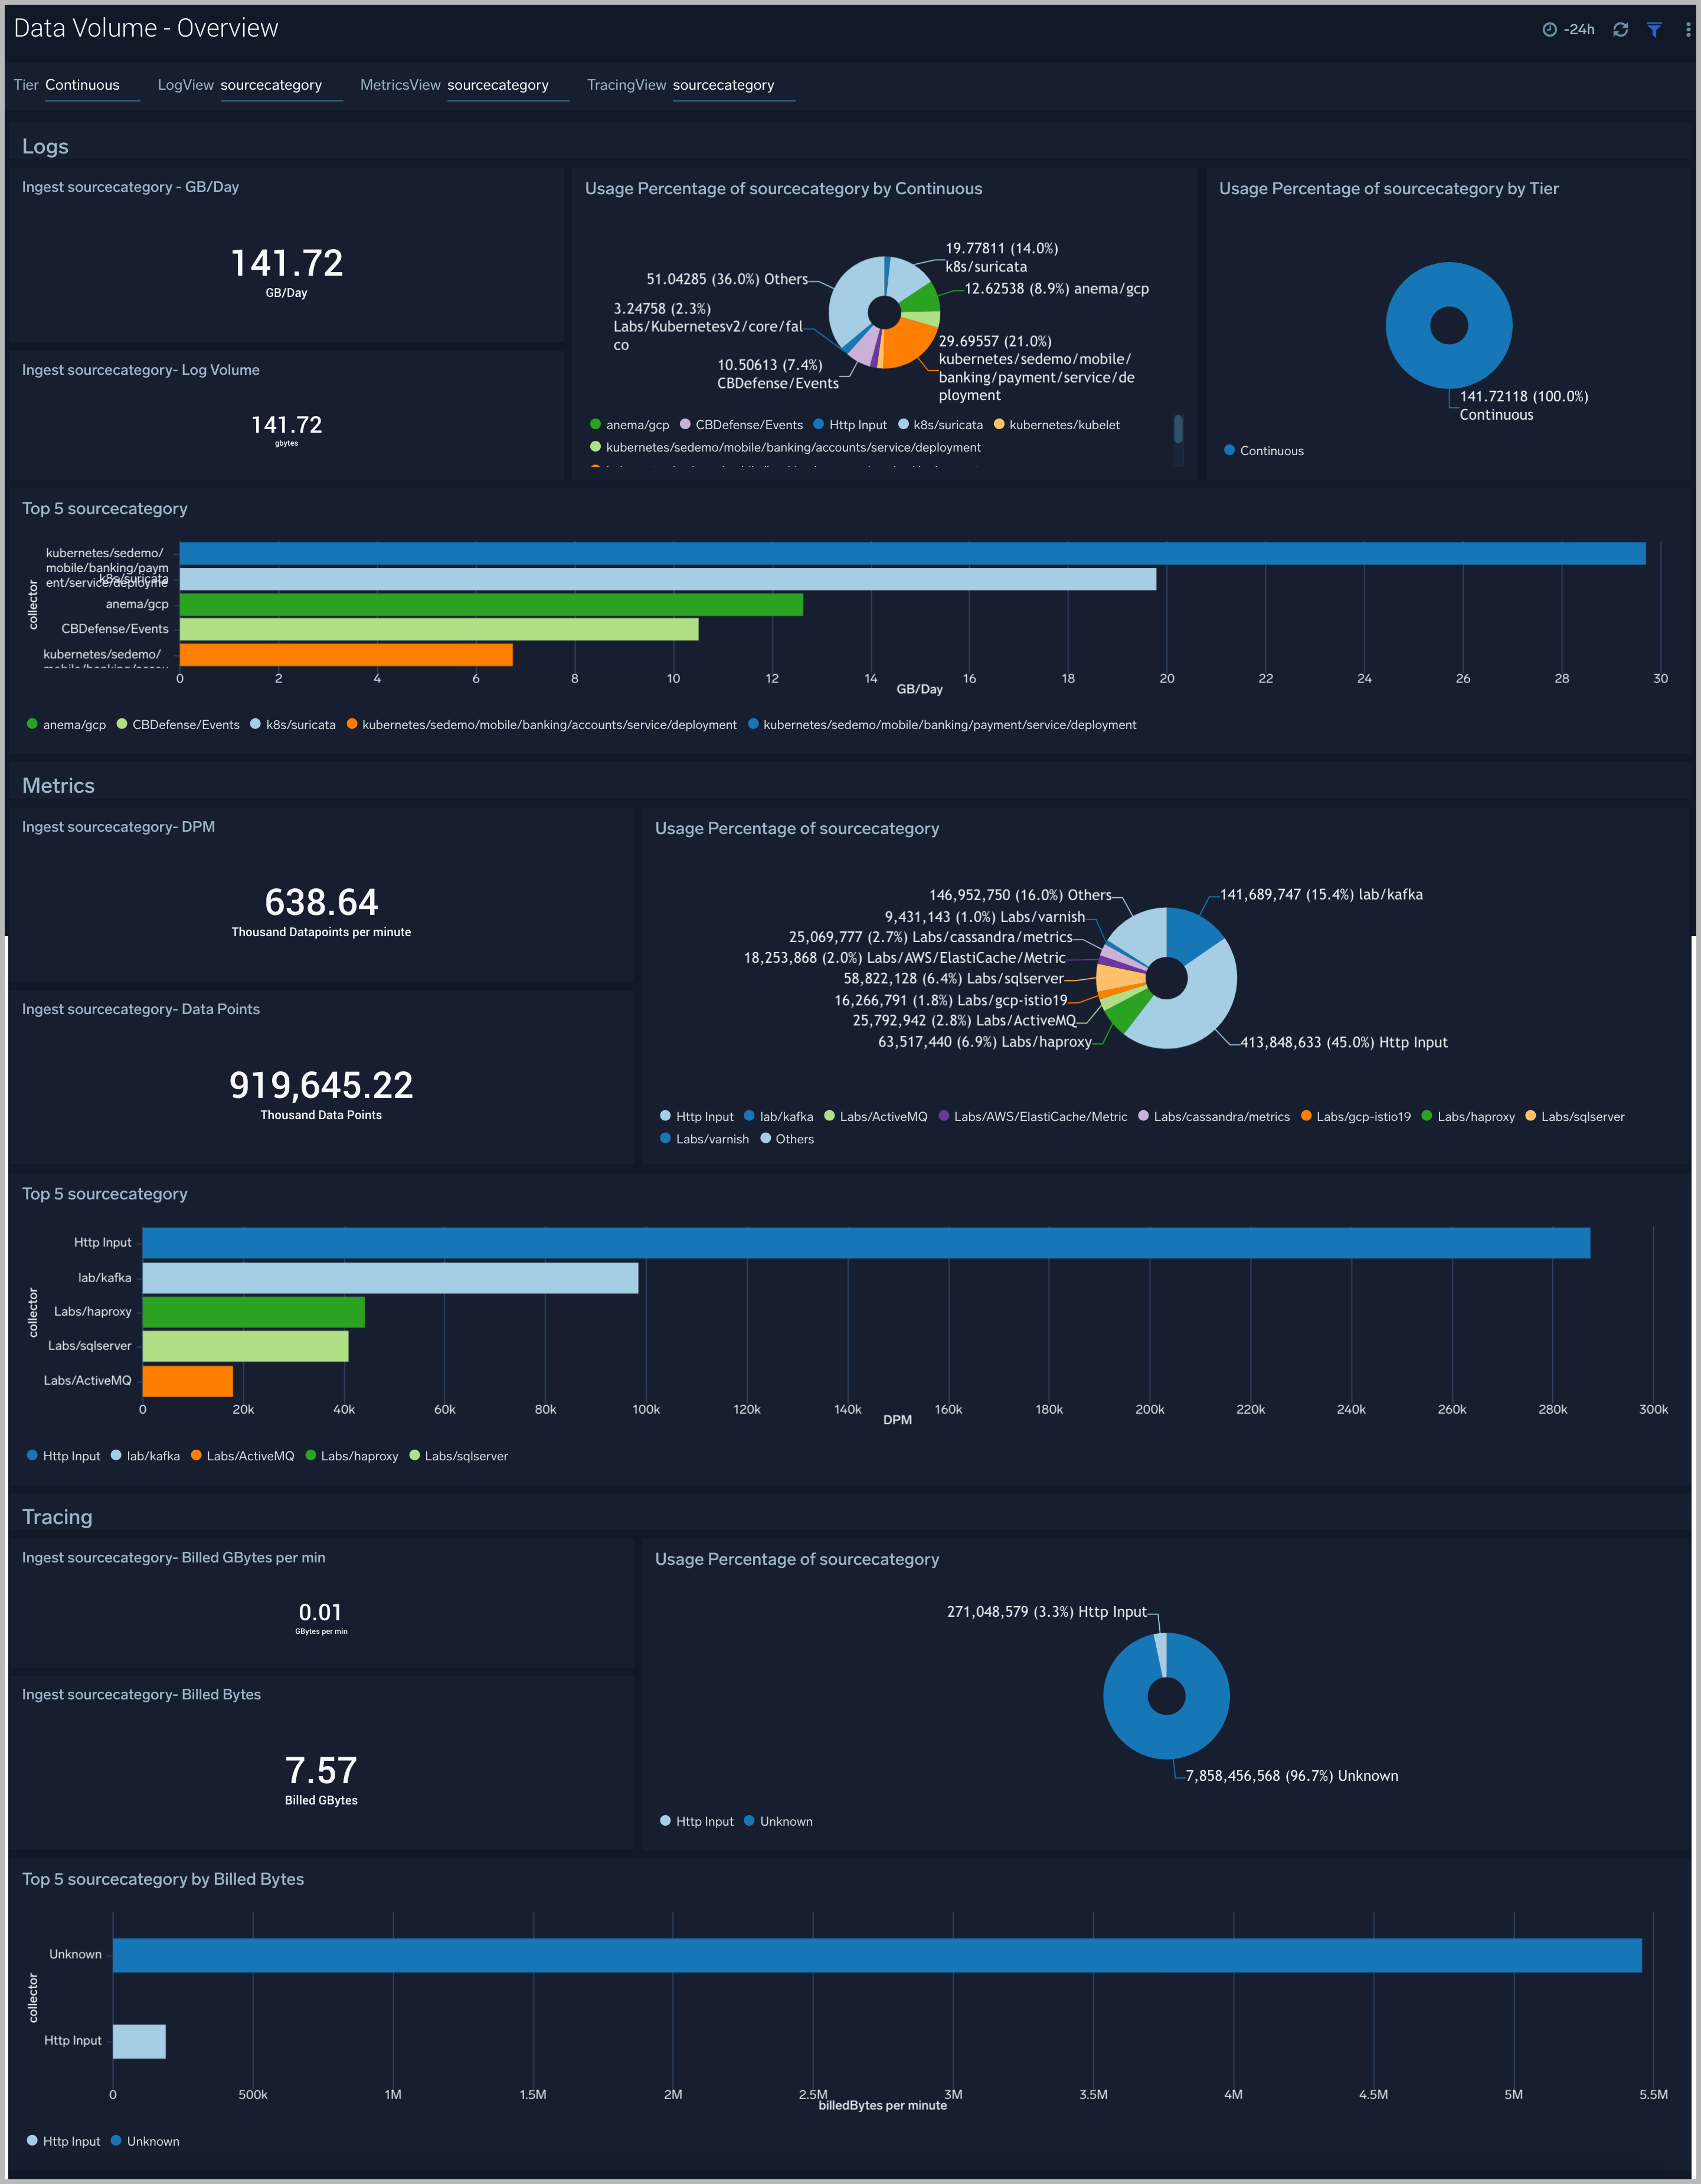
Overview
The Data Volume - Overview dashboard helps you understand your ingest in terms of Logs (by Tiers), Metrics, and Tracing capabilities.
Use this dashboard to:
- Identify the top sources, collectors, or hosts by ingesting data volume across logs, metrics, and traces
Logs
The largest data ingest typically comes from log volumes. The Data Volume - Logs dashboard allows you to view your log ingest volume by tier by ingesting spikes, outliers, and quota.
Use this dashboard to:
- Determine the log ingest volume and trends in GB across various tiers.
- Identify spikes where current hour ingestion is above 50% from the last hour. Identify outliers and forecast your data ingestion.
- Determine the log data for default index and top non-default indexes.
- Compare current ingestion to capacity and review any overages. You must configure the “Daily_Log_Ingest_Capacity” variable based on your Account Subscription. If you have Credit based plan, please check with your account executive to determine these values for your account. Otherwise, see Administration > Account > Account Overview to get your capacity values.
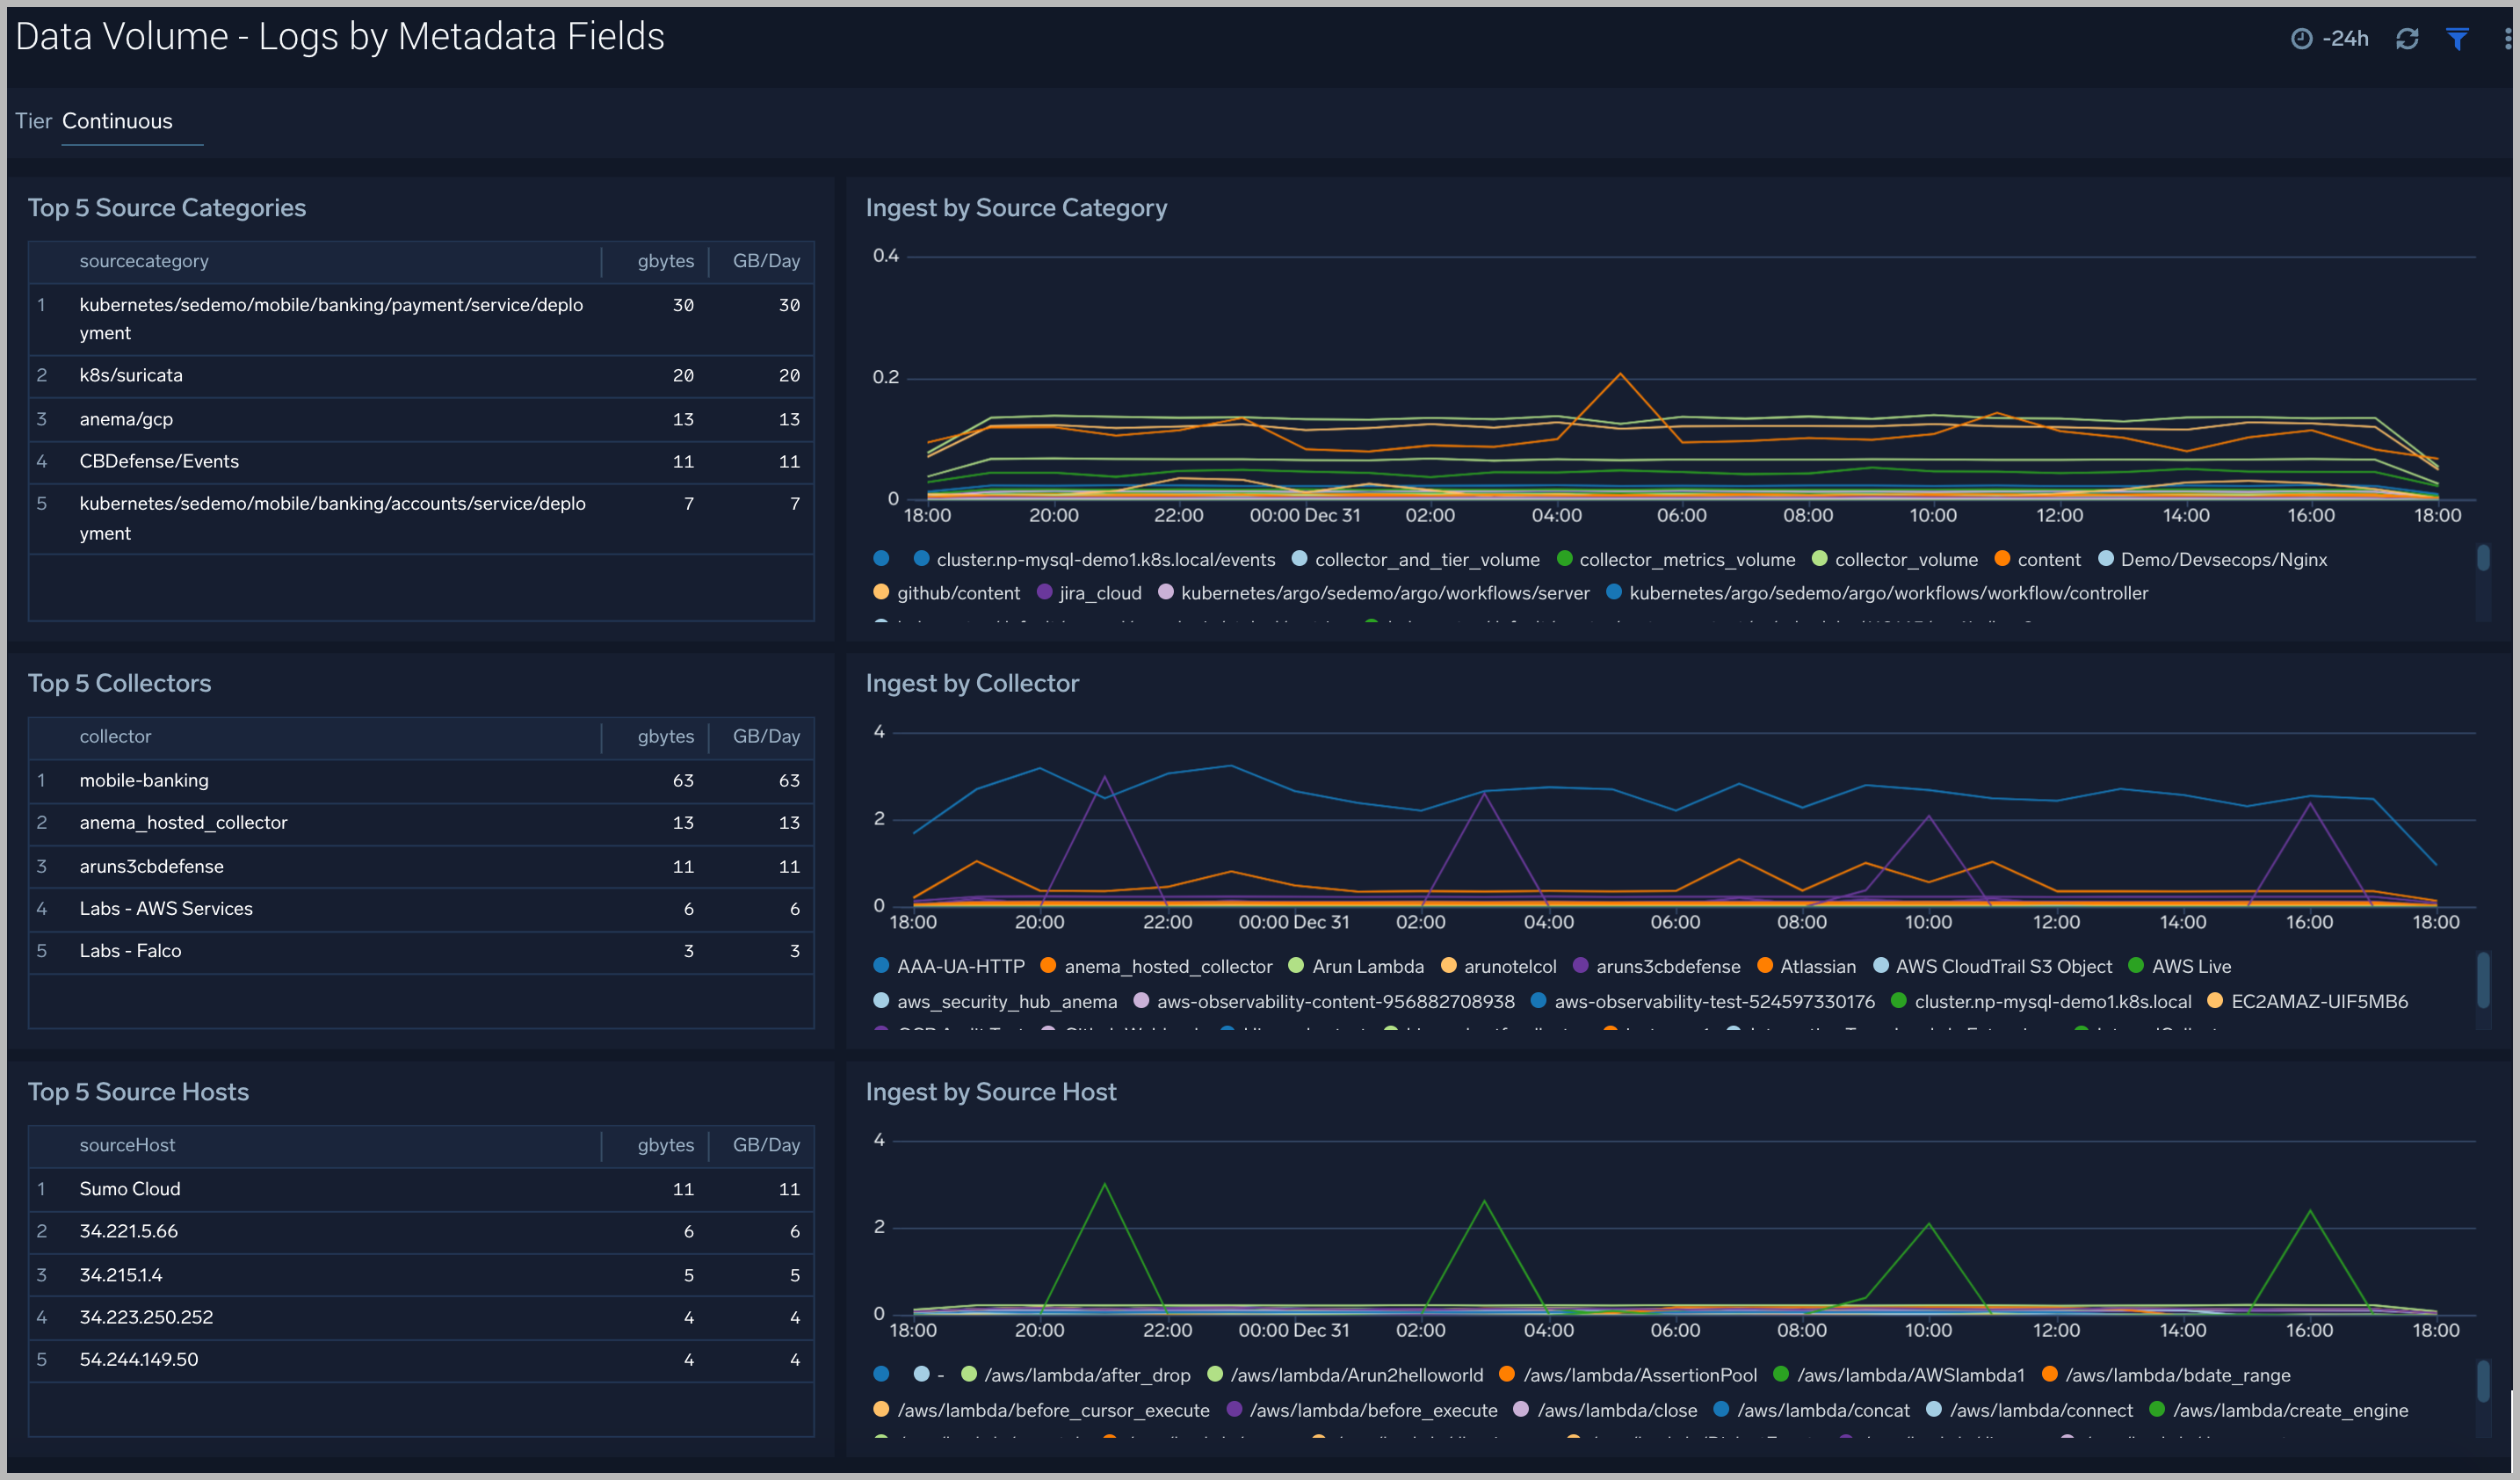
Data Volume Logs by Metadata Fields
The Data Volume - Logs by Metadata Fields dashboard allows you to view log ingest volume by tier, source categories, collectors, and hosts.
Use this dashboard to:
- Identify the top 5 sources categories, source hosts, and collectors by ingest volume
- Examine ingestion trends over time
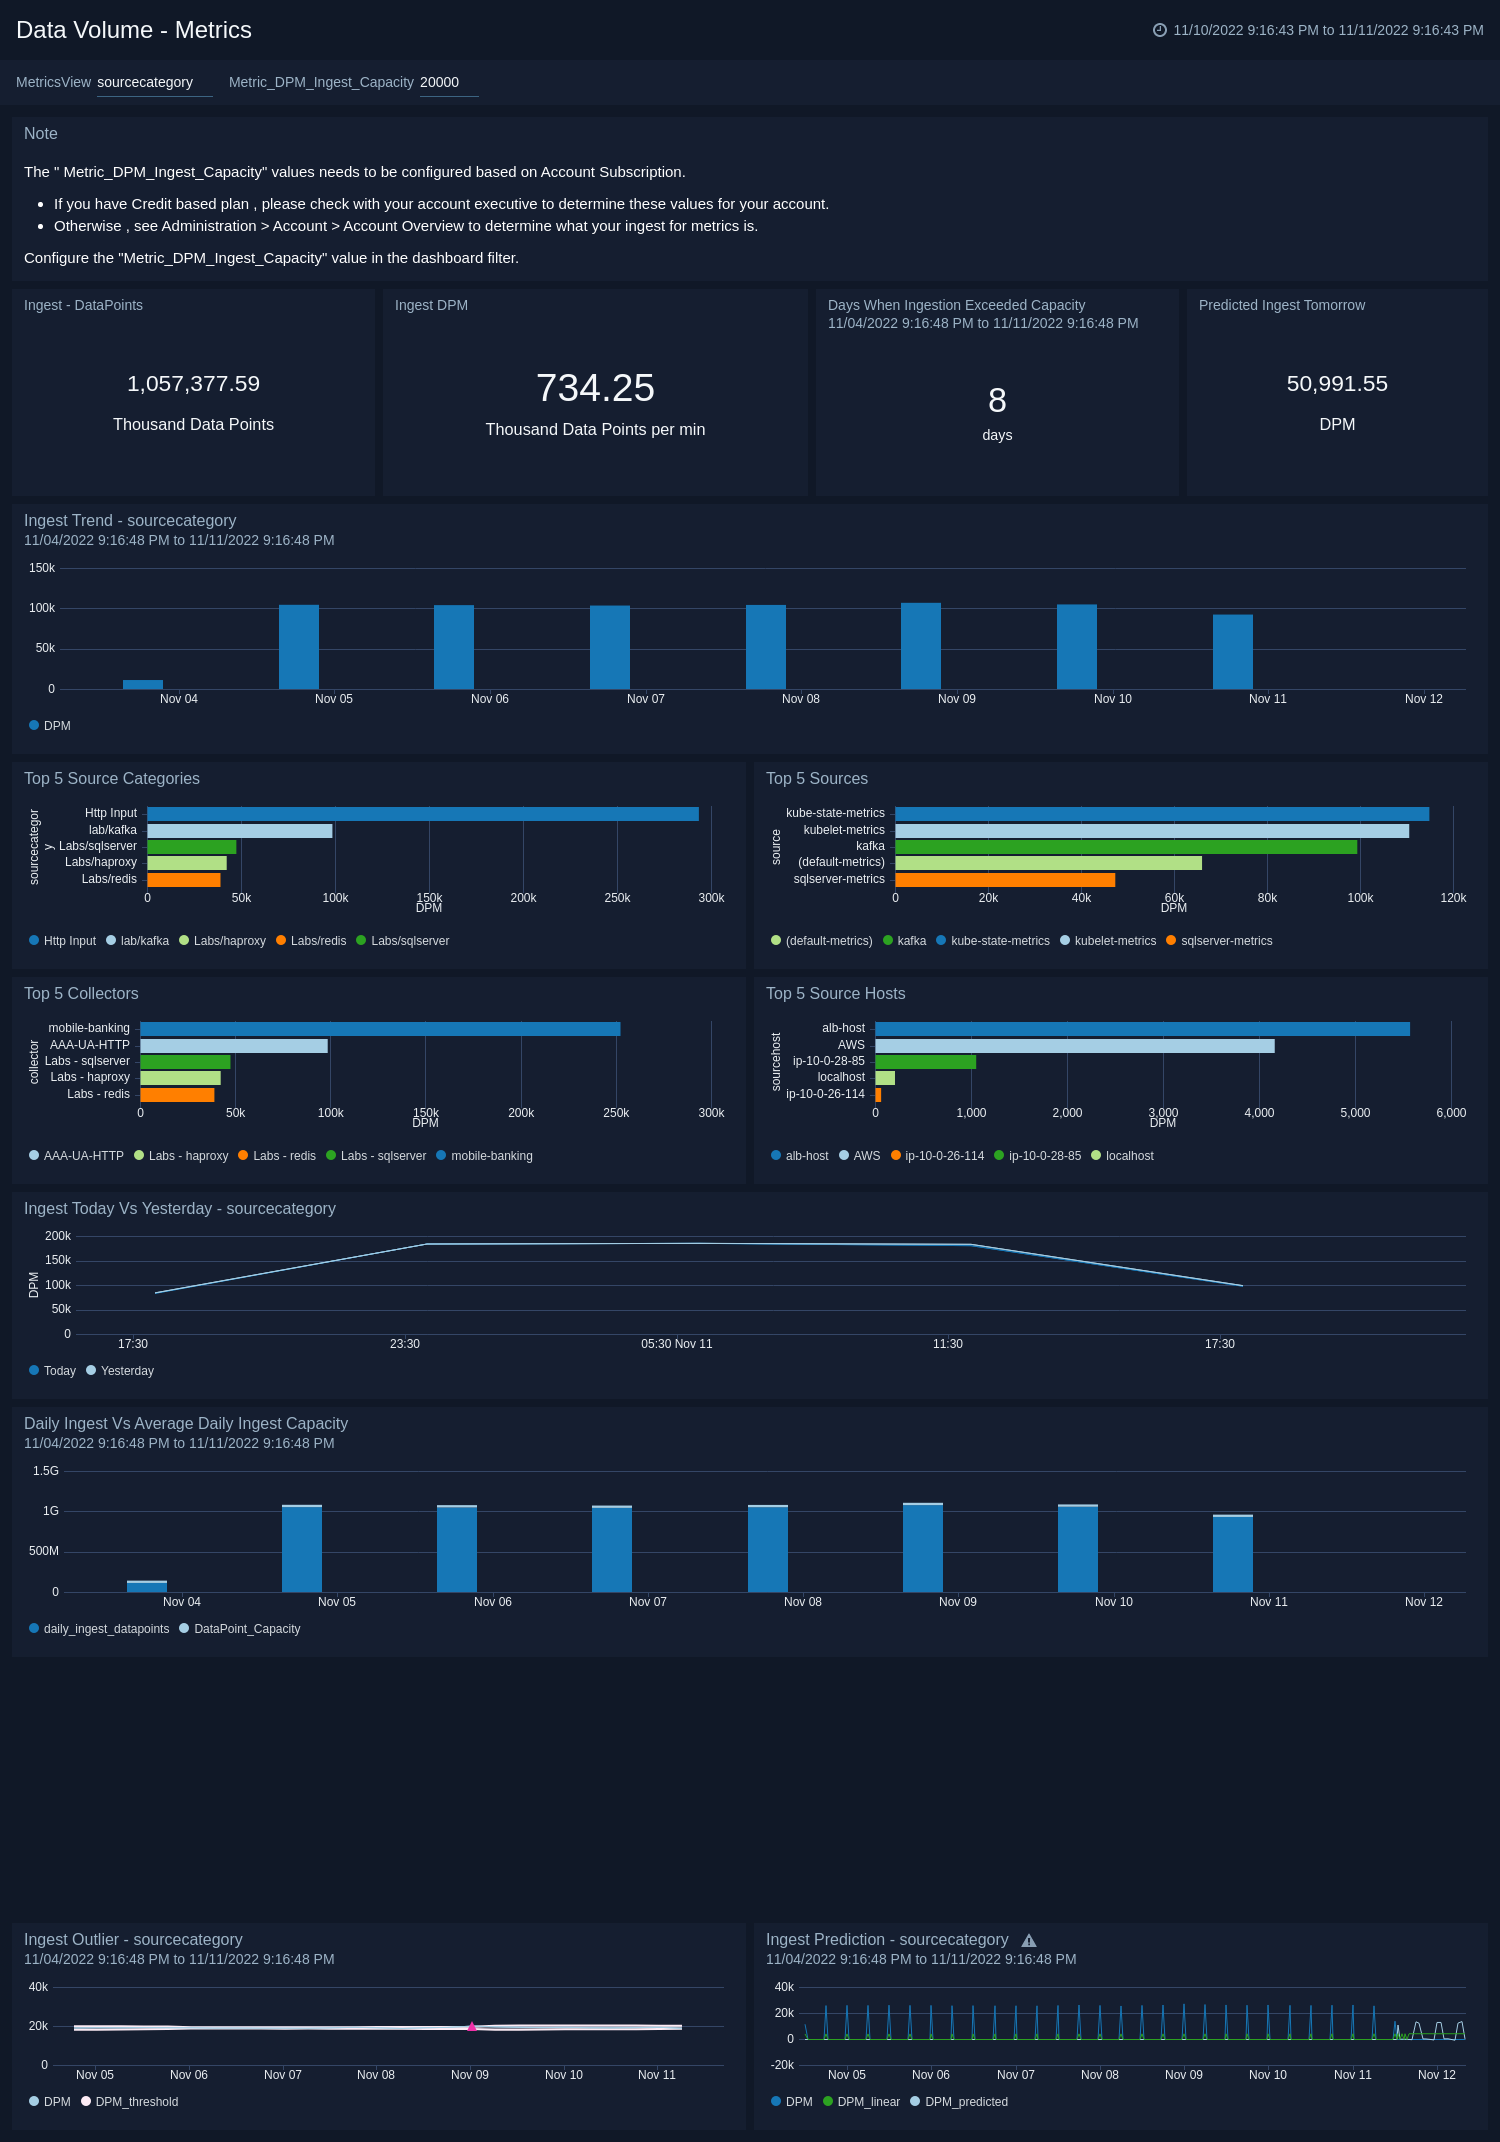
Metrics
The Data Volume - Metrics dashboard allows you to view your metrics ingested, identifies ingest outliers/spikes, and helps predict what ingestion is going to be.
Use this dashboard to:
- Determine the ingested DPM by various dimensions their
- Examine trends over time.
- Identify the spikes where current hour ingestion is above 50% from the last hour.
- Identify ingestion outliers and forecast data ingestion, analyze the comparison of your current ingestion to your capacity, and review any overages. You must configure the “Metric_DPM_Ingest_Capacity” variable that needs to be configured based on Account Subscription. If you have a Credit-based plan, please check with your account executive to determine these values for your account. Otherwise, see Administration > Account > Account Overview to see your Capacity Values.
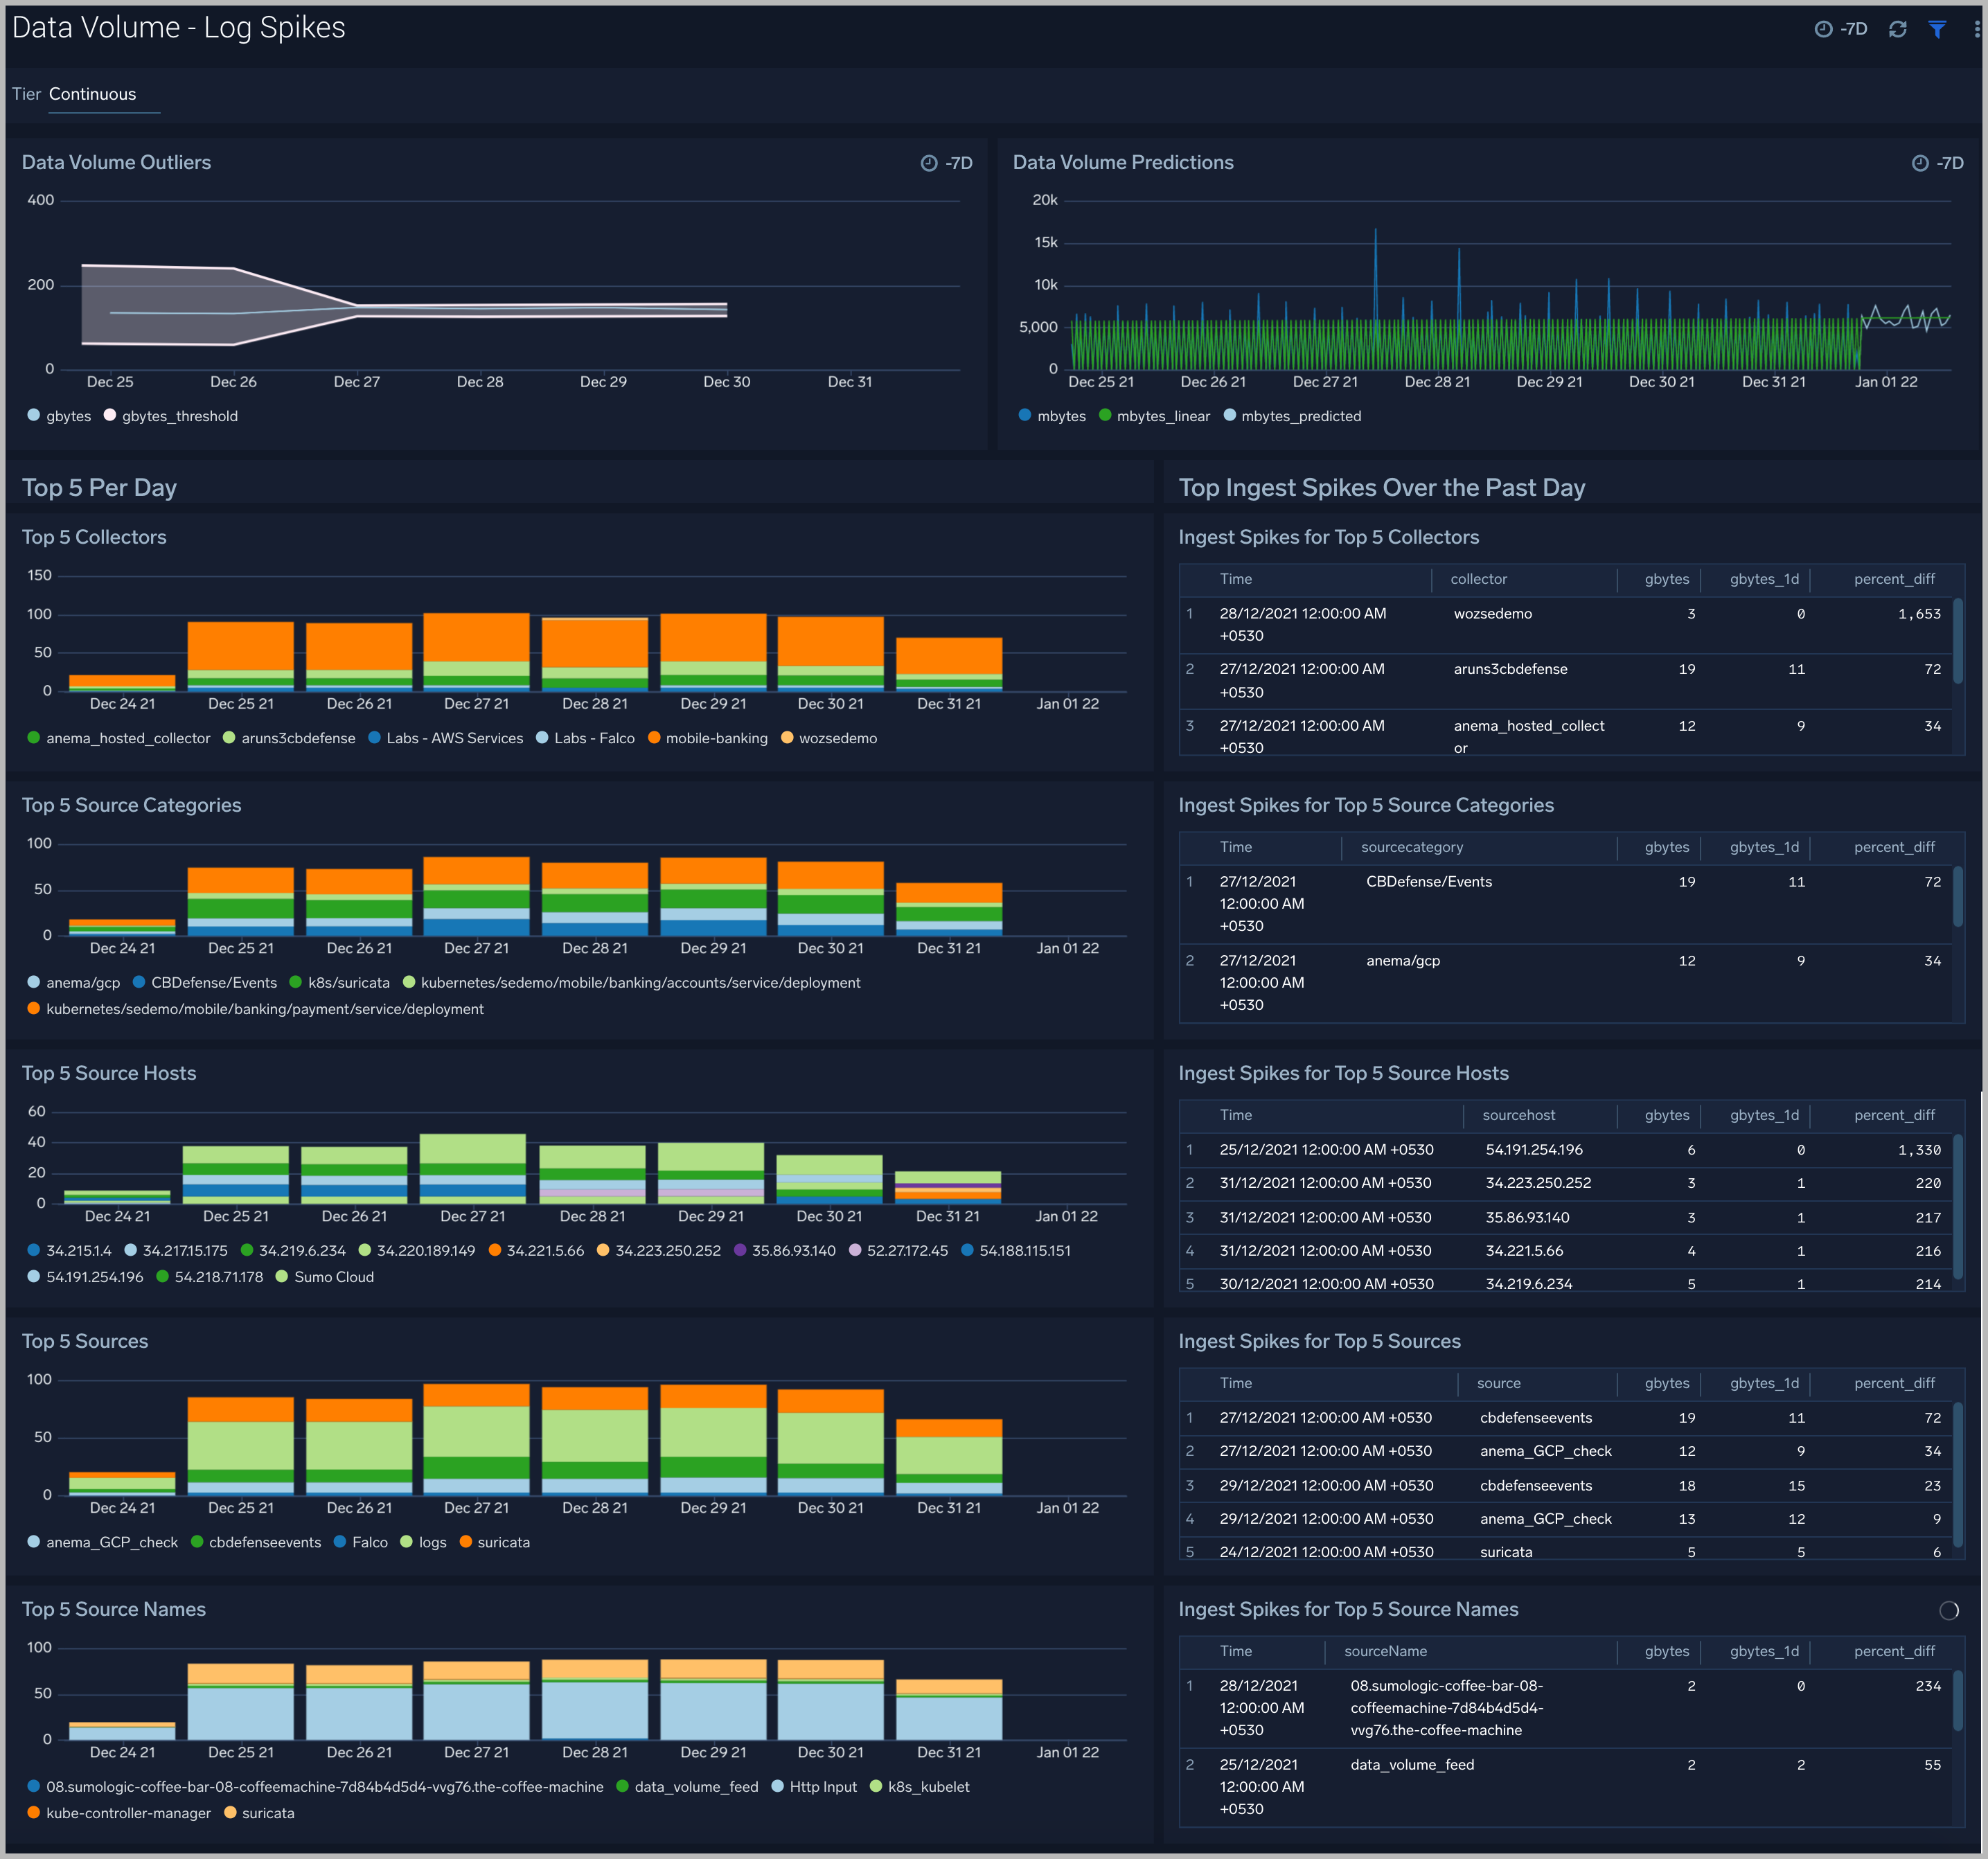
Log Spikes
The Data Volume - Log Spikes Dashboard helps you quickly identify significant increases in data ingested. Review details of your data ingested for logs.
Use this dashboard to:
- Identify ingest outliers
- Determine the spikes for top sources compared with the previous day
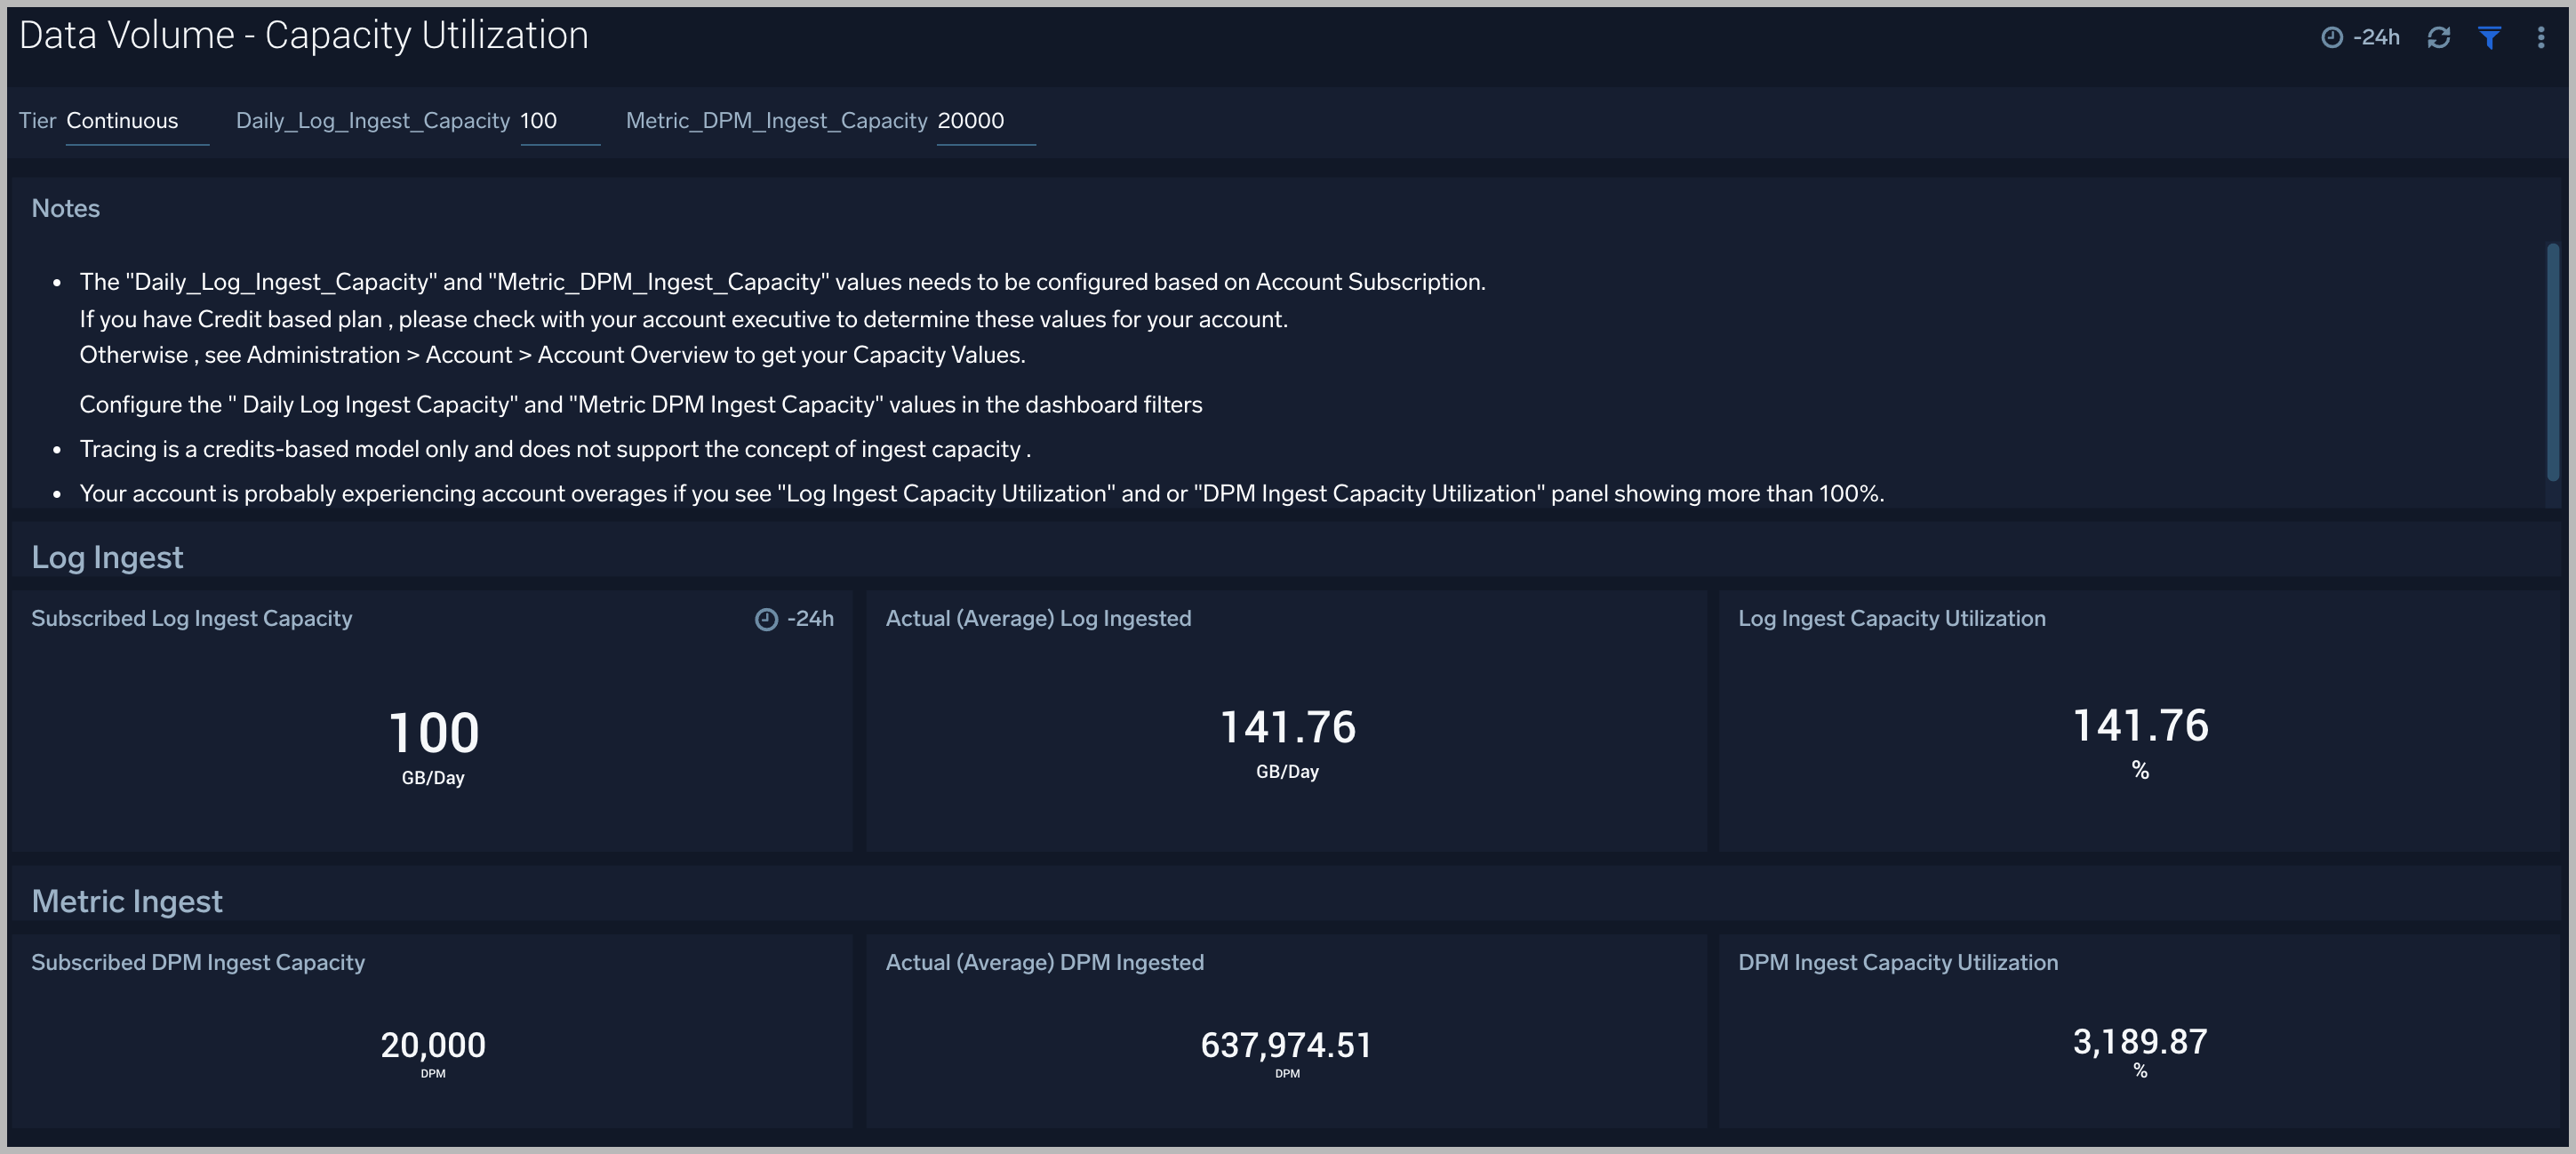
Capacity Utilization
The Data Volume - Capacity Utilization dashboard provides views of subscribed, actual, and percentage capacity utilization for logs and metrics.
Use this dashboard to:
- Identify the log and metrics ingestion capacity of your subscription. You must configure the "Daily_Log_Ingest_Capacity" and “Metric_DPM_Ingest_Capacity” variables based on your plan with Sumo Logic. If you have a Credit-based plan, please check with your account executive to determine these values for your account. Otherwise, see Administration > Account > Account Overview to view the log ingest capacity value and metric DPM ingest capacity value.
- Identify the average ingestion and subscribed ingestion capacity by percentage for logs and metrics.
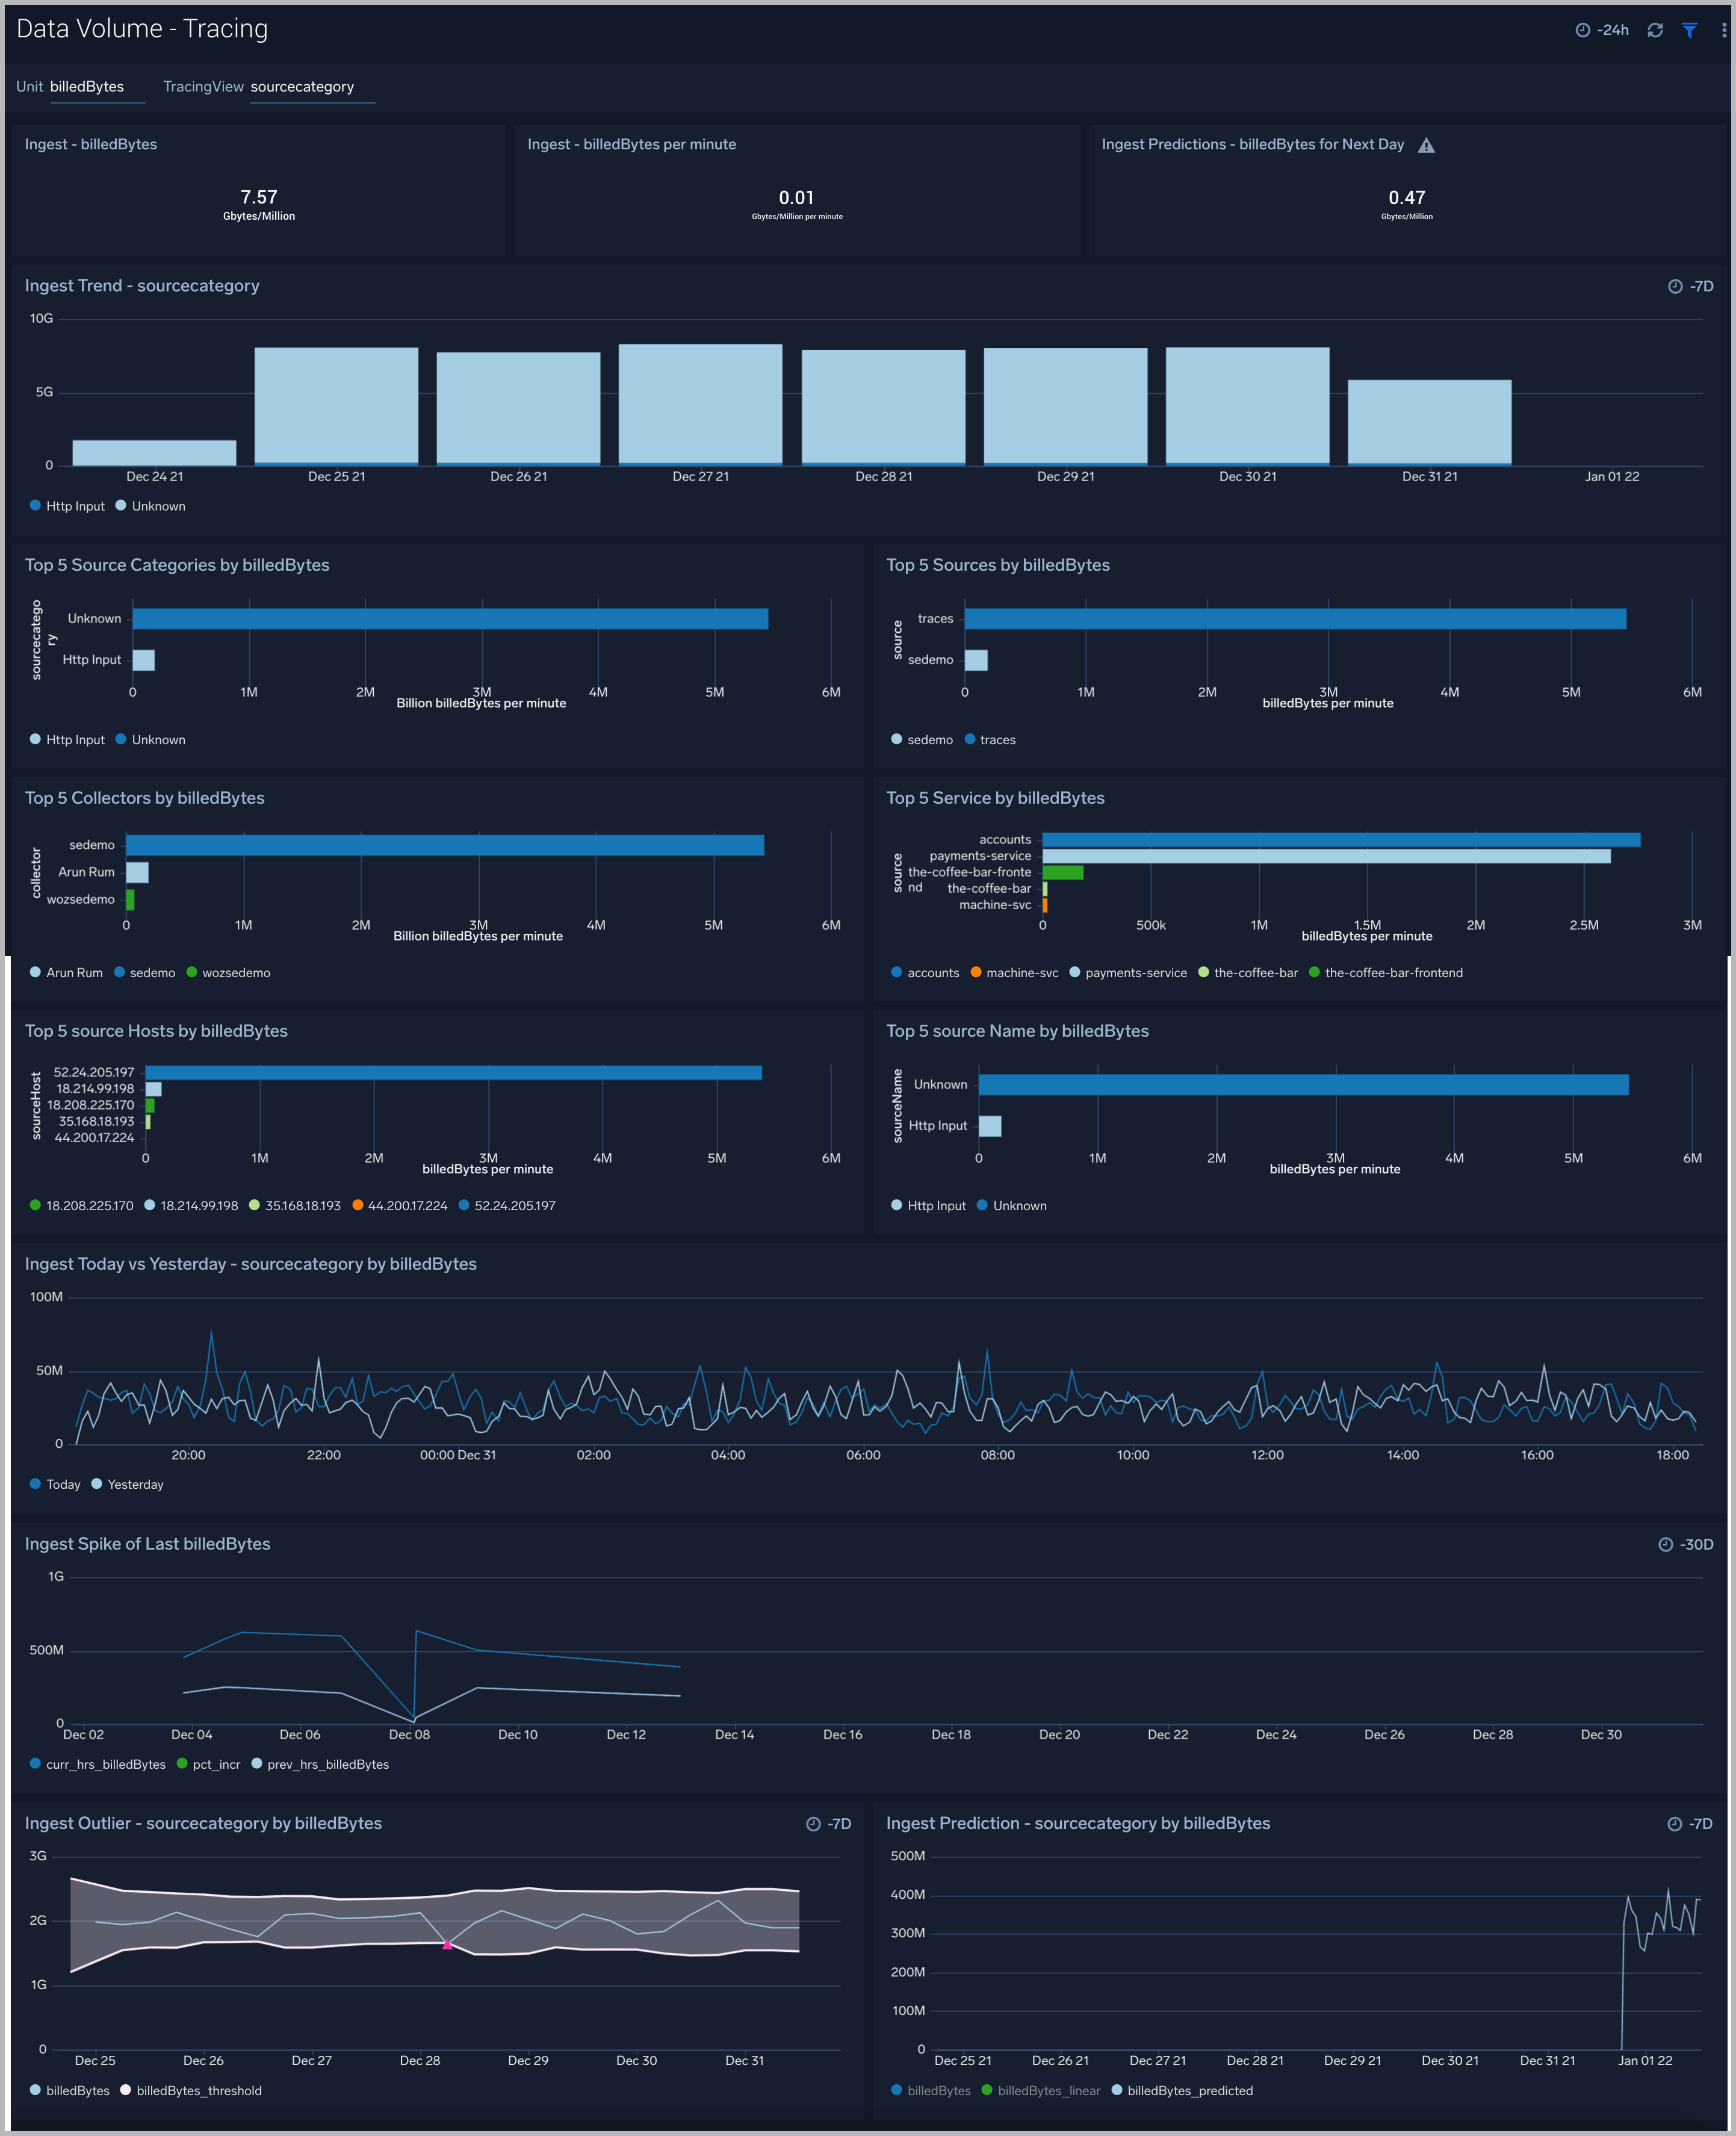
Tracing
The Data Volume - Tracing dashboard provides views of your Tracing data ingest by billed bytes and span counts per minute.
Use this dashboard to:
- Determine the ingested billedBytes/spansCount for tracing and examine trends over time.
- Identify spikes in ingestion, where ingestion for the current hour is above by 50% from the last hour.
- Identify the outliers (and forecast your data ingestion).
- Identify the top 5 source categories, source hosts, sources, and collectors by span count and billed bytes.
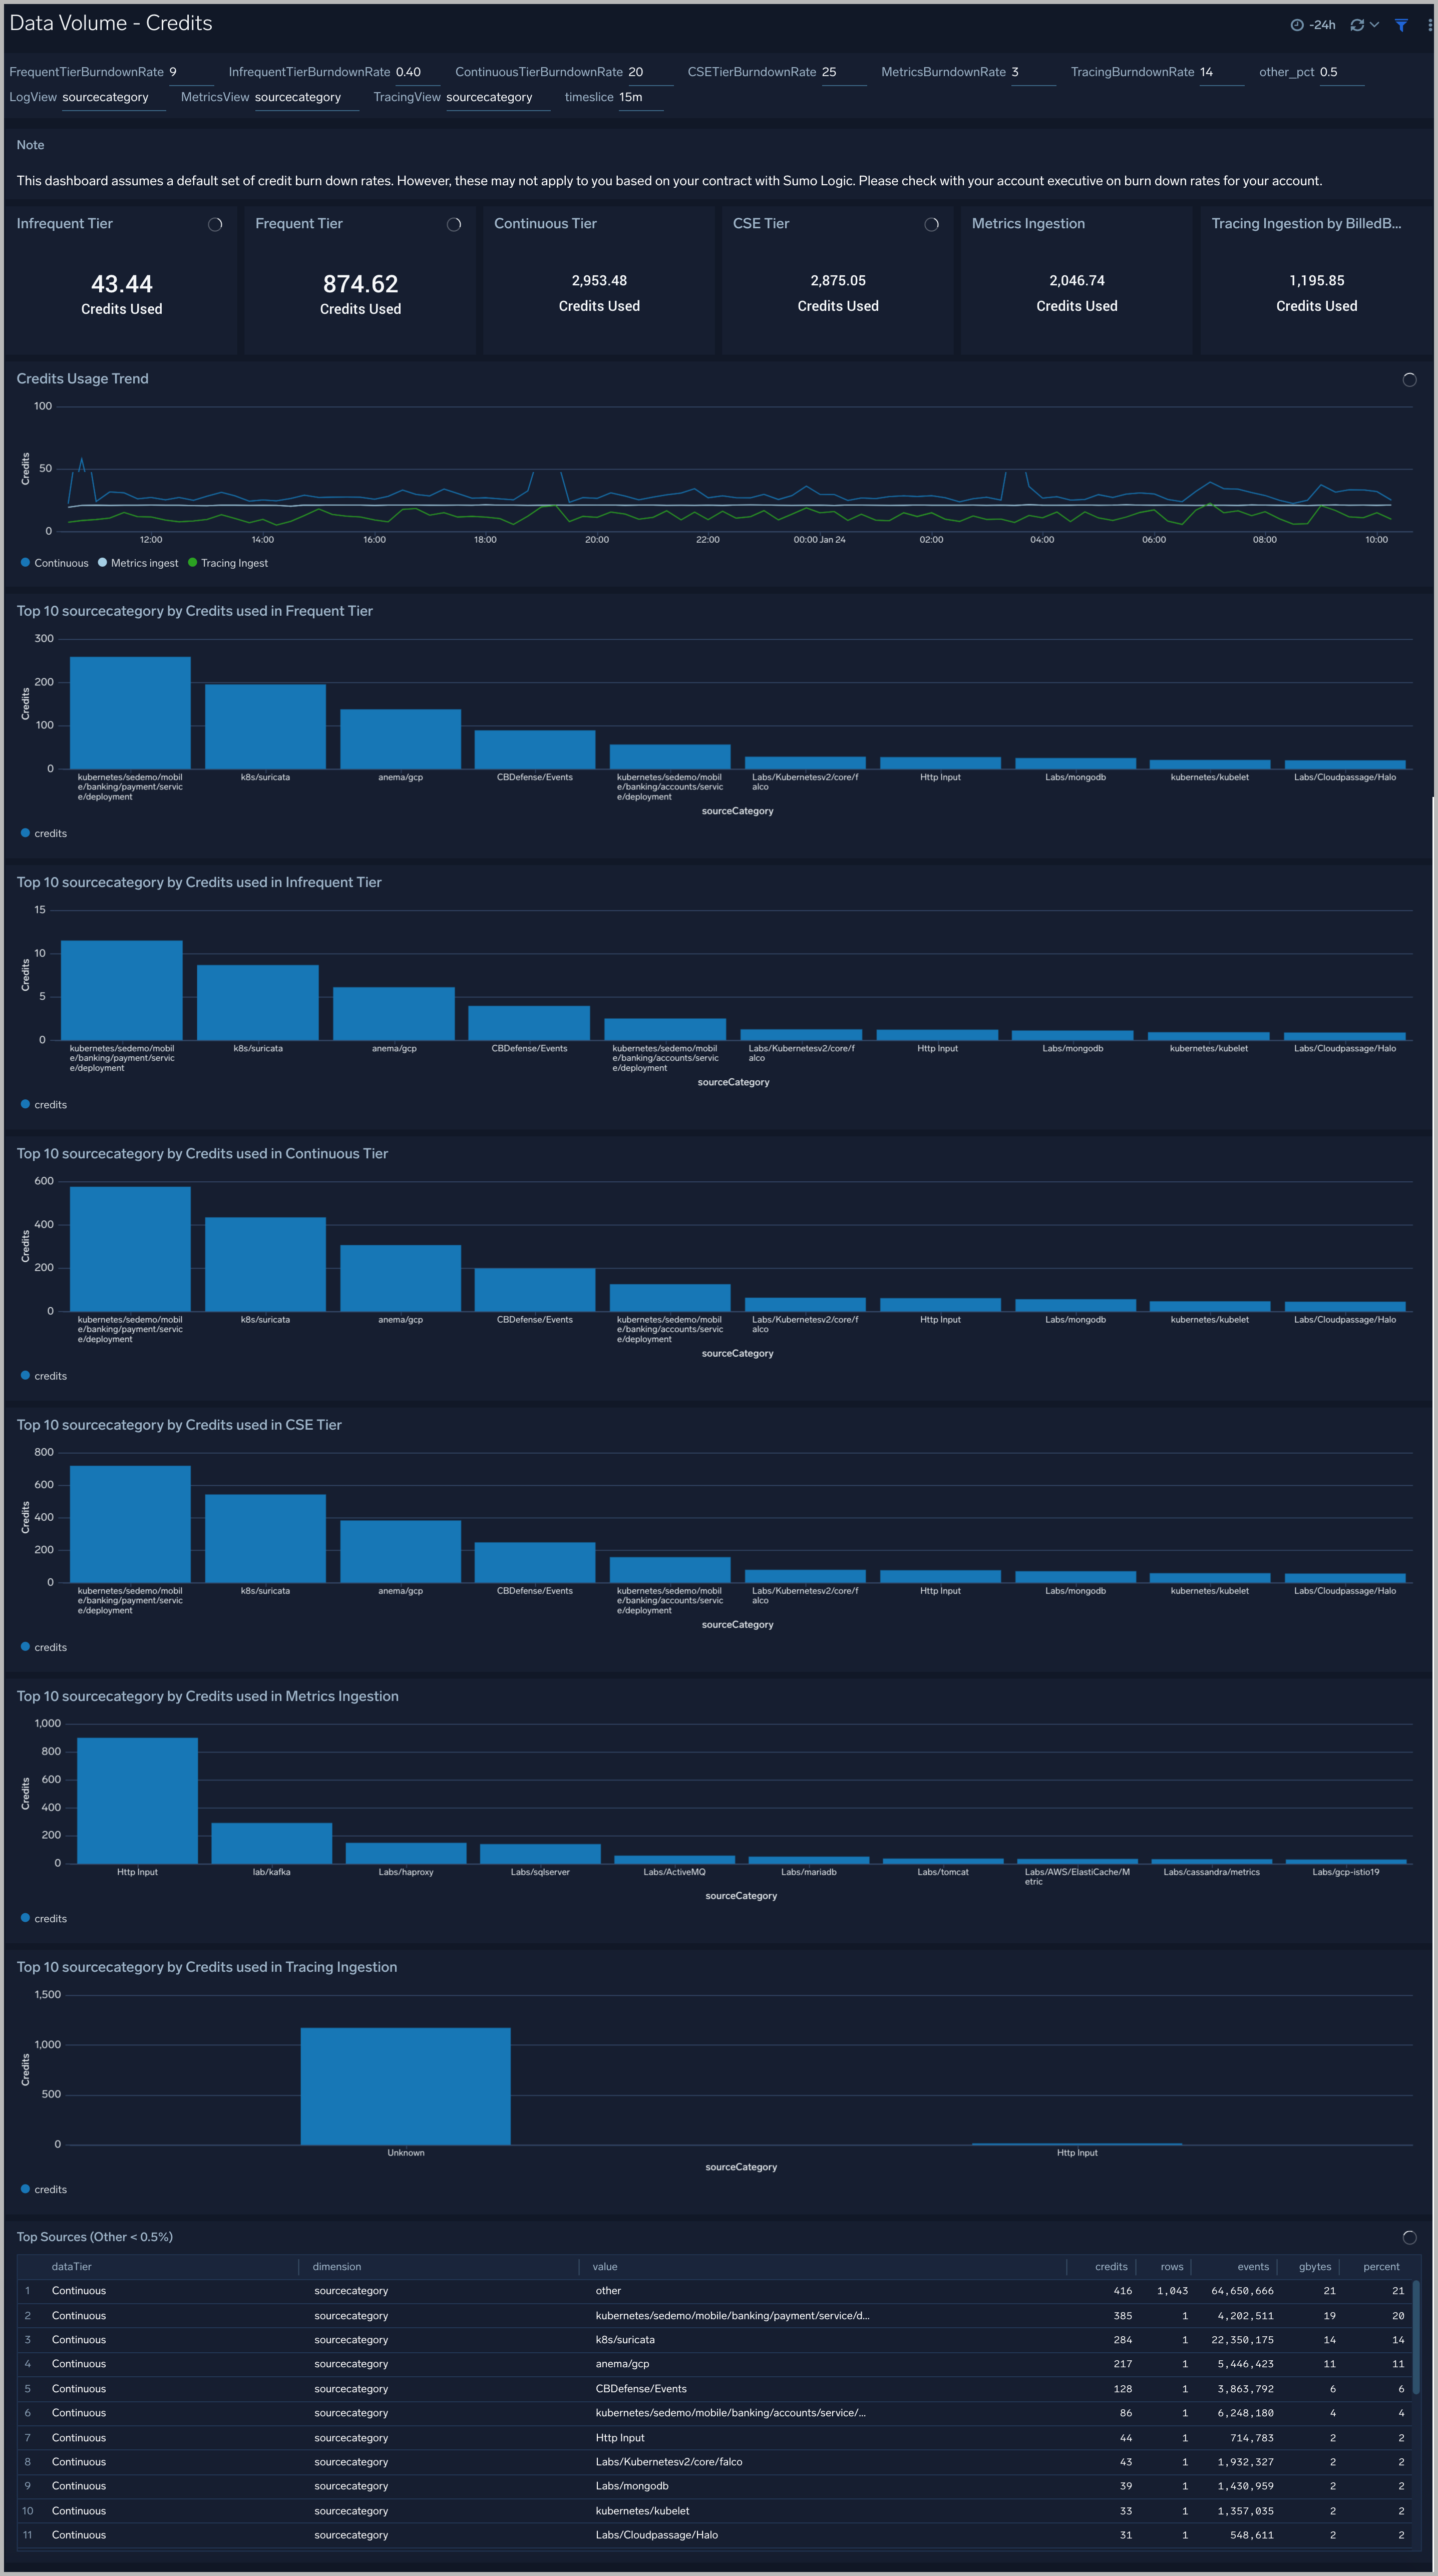
Credits
The Data Volume - Credits Dashboard helps you understand how your credits are being used across Logs, Metrics, Traces, and data tiers.
Use this dashboard to:
- Identify the number of credits consumed and trends across Logs (by different tiers), Metrics, Tracing.
- Determine the top sources based on their credit usage for Logs (by different tiers), Metrics, and Tracing.