PCI Compliance for Palo Alto Networks 9
The Sumo Logic App for Payment Card Industry (PCI) Compliance for Palo Alto Networks offers dashboards to monitor firewall traffic activity for compliance with PCI requirements 01, 02, and 04.
Log Types
| Log type | Description | Supported log format | For more information |
| Traffic | Entries for the start and end of each session, including date and time; source and destination zones, addresses and ports; application name; security rule applied to the traffic flow; rule action (allow, deny, or drop); ingress and egress interface; number of bytes; and session end reason. | Syslog | Traffic Logs |
Collecting Logs for PCI Compliance for Palo Alto Networks 9
This section has instructions for collecting logs for the PCI Compliance for Palo Alto Networks 9 app. This app supports Palo Alto Networks v9 and v8.
Step 1. Create a hosted collector and Cloud Syslog source
In this step you configure a hosted collector with a Cloud Syslog source that will act as Syslog server to receive logs and events from Palo Alto Networks devices.
To configure a hosted collector with a Cloud Syslog source, do the following:
- Log in to Sumo Logic and create a Hosted Collector.
- Create a Cloud Syslog Source on the hosted collector, specifying the following:
- Enter a Source Name.
- Provide a Source Category: NW/PAN/V9
- Click Save.
- Copy the Token, host URL and TCP TLS Port to a safe place. You will need this information in the tasks that follow.
Step 2. Define the destination for the logs
In this step you create a server profile where you can define the log destination. This will be the host name, port and protocol (TLS) of the Sumo Logic Cloud Syslog source.
To create a server profile specifying the log destination, do the following:
- Login to the Palo Alto Networks Web interface as an administrative user.
- Select Device tab > Server Profiles > Syslog.
- Click Add at the bottom of the screen and provide endpoint details and a profile name, such as Sumo_Logs_Profile01.
- In the Syslog Server Profile window, select the Servers tab and click Add.
- In the Servers window, specify the following information:
- In the Syslog Server Profile window, select the Custom Log Format tab, and use the following custom format for the following log type:
,$receive_time,$serial,$type,$subtype,,$time_generated,$src,$dst,$natsrc,$natdst,$rule,$srcuser,$dstuser,$app,$vsys,$from,$to,$inbound_if,$outbound_if,$logset,,$sessionid,$repeatcnt,$sport,$dport,$natsport,$natdport,$flags,$proto,$action,$bytes,$bytes_sent,$bytes_received,$packets,$start,$sec,$category,,$seqno,$actionflags,$srcloc,$dstloc,,$pkts_sent,$pkts_received,$session_end_reason,$dg_hier_level_1,$dg_hier_level_2,$dg_hier_level_3,$dg_hier_level_4,$vsys_name,$device_name,$action_source,$src_uuid,$dst_uuid,$tunnelid/$imsi,$monitortag/$imei,$parent_session_id,$parent_start_time,$tunnel,$assoc_id,$chunks,$chunks_sent,$chunks_received,$rule_uuid,$http2_connection <Token from [Step 1](#Step_1._Create_a_hosted_collector_and_Cloud_Syslog_source)>,$receive_time,$serial,$type,$subtype,,$time_generated,$src,$dst,$natsrc,$natdst,$rule,$srcuser,$dstuser,$app,$vsys,$from,$to,$inbound_if,$outbound_if,$logset,,$sessionid,$repeatcnt,$sport,$dport,$natsport,$natdport,$flags,$proto,$action,$misc,$threatid,$category,$severity,$direction,$seqno,$actionflags,$srcloc,$dstloc,,$contenttype,$pcap_id,$filedigest,$cloud,$url_idx,$user_agent,$filetype,$xff,$referer,$sender,$subject,$recipient,$reportid,$dg_hier_level_1,$dg_hier_level_2,$dg_hier_level_3,$dg_hier_level_4,$vsys_name,$device_name,,$src_uuid,$dst_uuid,$http_method,$tunnel_id/$imsi,$monitortag/$imei,$parent_session_id,$parent_start_time,$tunnel,$thr_category,$contentver,,$assoc_id,$ppid,$http_headers,$url_category_list,$rule_uuid,$http2_connection <strong><em><Token from [Step 1](#Step_1._Create_a_hosted_collector_and_Cloud_Syslog_source)> - Click OK.
- Commit the changes.
Sample Log messages
Sep 05 12:45:15 SumoStg05 0,2018/09/05 12:45:15,012345678901,TRAFFIC,end,0,2018/09/05 12:45:15,182.80.119.50,176.164.175.181,,,Unexpected Traffic,,npande,ping,vsys3,z1-FW-Transit,z3-Sumo-DMZ,ethernet1/2,ethernet1/2,LOGreset-both,2018/09/05 12:45:15,9434,1,0,0,0,0,0x100064,icmp,allow,122,122,0,1,2018/09/05 12:45:15,0,any,0,5134220147,0x8000000000000000,United States,10.0.0.0-10.255.255.255,0,1,0,aged-out,31,42,0,0,,SumoStg05,from-policy,,,0,,0,,N/A
786 <10>1 2022-03-29T22:32:26+00:00 PA-VM.demo.bkacad.cf - - - - ,2022/03/29*22:32:26,164859314646745,THREAT,vulnerability,,2022/03/29*22:32:26,156.194.158.165,156.194.158.165,156.194.158.165,156.194.158.165,test-threat,,,unknown-udp,vsys1,Outside,Outside,ethernet1/1,ethernet1/1,Forward-Sumo,,8660,1,47495,9034,0,0,0x2000,udp,drop,,Realtek Jungle SDK Remote Code Execution Vulnerability(91535),any,critical,client-to-server,1648593146467628956,0x0,Korea Republic Of,156.194.158.165-156.194.158.165,,,0,,,0,,,,,,,,0,0,0,0,0,,PA-VM,,,,,N/A_id/0,/,0,,N/A,code-execution,AppThreat-8468-6979,,0,1648593146,,,141fd502-fc32-4867-b9a5-5c421583a44b,0,,,,,,,,,,,,,,, ,,,,,,,,,,,,,,0,2022-03-29T22:32:26.467+00:00,,,,unknown,unknown,unknown,1,,,no,no /
Sample Query
Example query from the Accepted and Rejected Traffic dashboard > Denied Traffic Over Time panel.
_sourceCategory=Loggen/PAN/Traffic TRAFFIC deny
| csv _raw extract 1 as f1, 2 as Receive_Time, 3 as serialNum, 4 as type, 5 as subtype, 6 as f2, 7 as LogGenerationTime, 8 as src_ip, 9 as dest_ip, 10 as NAT_src_ip, 11 as NAT_dest_ip, 12 as ruleName, 13 as src_user, 14 as dest_user, 15 as app, 16 as vsys, 17 as src_zone, 18 as dest_zone, 19 as inbound_interface, 20 as outbound_interface, 21 as LogAction, 22 as f3, 23 as SessonID, 24 as RepeatCount, 25 as src_port, 26 as dest_port, 27 as NAT_src_port, 28 as NAT_dest_port, 29 as flags, 30 as protocol, 31 as action,32 as bytes, 33 as bytes_sent, 34 as bytes_recv, 35 as Packets, 36 as StartTime, 37 as ElapsedTime, 38 as Category, 39 as f4, 40 as seqNum, 41 as ActionFlags, 42 as src_Country, 43 as dest_country, 44 as pkts_sent, 45 as pkts_received, 46 as session_end_reason, 47 as Device_Group_Hierarchy , 48 as vsys_Name, 49 as DeviceName, 50 as action_source, 51 as Source_VM_UUID, 52 as Destination_VM_UUID, 53 as Tunnel_ID_IMSI, 54 as Monitor_Tag_IMEI, 55 as Parent_Session_ID, 56 as parent_start_time, 57 as Tunnel, 58 as SCTP_Association_ID, 59 as SCTP_Chunks, 60 as SCTP_Chunks_Sent, 61 as SCTP_Chunks_Received
| where type = "TRAFFIC" and action="deny"
| timeslice 5m
| count by _timeslice
Install the PCI for Palo Alto Networks 9 App
Now that you have set up collection for PCI for Palo Alto Networks install the Sumo Logic App for PCI for Palo Alto Networks to use the preconfigured searches and dashboards that provide insight into your data. This app supports PAN-OS v8 and v9.
To install the app:
Locate and install the app you need from the App Catalog. If you want to see a preview of the dashboards included with the app before installing, click Preview Dashboards.
- From the App Catalog, search for and select the app.
- Select the version of the service you're using and click Add to Library. Version selection is applicable only to a few apps currently. For more information, see Installing the Apps from the Library.
- To install the app, complete the following fields.
- App Name. You can retain the existing name, or enter a name of your choice for the app.
- Data Source. Select either of these options for the data source.
- Choose Source Category, and select a source category from the list.
- Choose Enter a Custom Data Filter, and enter a custom source category beginning with an underscore. Example: (
_sourceCategory=MyCategory).
- Advanced. Select the Location in Library (the default is the Personal folder in the library), or click New Folder to add a new folder.
- Click Add to Library.
Once an app is installed, it will appear in your Personal folder, or other folder that you specified. From here, you can share it with your organization.
Panels will start to fill automatically. It's important to note that each panel slowly fills with data matching the time range query and received since the panel was created. Results won't immediately be available, but with a bit of time, you'll see full graphs and maps.
Viewing PCI for Palo Alto Networks 9 Dashboards
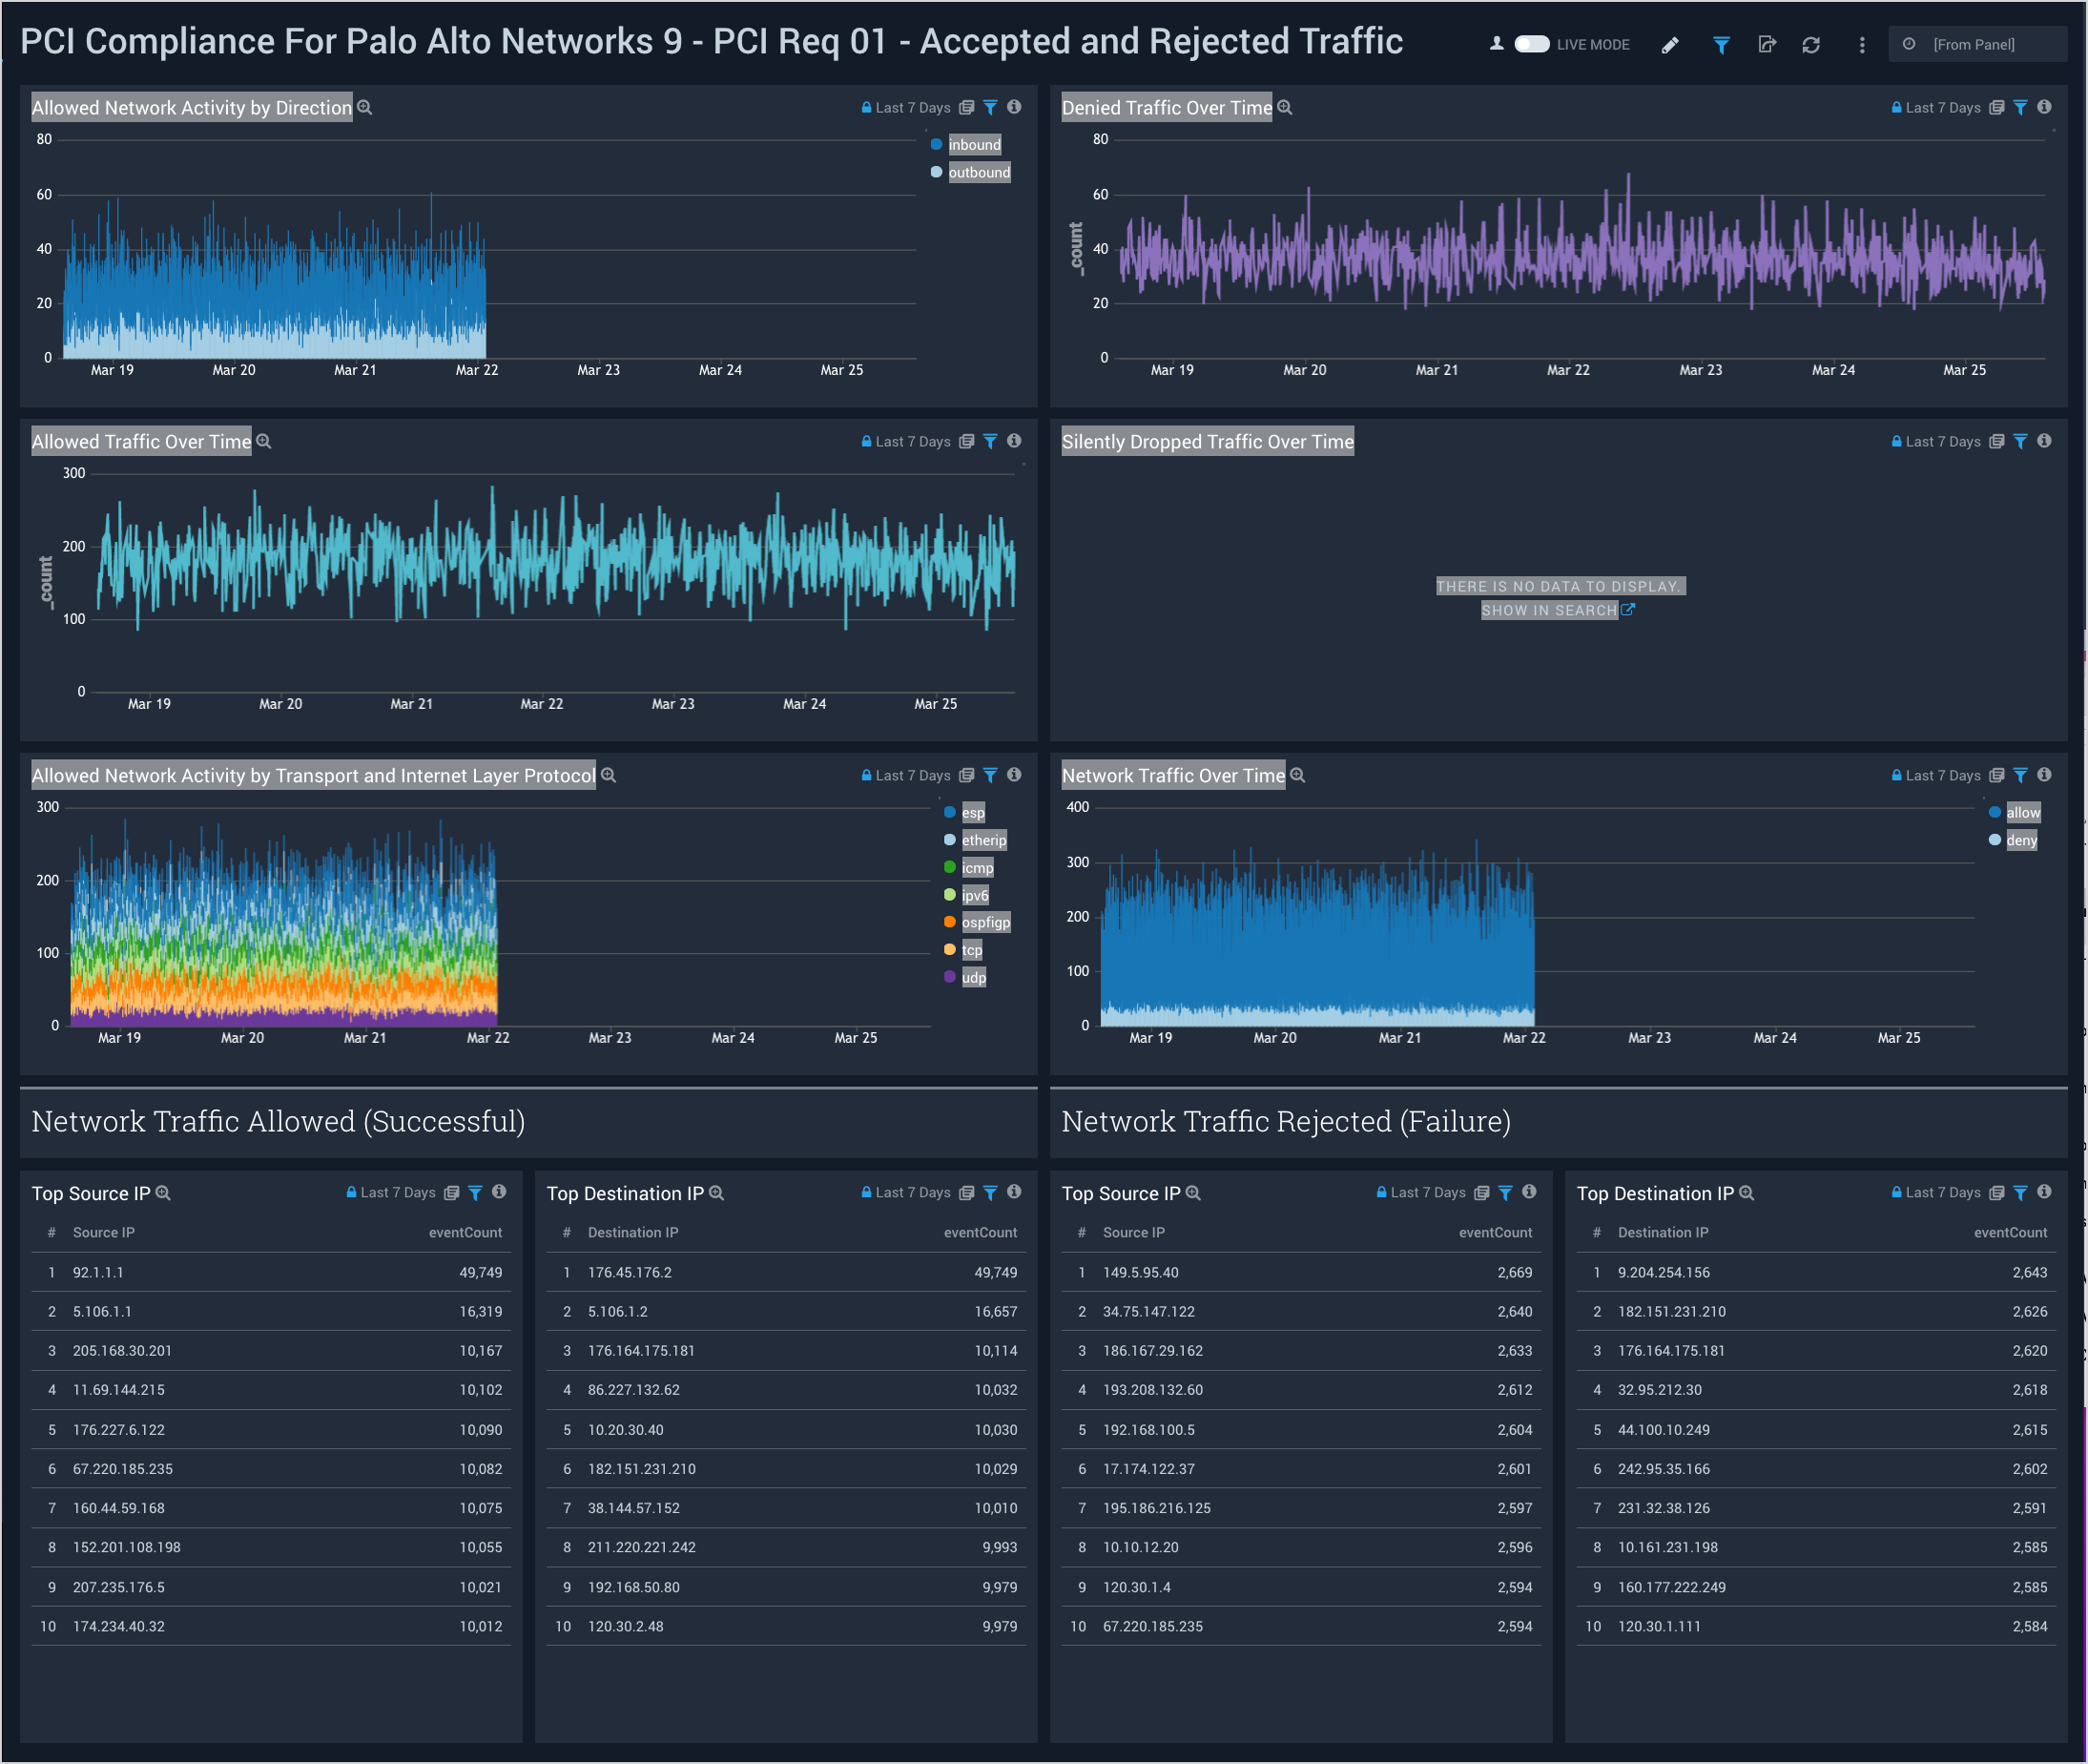
PCI Req 01 - Accepted and Rejected Traffic
Dashboard description: See analytics about accepted and rejected firewall traffic, including information about traffic direction; allowed, denied, and silently dropped traffic over time; and the top source and destination IPs for allowed and rejected traffic.
Use case: You can use this dashboard to monitor allowed and rejected traffic in accordance with PCI requirement 1. The dashboard helps you identify systems accepting or rejecting traffic, and identify inbound and outbound network connections trends.
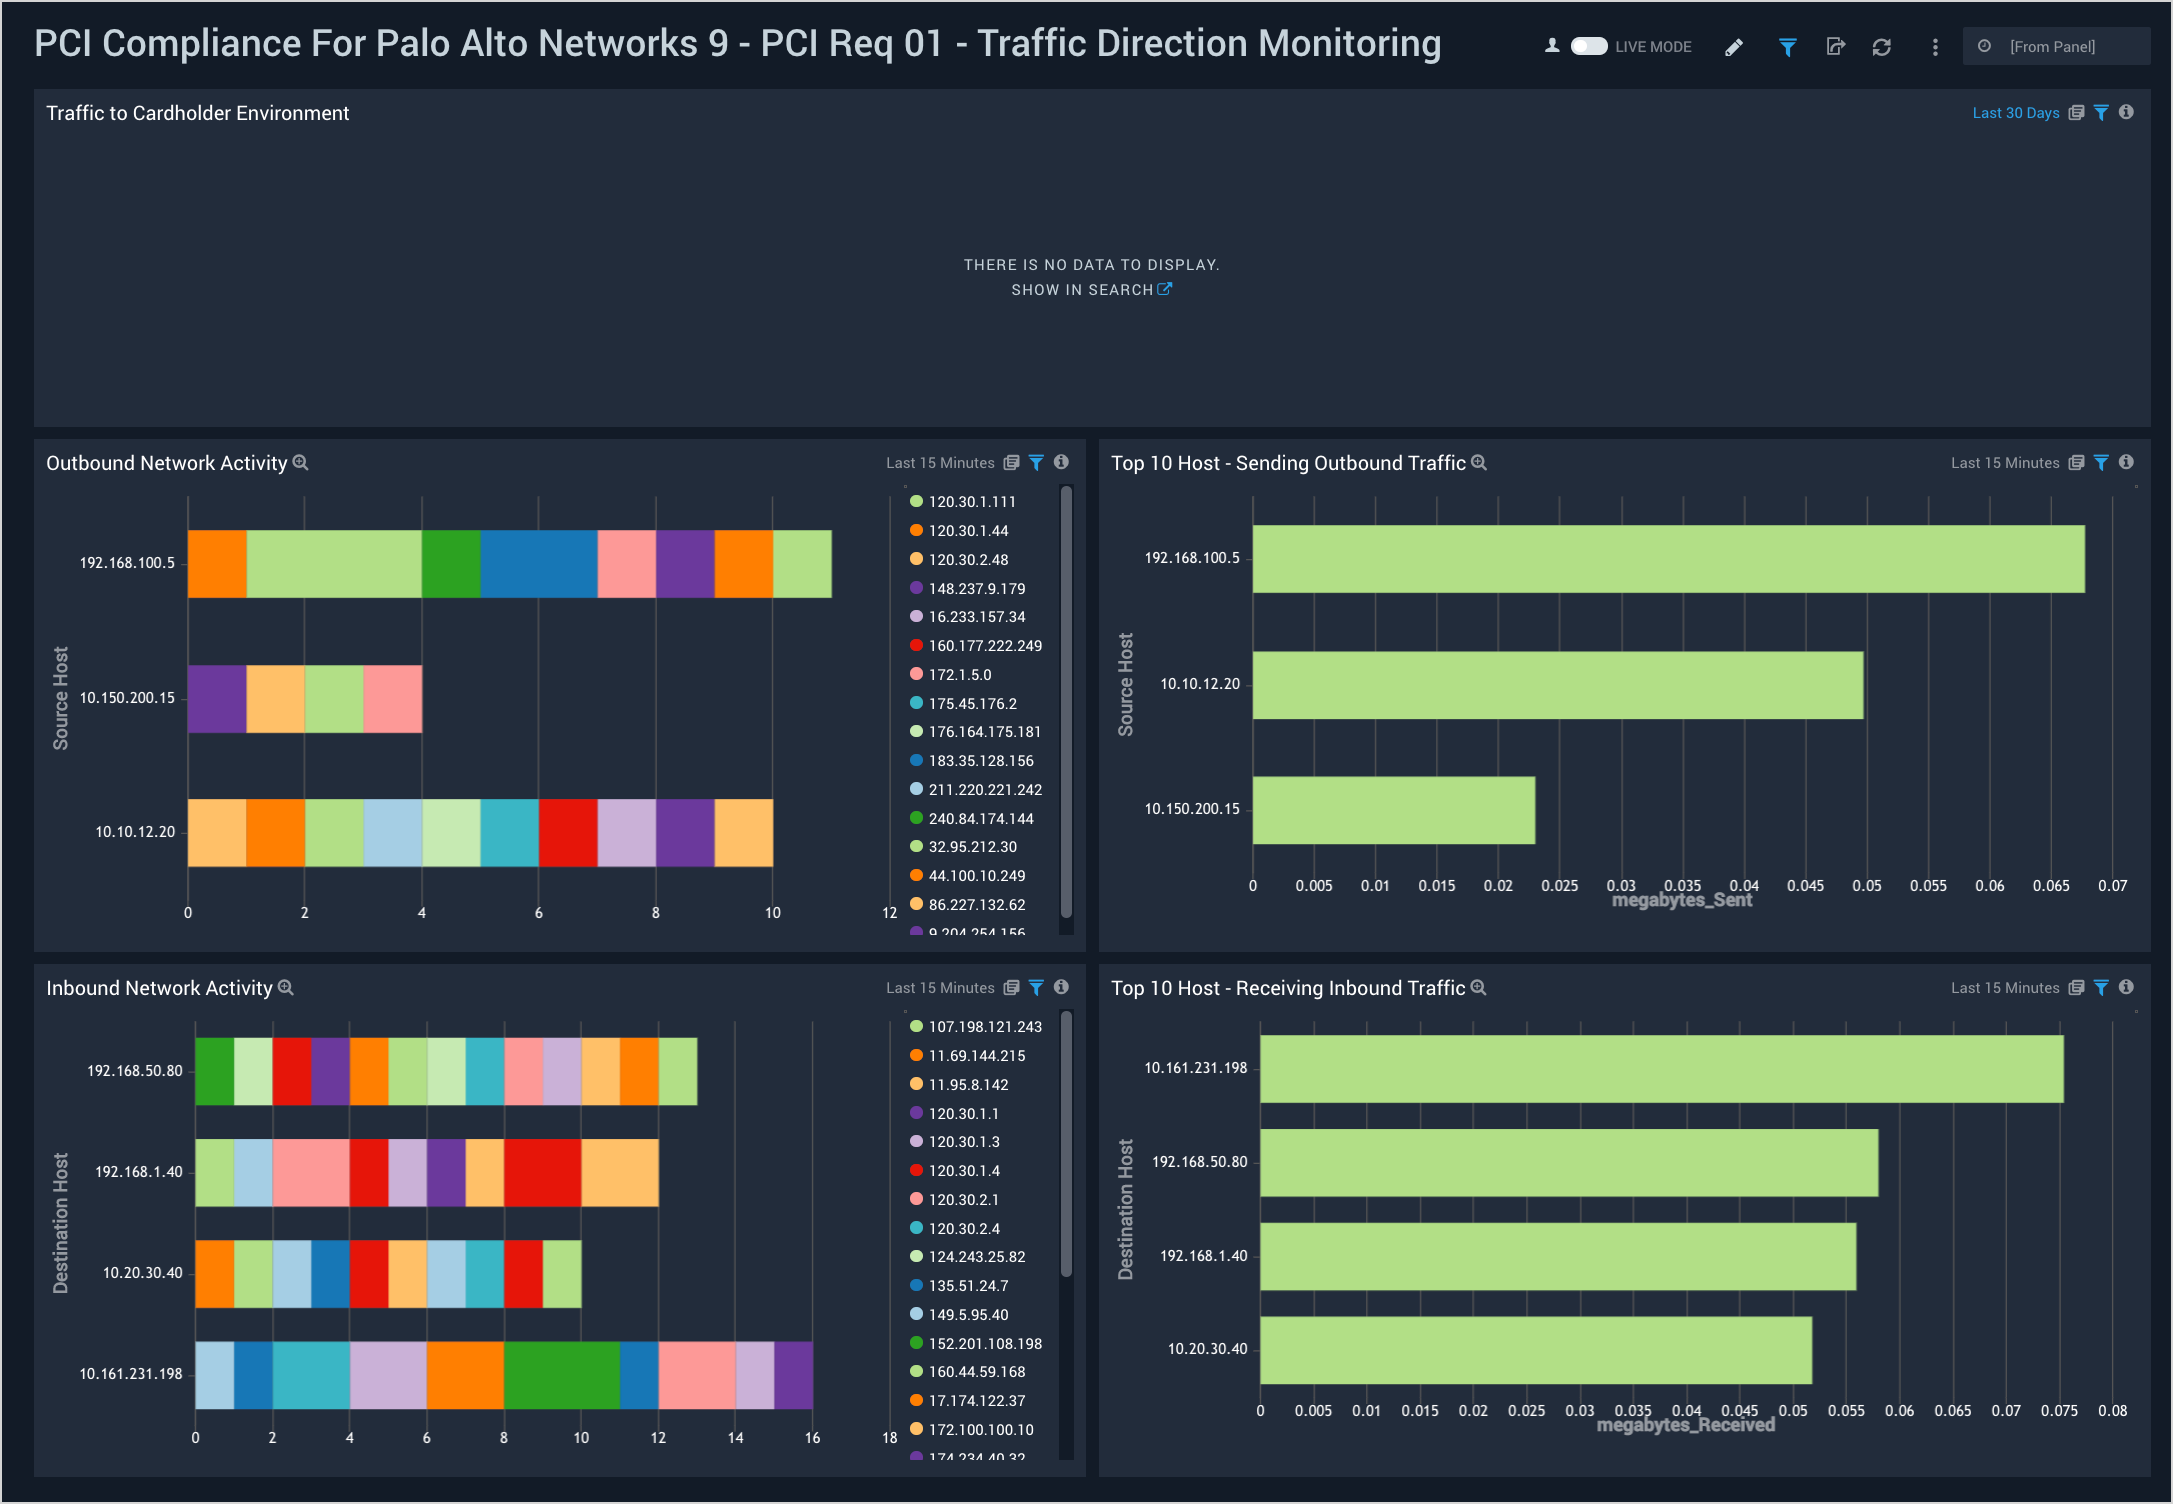
PCI Req 01 - Traffic Direction Monitoring
Dashboard description: View information about inbound and outbound traffic, including traffic to the cardholder data environment (CDE); details of inbound and outbound traffic; the top 10 hosts sending traffic; and the top 10 hosts receiving traffic.
Use case: You can use this dashboard to monitor connections made from external IPs to internal IPs. You can identify top internal IPs receiving traffic from external IPs or sending traffic to external IPs. Similarly, this dashboard helps you identify the amount of traffic generated by different IPs crossing your organization's network boundary.
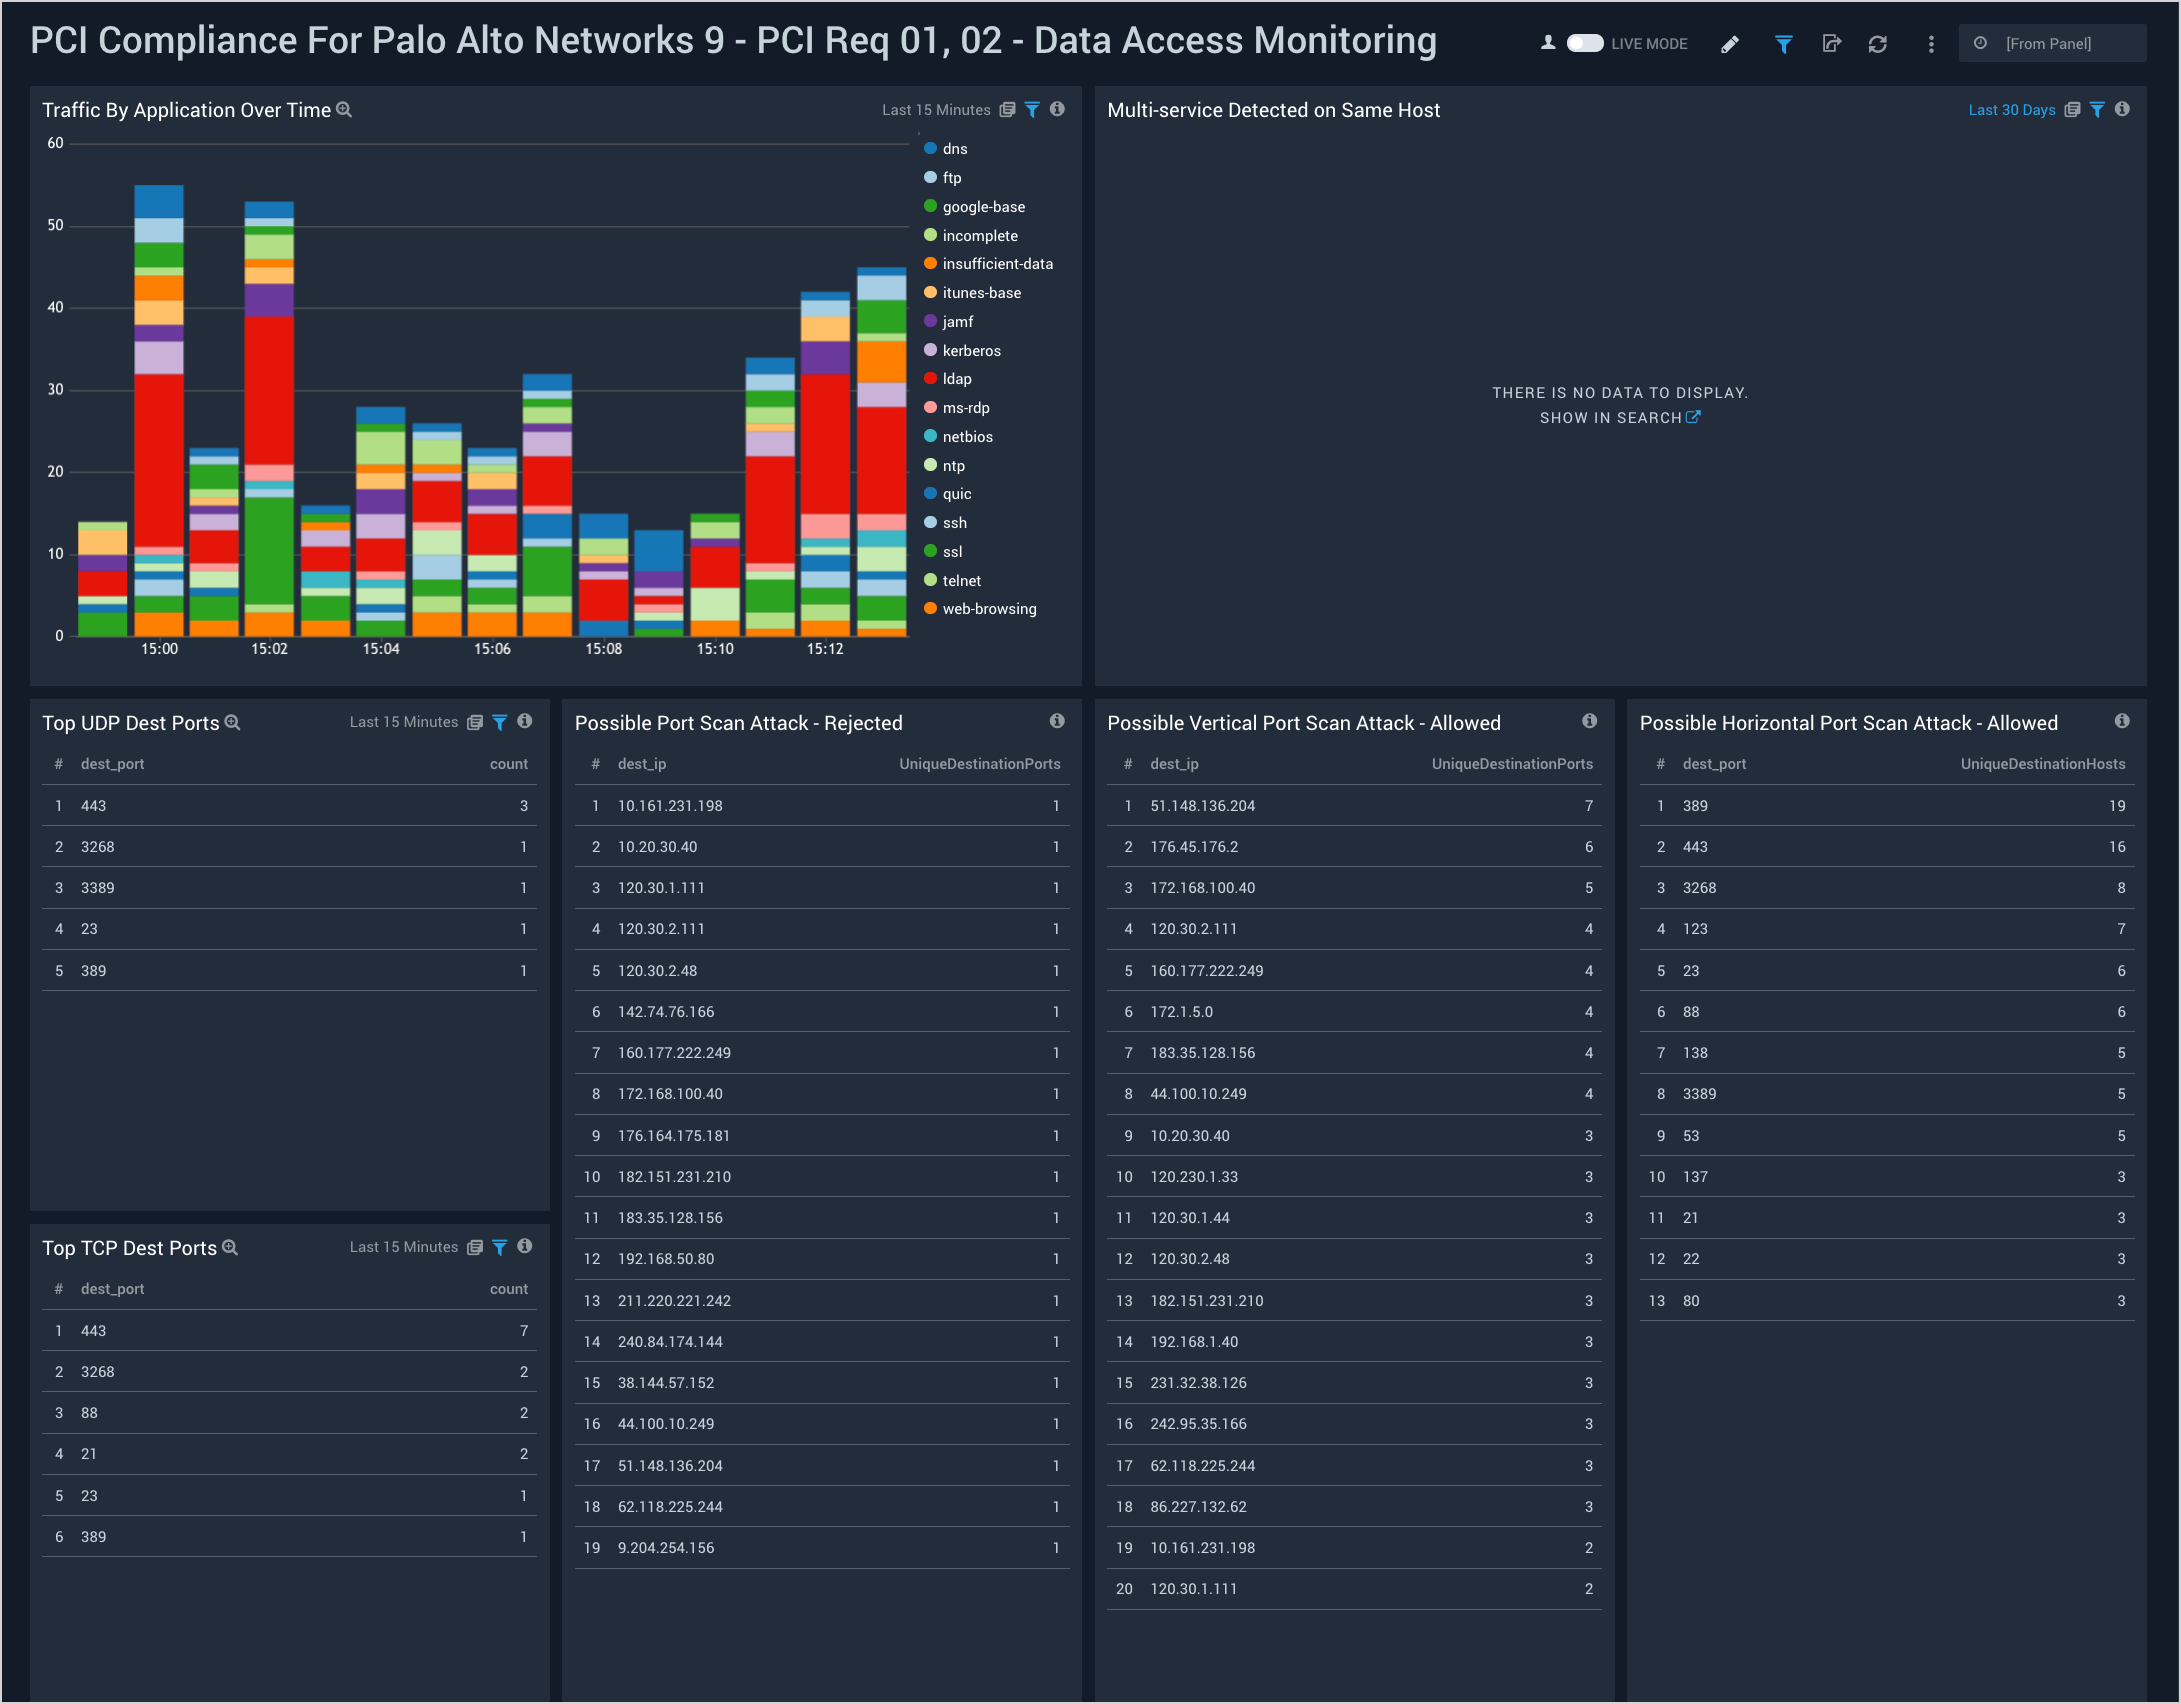
PCI Req 01, 02 - Data Access Monitoring
Dashboard description: See information about accepted network traffic by application; top TCP and UDP source and destination ports; multi-services detected on the same host; and information about possible port scan attacks, both allowed and rejected.
Use case: You can use this dashboard to monitor activities on ports, apps being used, and the protocols used to access apps. The panels help you identify possible port scan attacks, both horizontal and vertical. You can also identify if there are systems on which multiple services are executing.
PCI Req 02, 04 - Insecure Data In Transit
Dashboard description: See analytics about insecure data in transit data, including data transmissions to or from the cardholder data environment (CDE) using an insecure protocol; breakdowns of which apps, hosts, and ports were involved with insecure traffic.
Use case: You can use this dashboard to identify systems and hosts involved in insecure data transit. You can identify insecure connections and port protocols like ftp, telnet, http, rlogin, and so on. You can also identify successful and rejected network connections for insecure connections.