JFrog Artifactory - OpenTelemetry Collector

The Sumo Logic App for Artifactory provides insight into your JFrog Artifactory binary repository. The App provides preconfigured Dashboards that include an Overview of your system, Traffic, Requests and Access, Download Activity, Cache Deployment Activity, and Non-Cached Deployment Activity. Artifactory logs are sent to Sumo Logic through OpenTelemetry filelog receiver.
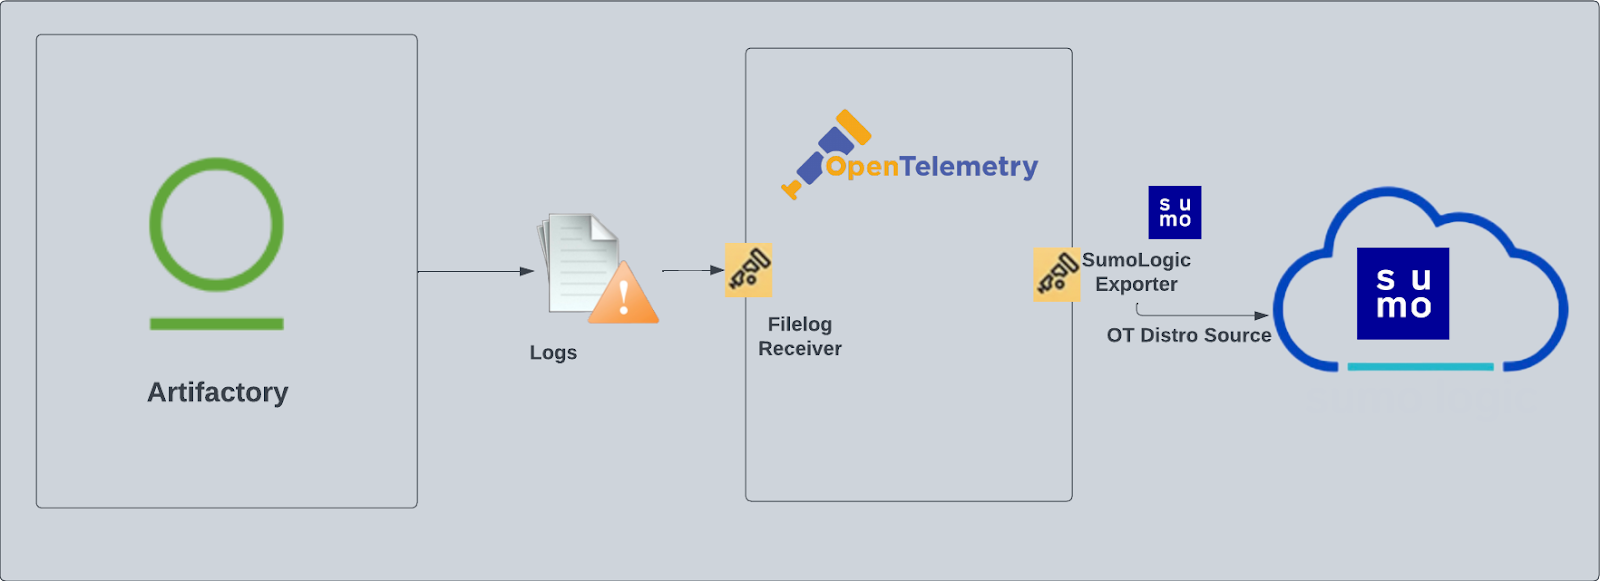
Fields creation in Sumo Logic for Artifactory
Following are the Tags which will be created as part of Artifactory App install if not already present.
sumo.datasource. Has fixed value of artifactory
Prerequisites
This section provides instructions for configuring log collection for Artifactory for the Sumo Logic App.
The Sumo Logic App for Artifactory collects data from the following logs:
artifactory.log. The main Artifactory log file that contains data on Artifactory server activity.access.log. The security log containing important information about accepted and denied requests, configuration changes, and password reset requests. The originating IP address for each event is also recorded.request.log. Generic HTTP traffic information similar to the Apache HTTPd request log.traffic.log. A log that contains information about site traffic and file sizes.
For more details about Artifactory logs, refer to JFrog Logging and Artifactory Log Files.
Sumo Logic reads logs in the directory /var/opt/jfrog/artifactory/logs:
artifactory.logaccess.logrequest.logtraffic.*.log
To activate the traffic.log file, add the following parameter to your artifactory.system.properties file, located under $ARTIFACTORY/etc:
artifactory.traffic.collectionActive=true
A restart is required for traffic collection to take effect.
Collection Configuration and App installation
As part of data collection setup and app installation, you can select the App from App Catalog and click on Install App. Follow the steps below.
Step 1: Set up Collector
If you want to use an existing OpenTelemetry Collector, you can skip this step by selecting the Use an existing Collector option.
To create a new Collector:
- Select the Add a new Collector option.
- Select the platform where you want to install the Sumo Logic OpenTelemetry Collector.
This will generate a command that you can execute in the machine environment you need to monitor. Once executed, it will install the Sumo Logic OpenTelemetry Collector.
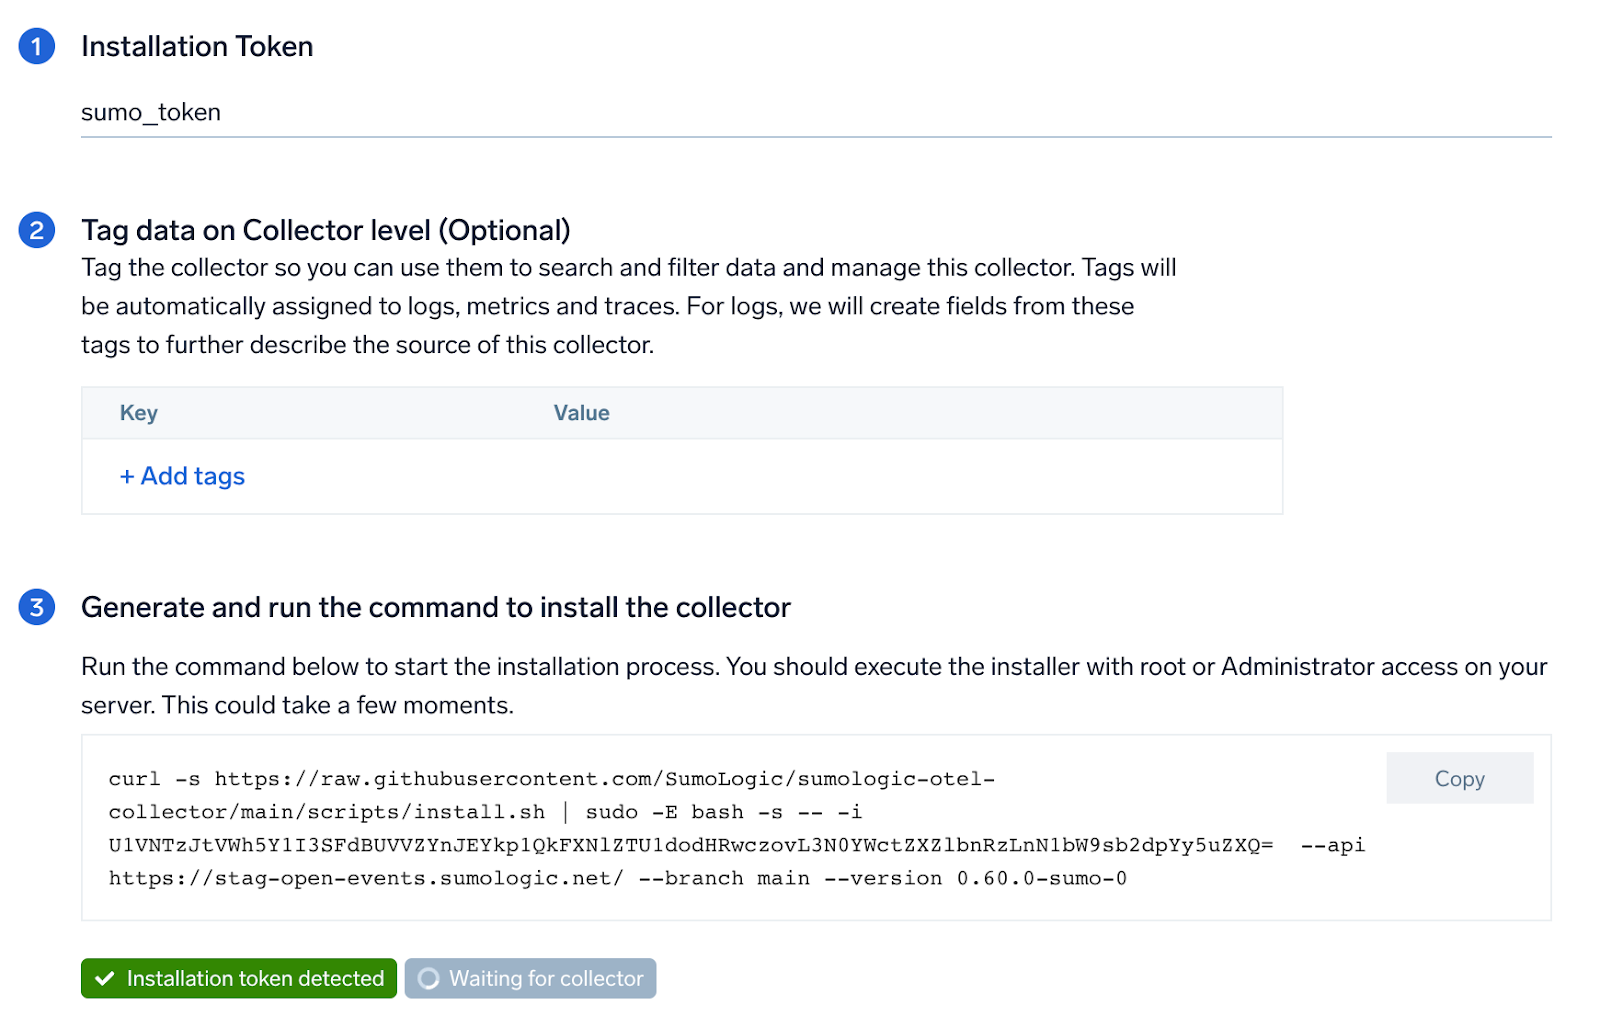
Step 2: Configure integration
In this step, you will configure the yaml required for the Artifactory Collection.
Path of the different log file configured to capture Artifactory logs is needed to be given here:
artifactory.logaccess.logrequest.logtraffic.*.log
You can add any custom fields which you want to tag along with the data ingested in sumo.
Click on the Download YAML File button to get the yaml file.
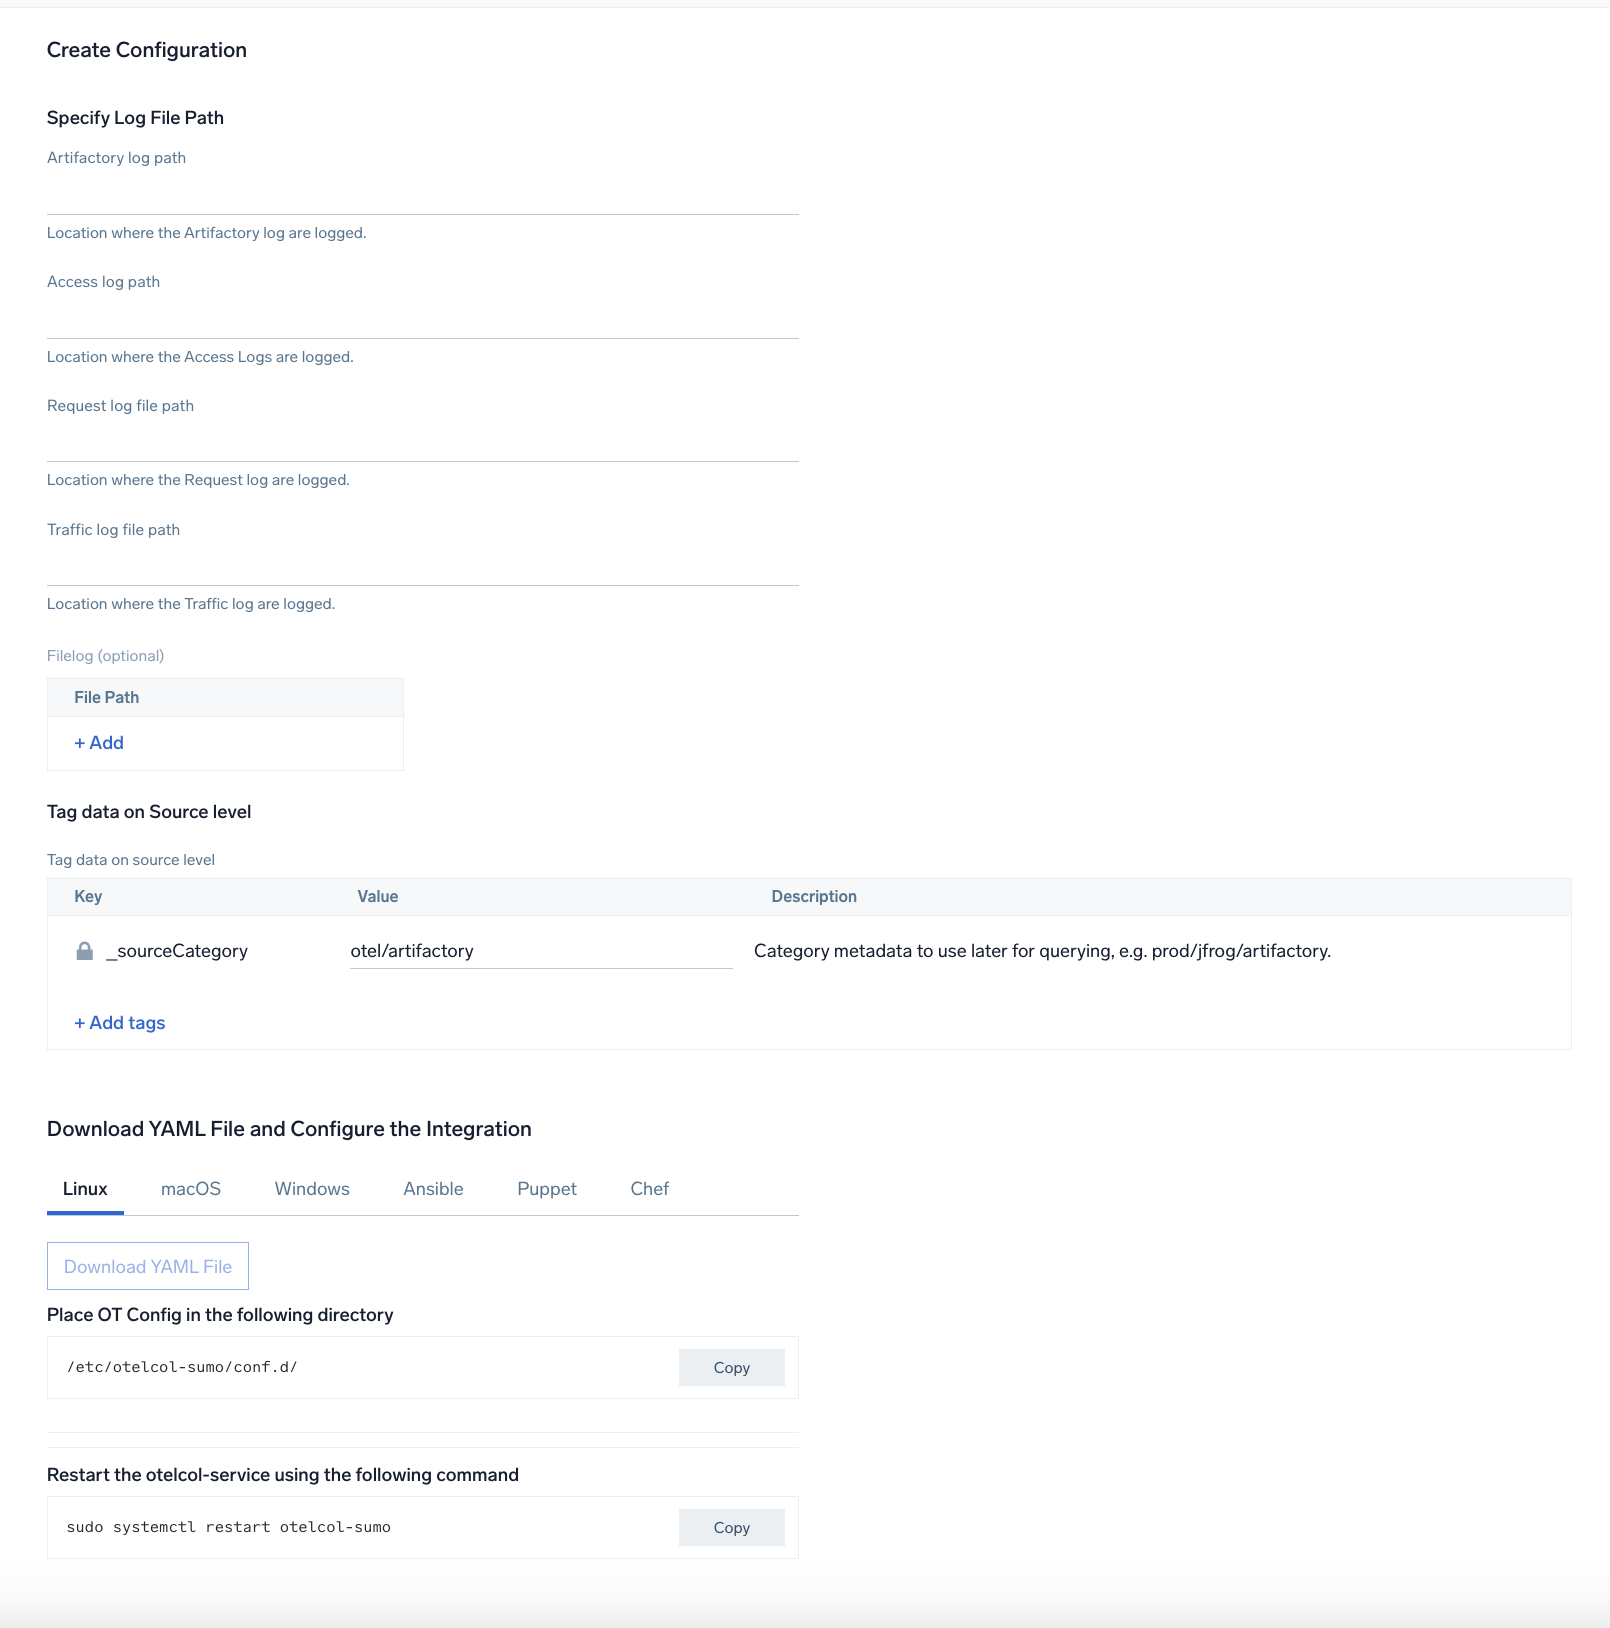
Step 3: Send logs to Sumo
Once you have downloaded the yaml file as described in the previous step, follow the below steps based on your platform.
- Linux
- Windows
- macOS
- Copy the yaml file to
/etc/otelcol-sumo/conf.d/folder in the Artifactory instance that needs to be monitored. - Restart the collector using:
sudo systemctl restart otelcol-sumo
- Copy the yaml file to
C:\ProgramData\Sumo Logic\OpenTelemetry Collector\config\conf.dfolder in the machine that needs to be monitored. - Restart the collector using:
Restart-Service -Name OtelcolSumo
- Copy the yaml file to
/etc/otelcol-sumo/conf.d/folder in the Artifactory instance that needs to be monitored. - Restart the otelcol-sumo process using:
otelcol-sumo --config /etc/otelcol-sumo/sumologic.yaml --config "glob:/etc/otelcol-sumo/conf.d/*.yaml"
After successfully executing the above command, Sumo Logic will start receiving data from your host machine.
Click Next. This will install the app (dashboards and monitors) to your Sumo Logic Org.
Dashboard panels will start to fill automatically. It's important to note that each panel fills with data matching the time range query and received since the panel was created. Results won't immediately be available, but within 20 minutes, you'll see full graphs and maps.
Sample Log Messages
2023-45-16 11:45:44,171 [a8bgdia2di2g80kh] [ACCEPTED DEPLOY] hortonworks-cache:org/apache/hadoop/hadoop-project/2.6.0-cdh5.4.4-SNAPSHOT/maven-metadata.xml for client : admin/195.186.216.125.
Sample Query
This sample Query is from the Artifactory - Cached Deployment Activity > Accepted Deploys by Geolocation panel.
" %"sumo.datasource"=artifactory "ACCEPTED DEPLOY" "-cache"
|parse "[*] [*] *" as trace_id, event_type, user_info
| parse regex field=user_info "(?:(?<repo>[^:]*):(?<path>[^\s]*))?\s+(?<opt_msg>[\w\s:]+)?\s+(?<user>[^\/]+)\/(?<ip>\d{1,3}\.\d{1,3}\.\d{1,3}\.\d{1,3})\."
| where event_type = "ACCEPTED DEPLOY" and repo matches "*-cache"
| count  by ip | sort _count
| lookup longitude, latitude from geo://location on ip = ip
"
Viewing JFrog Artifactory Dashboards
Artifactory - Overview
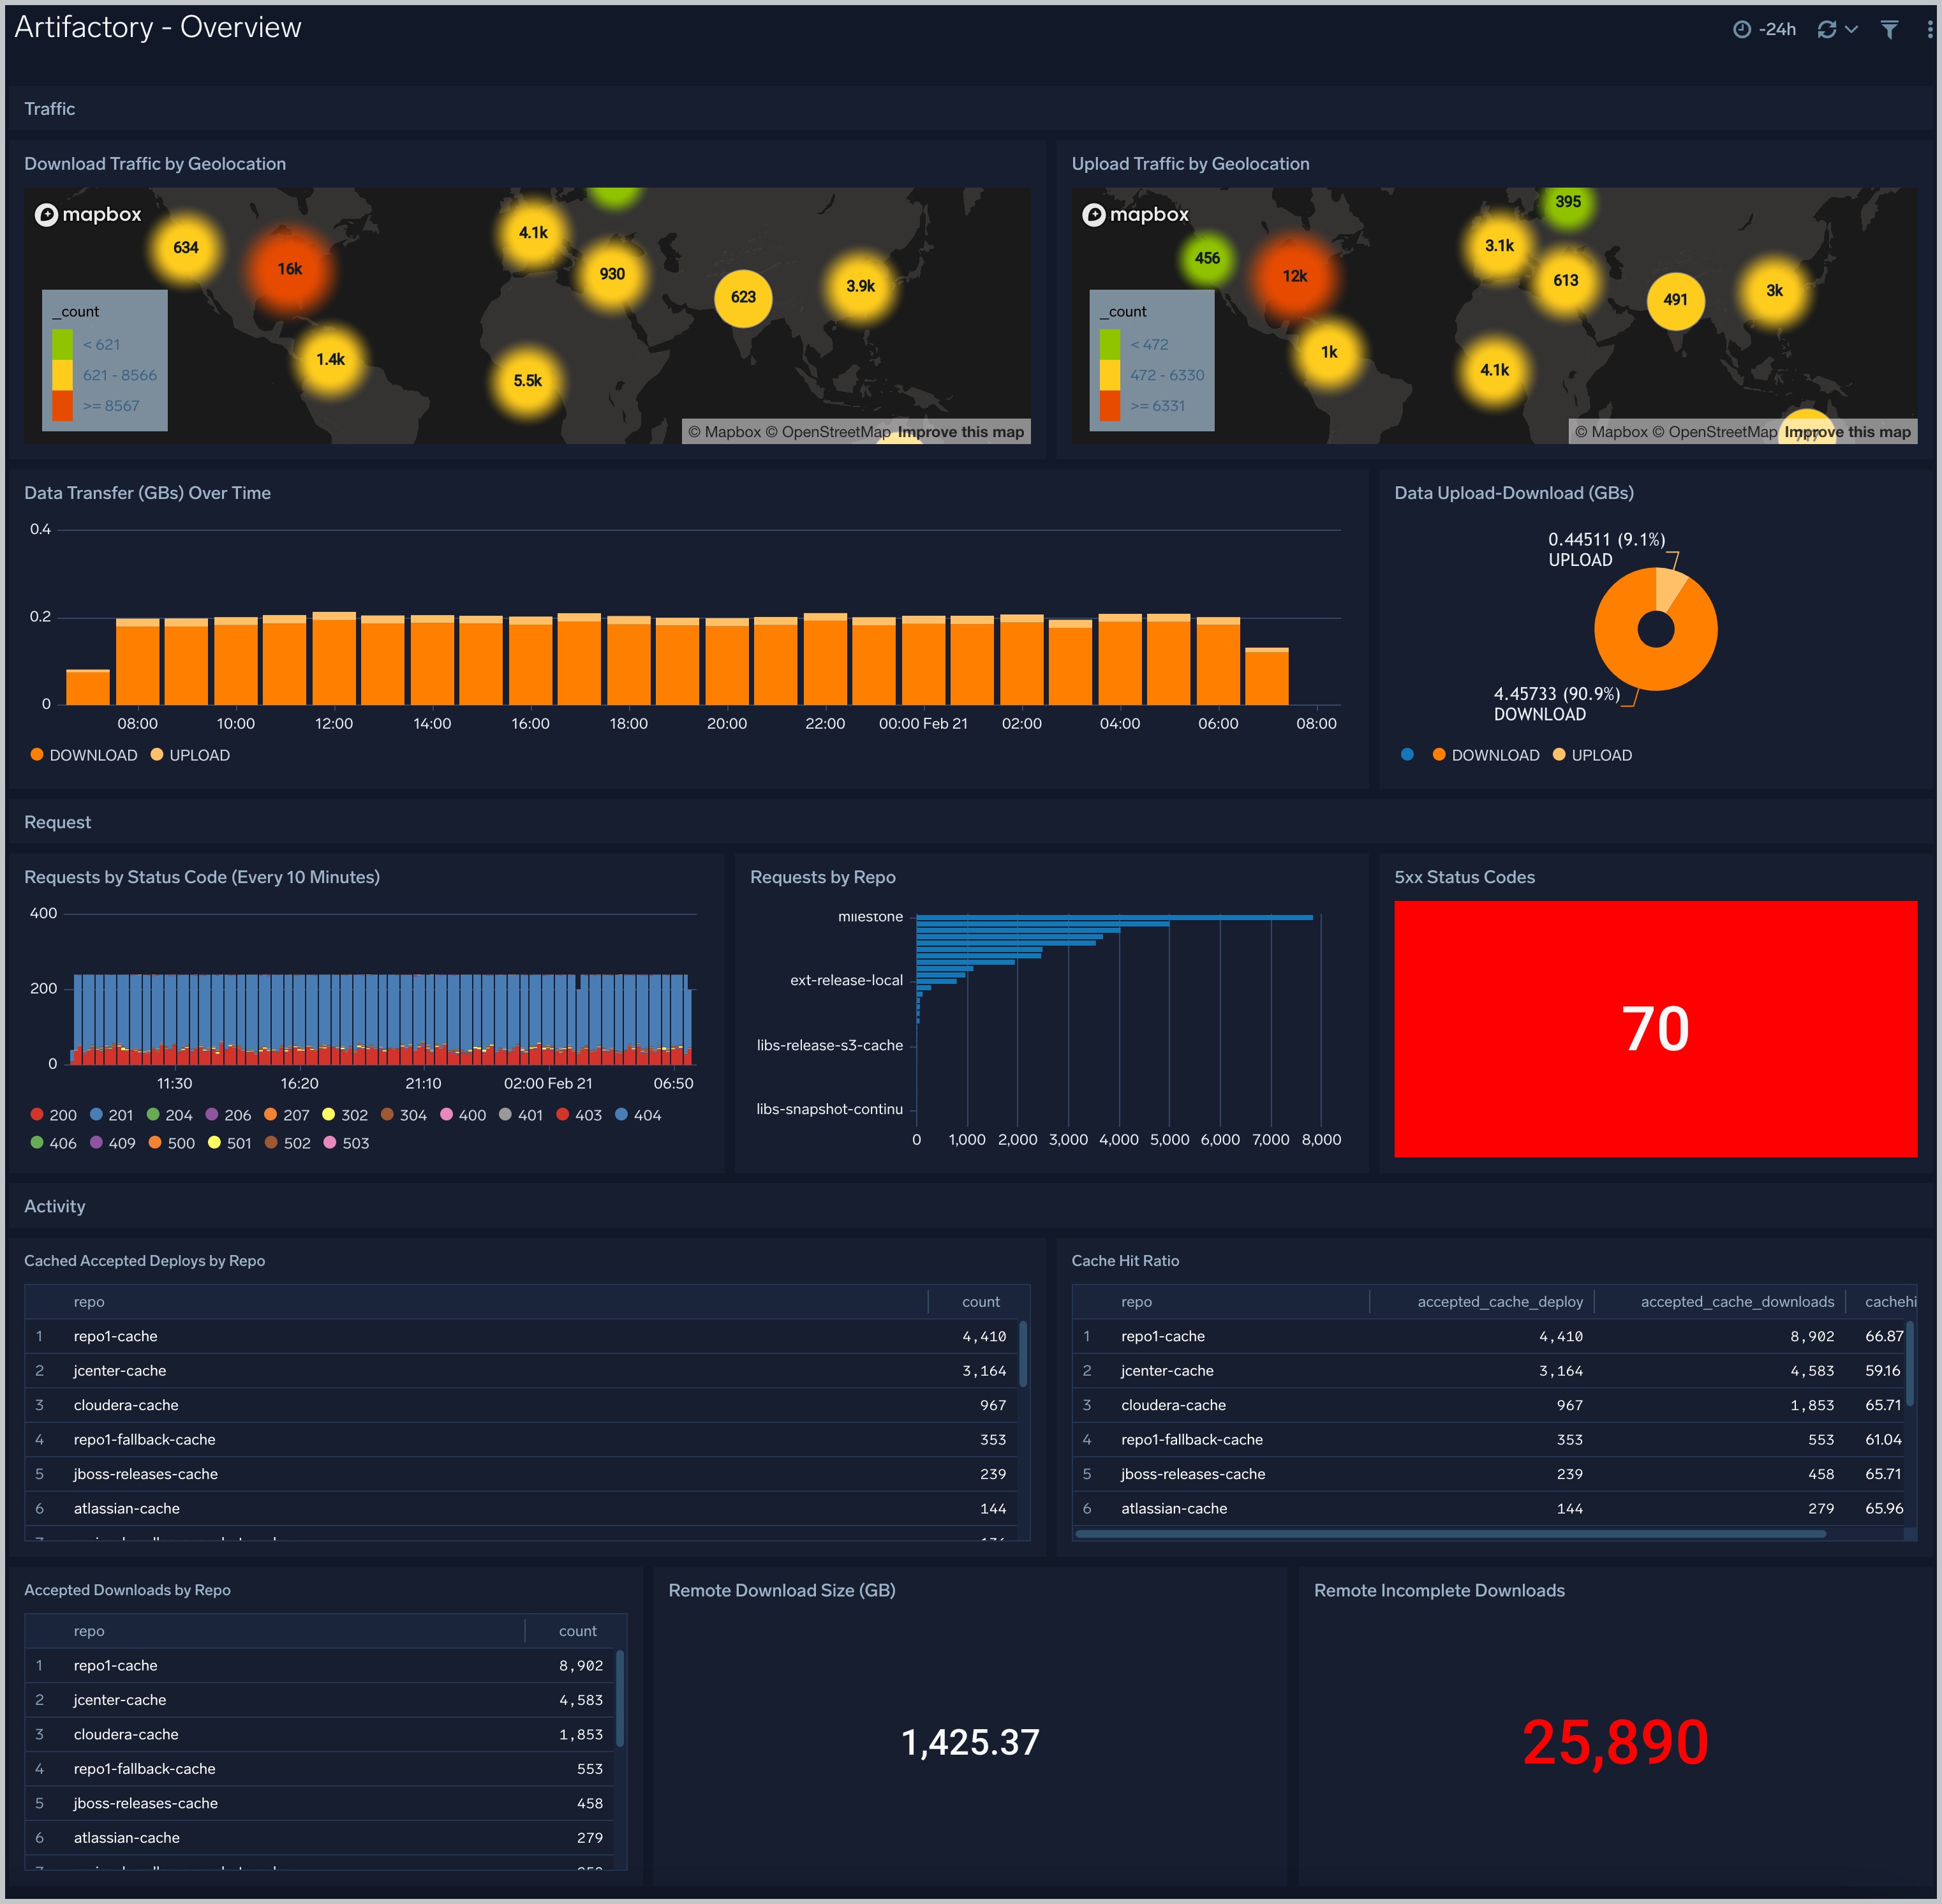
Traffic
Download Traffic by Geolocation. Uses a geo lookup operation to display download traffic by IP address on a map of the world for the last 24 hours.
Upload Traffic by Geolocation. Uses a geo lookup operation to display upload traffic by IP address on a map of the world for the last 24 hours.
Data Transfers (GBs) Over Time. Displays data transfers in GBs for uploads and downloads as a stacked column chart on a timeline for the last 24 hours.
Data Upload-Download (GBs). Compares the upload and download count in GB displayed in a pie chart for the last 24 hours.
Request
Requests by Status Code (Every 10 Minutes). Displays requests by status code every 10 minutes in a stacked column chart on a timeline for the last 24 hours.
Requests by Repo. Shows the number of requests by repo as a bar chart for the last 24 hours.
5xx Status Codes. Displays the number of 5xx status codes in a single value chart for the last 24 hours.
Activity
Non-Cached Accepted Deploys by Repo. Shows information about non-cached accepted deploys by repo in a table chart, including details on the repo and count, for the last 24 hours.
Cache Hit Ratio. Displays information on the cache hit ratio in a table chart, including details on repo, accepted cache deploy, accepted cache downloads, and cache hit ratio for the last 24 hours.
Accepted Downloads by Repo. Shows information on accepted downloads by repo including details on repo and count for the last 24 hours.
Remote Download Size (GB). Displays the remote download size in GBs as a single value chart for the last 24 hours.
Remote Incomplete Downloads. Displays the remote incomplete downloads in GB as a single value chart for the last 24 hours.
Artifactory - Cached Deployment Activity
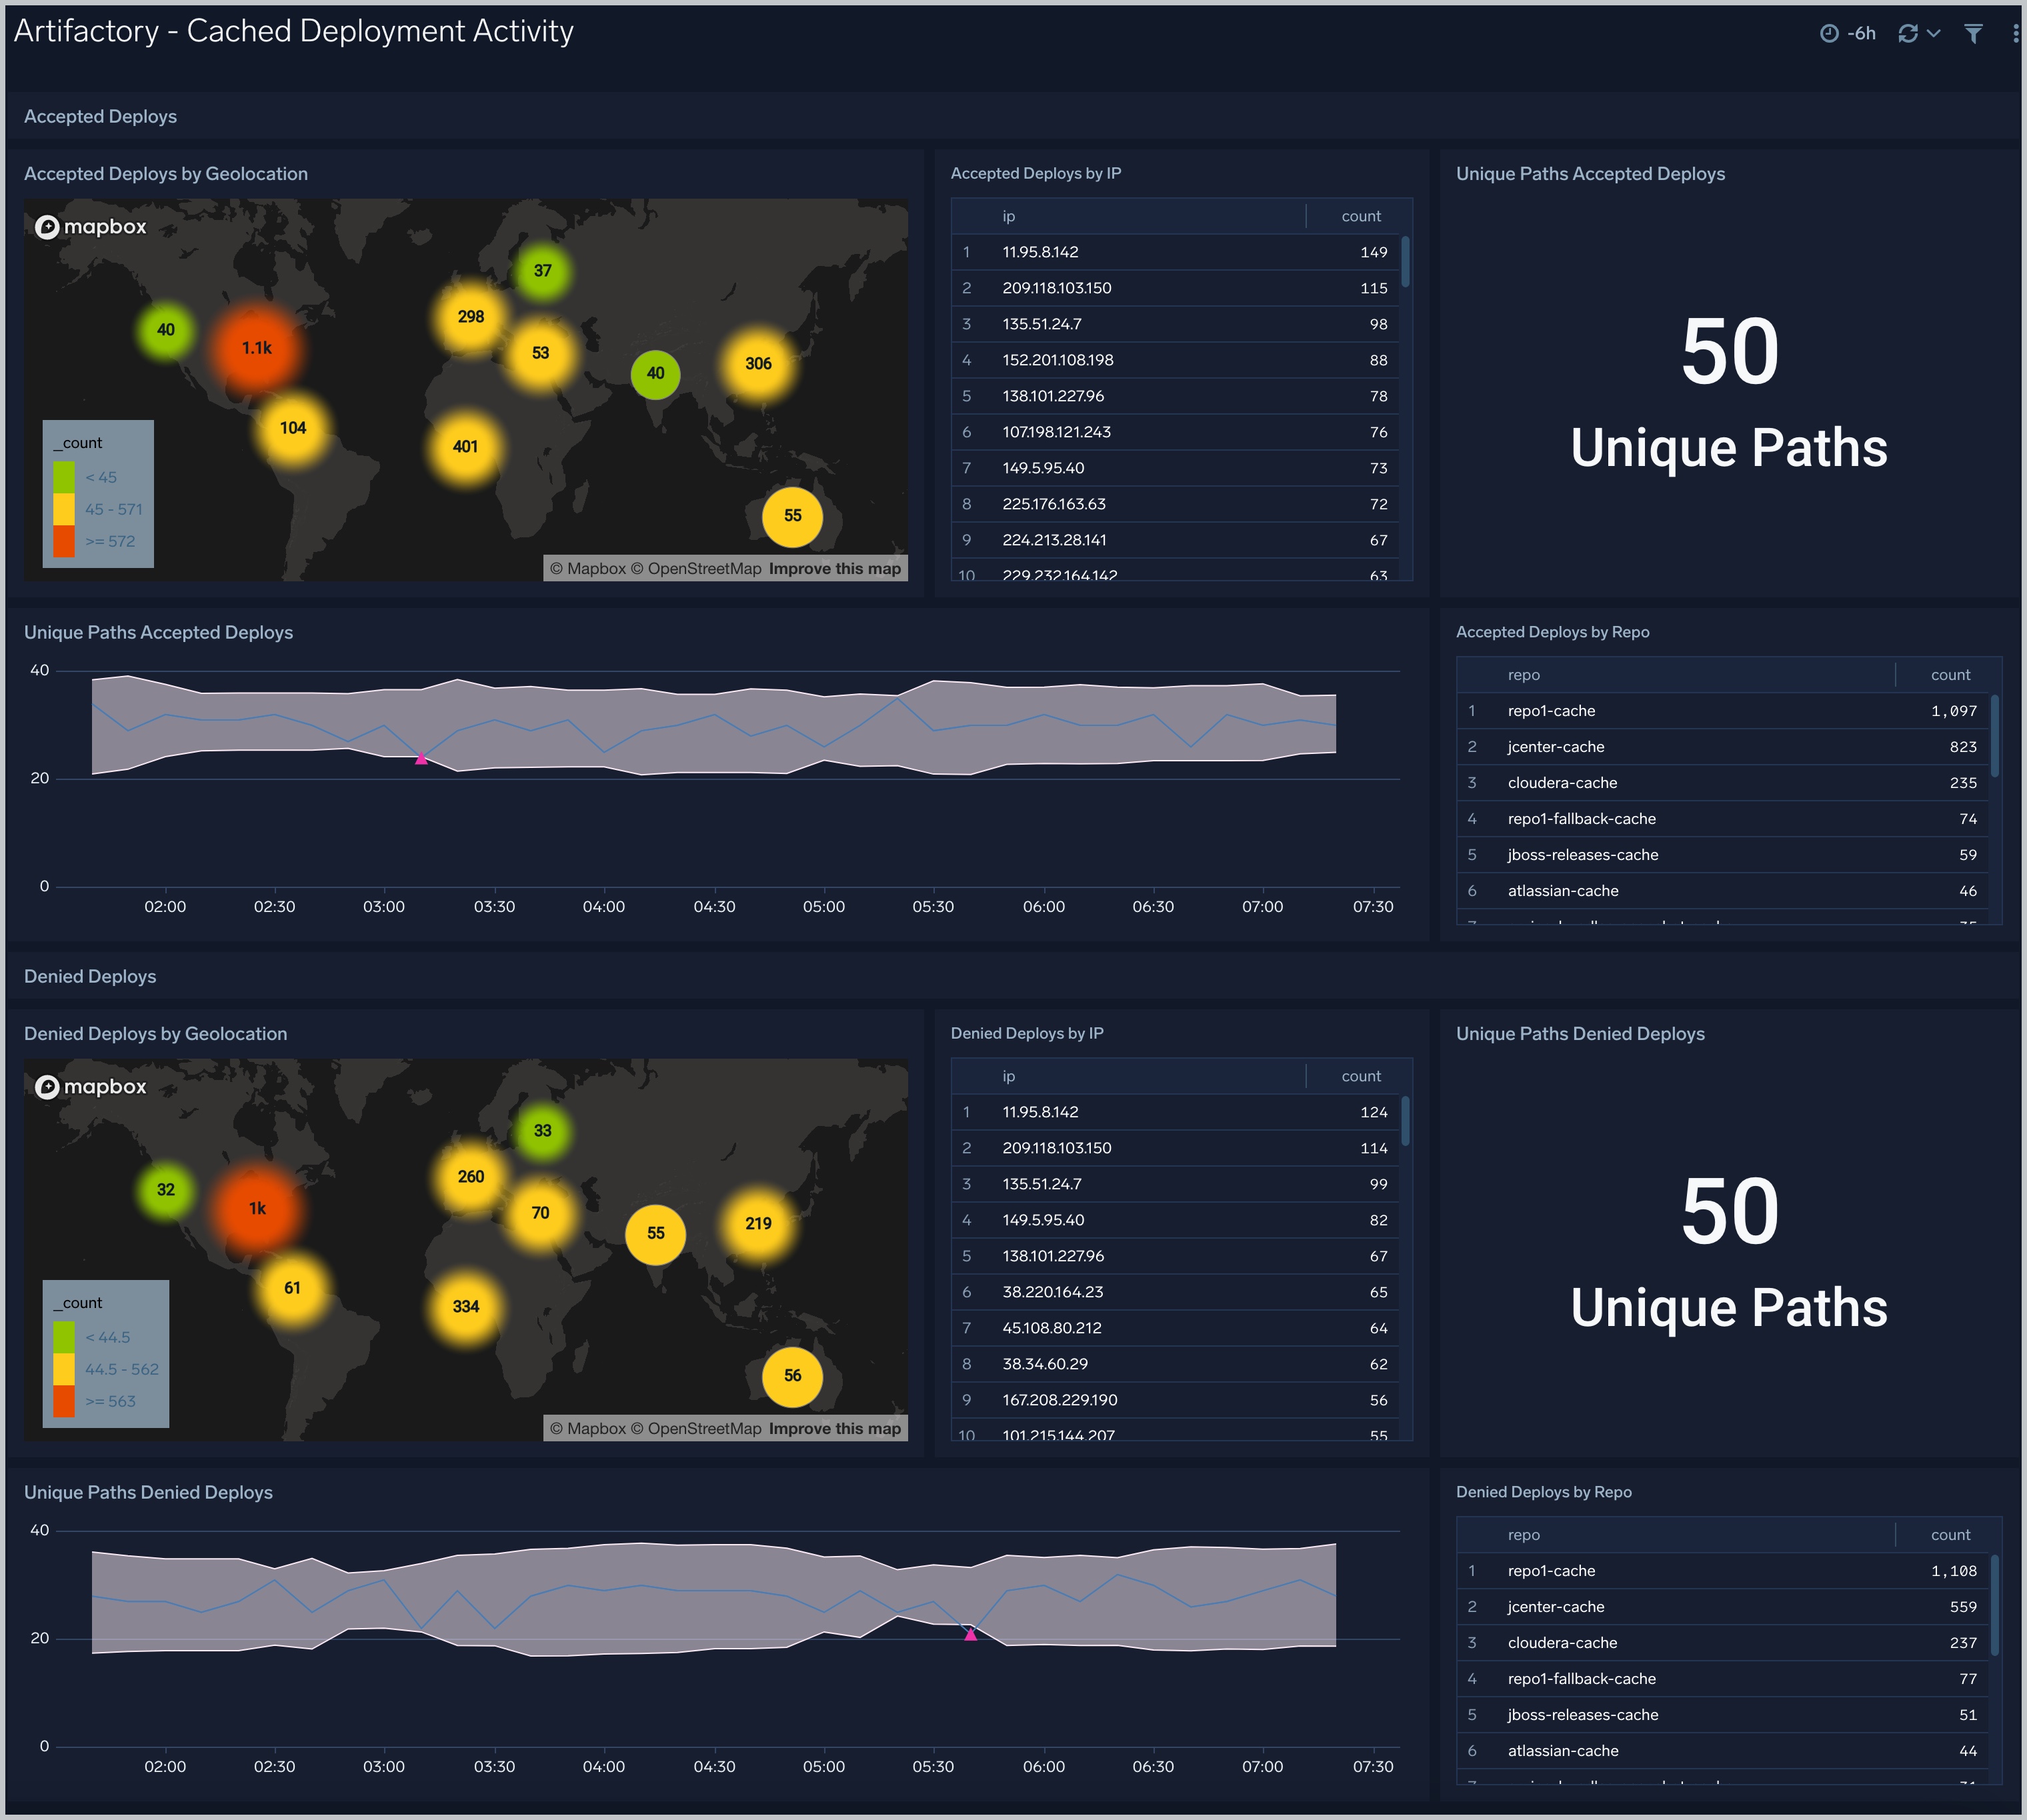
Accepted Deploys
Accepted Deploys by Geolocation. Uses a geo lookup operation to display accepted deploys by IP address on a map of the world for the last six hours.
Accepted Deploys by IP. Displays the number of accepted deploys by IP address in an aggregation table for the last six hours.
Unique Paths Accepted. Shows the number of unique paths of accepted deploys in a single value chart for the last six hours.
Unique Paths Accepted Deploys. Provides details on the number of unique paths of accepted deploys in a outlier combo chart on a timeline for the last six hours.
Accepted Deploys by Repo. Displays the number of accepted deploys by repo in an aggregation table for the last six hours.
Denied Deploys
Denied Deploys by Geolocation. Uses a geo lookup operation to display denied deploys by IP address on a map of the world for the last six hours.
Denied Deploys by IP. Displays the number of denied deploys by IP address in an aggregation table for the last six hours.
Unique Paths Denied Deploys. Shows the number of unique paths of denied deploys in a single value chart for the last six hours.
Unique Paths Denied Deploys. Provides details on the number of unique paths of denied deploys in a outlier combo chart on a timeline for the last six hours.
Denied Deploys by Repo. Provides details on the number of denied downloads per repo in an aggregation table for the last six hours.
Artifactory - Download Activity
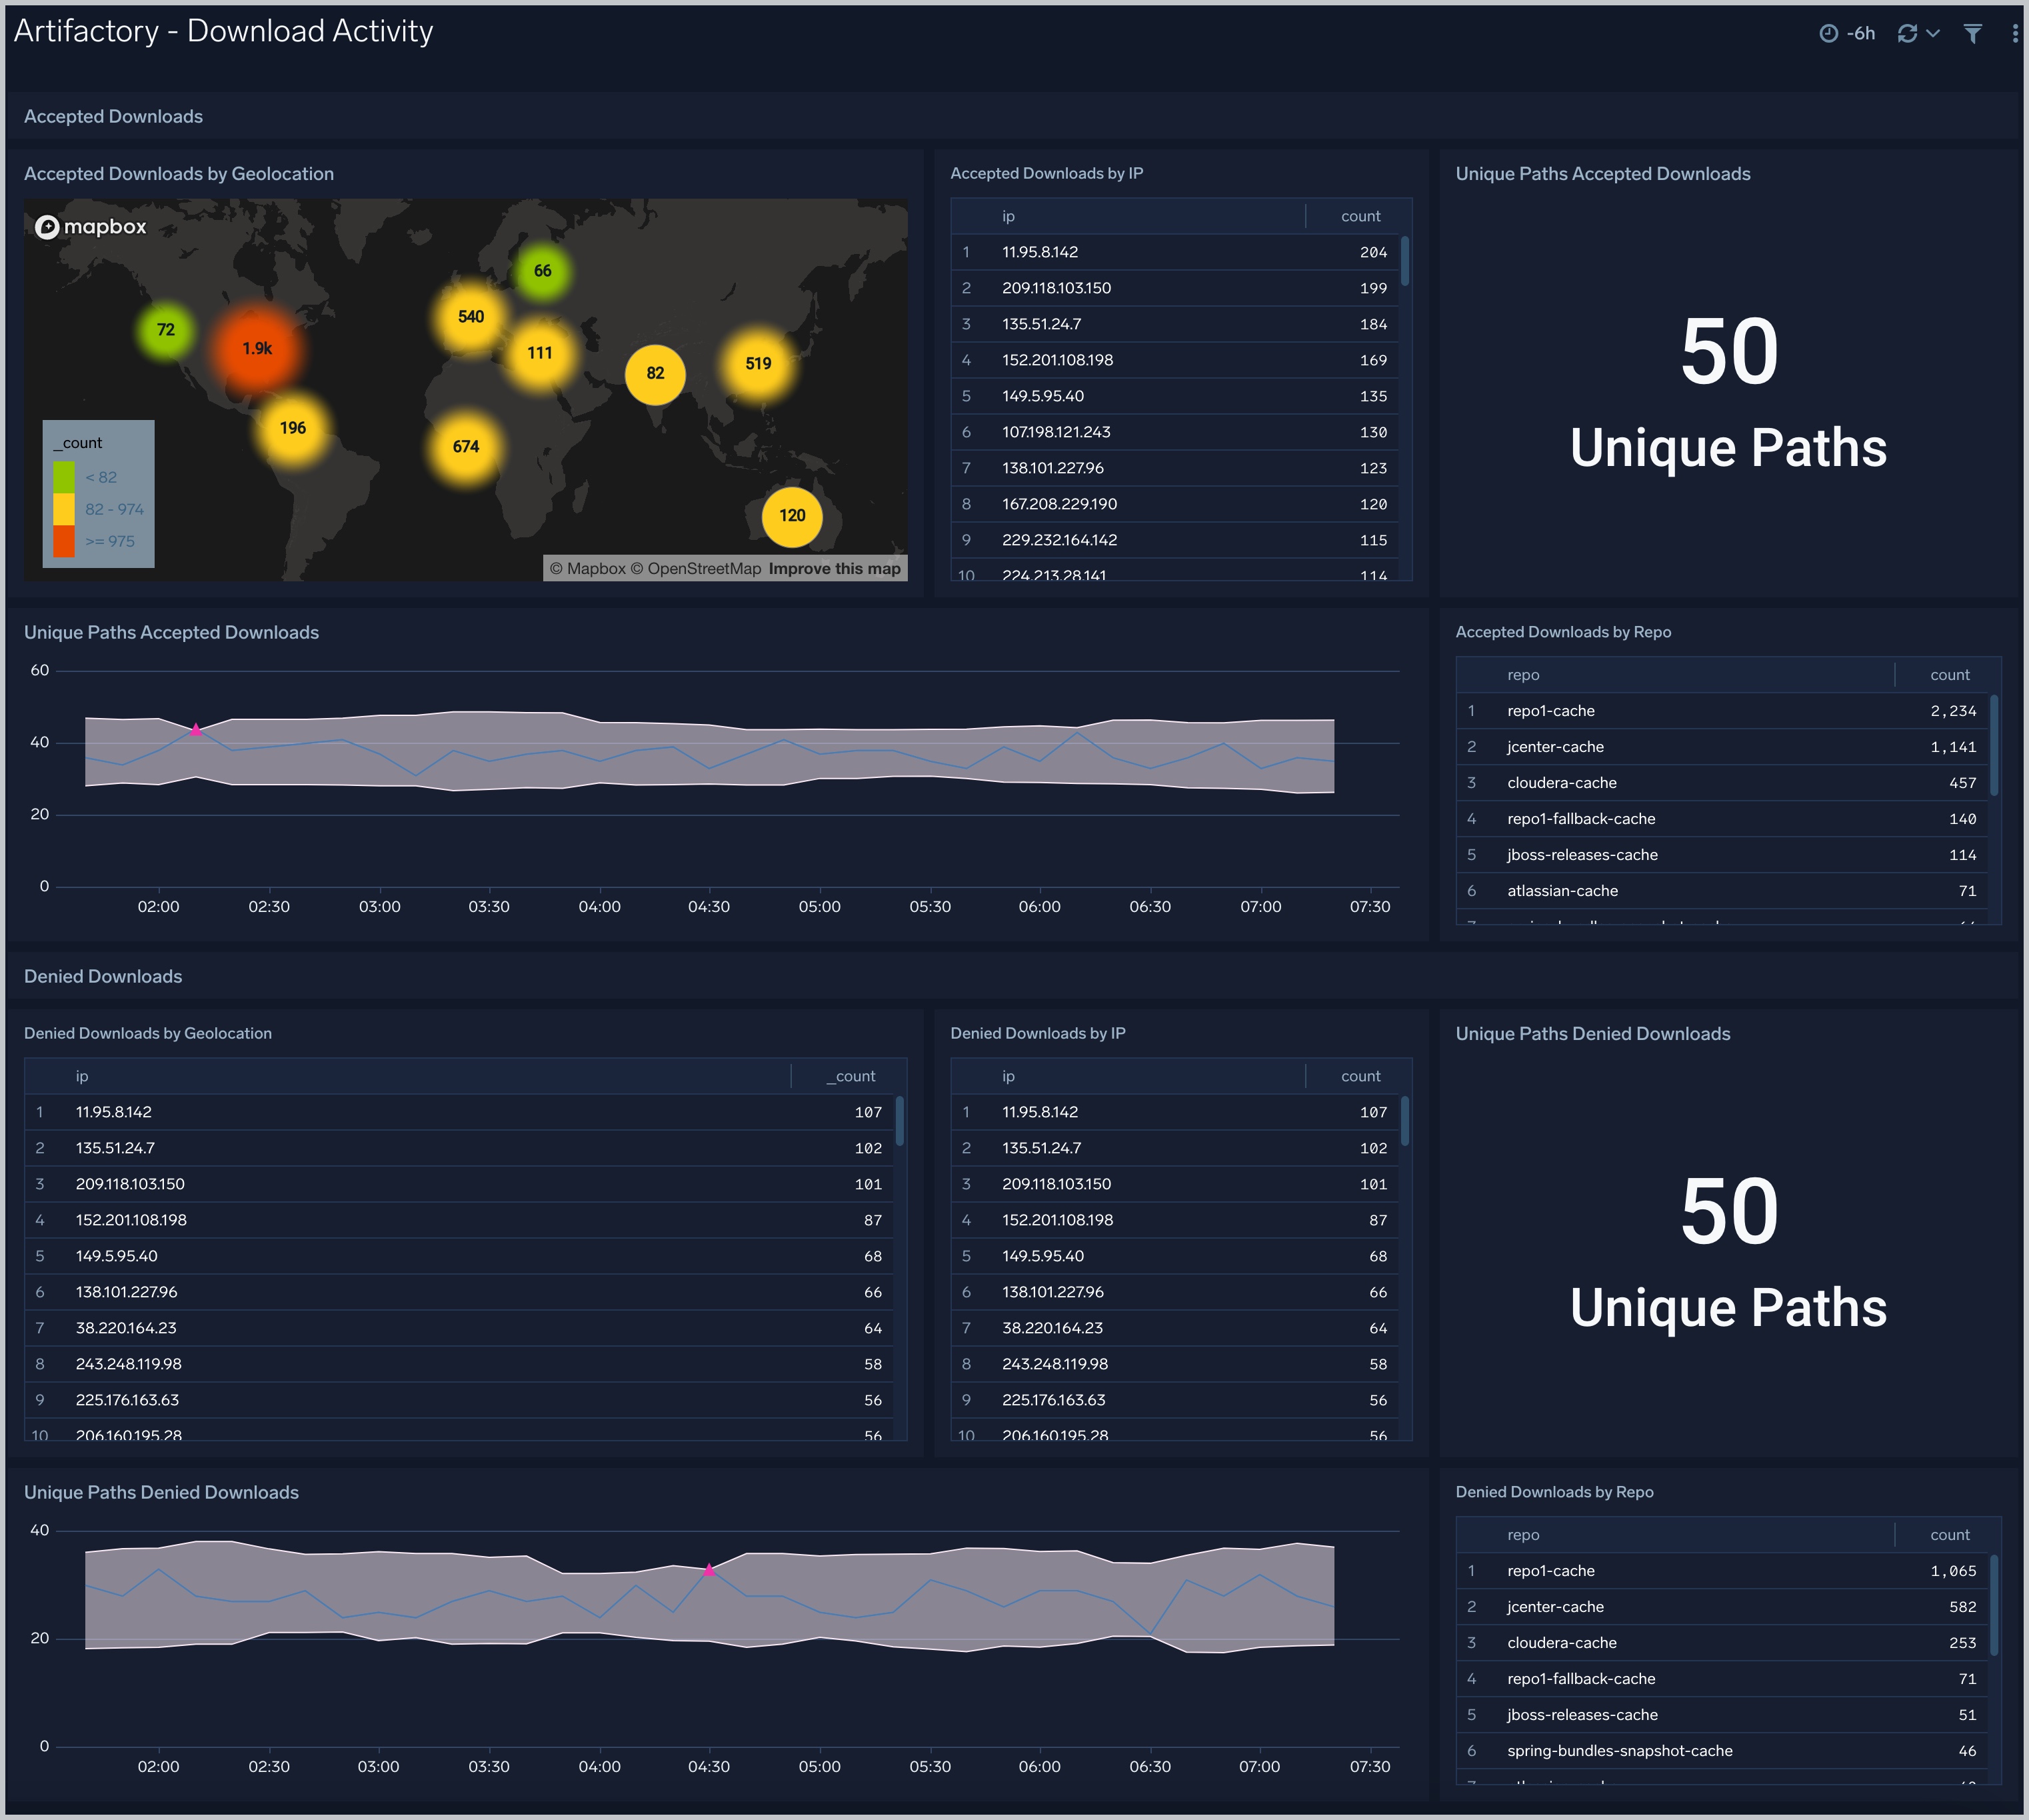
Accepted Downloads
Accepted Downloads by Geolocation. Uses a geo lookup operation to display accepted downloads by IP address on a map of the world for the last six hours.
Accepted Downloads by IP. Displays the number of accepted downloads by IP address in an aggregation table for the last six hours.
Unique Paths Accepted Downloads. Shows the number of unique paths of accepted downloads in a single value chart for the last six hours.
Unique Paths Accepted Downloads. Provides details on the number of unique paths of accepted downloads in a outlier combo chart on a timeline for the last six hours.
Accepted Downloads by Repo. Displays the number of accepted downloads by repo in an aggregation table for the last six hours.
Denied Downloads
Denied Downloads by Geolocation. Uses a geo lookup operation to display denied downloads by IP address on a map of the world for the last six hours.
Denied Downloads by IP. Displays the number of denied downloads by IP address in an aggregation table for the last six hours.
Unique Paths Denied. Shows the number of unique paths of denied downloads in a single value chart for the last six hours.
Unique Paths Denied Downloads. Provides details on the number of unique paths of denied downloads in a outlier combo chart on a timeline for the last six hours.
Denied Downloads by Repo. Provides details on the number of denied downloads per repo in an aggregation table for the last six hours.
Artifactory - Non-Cached Deployment Activity
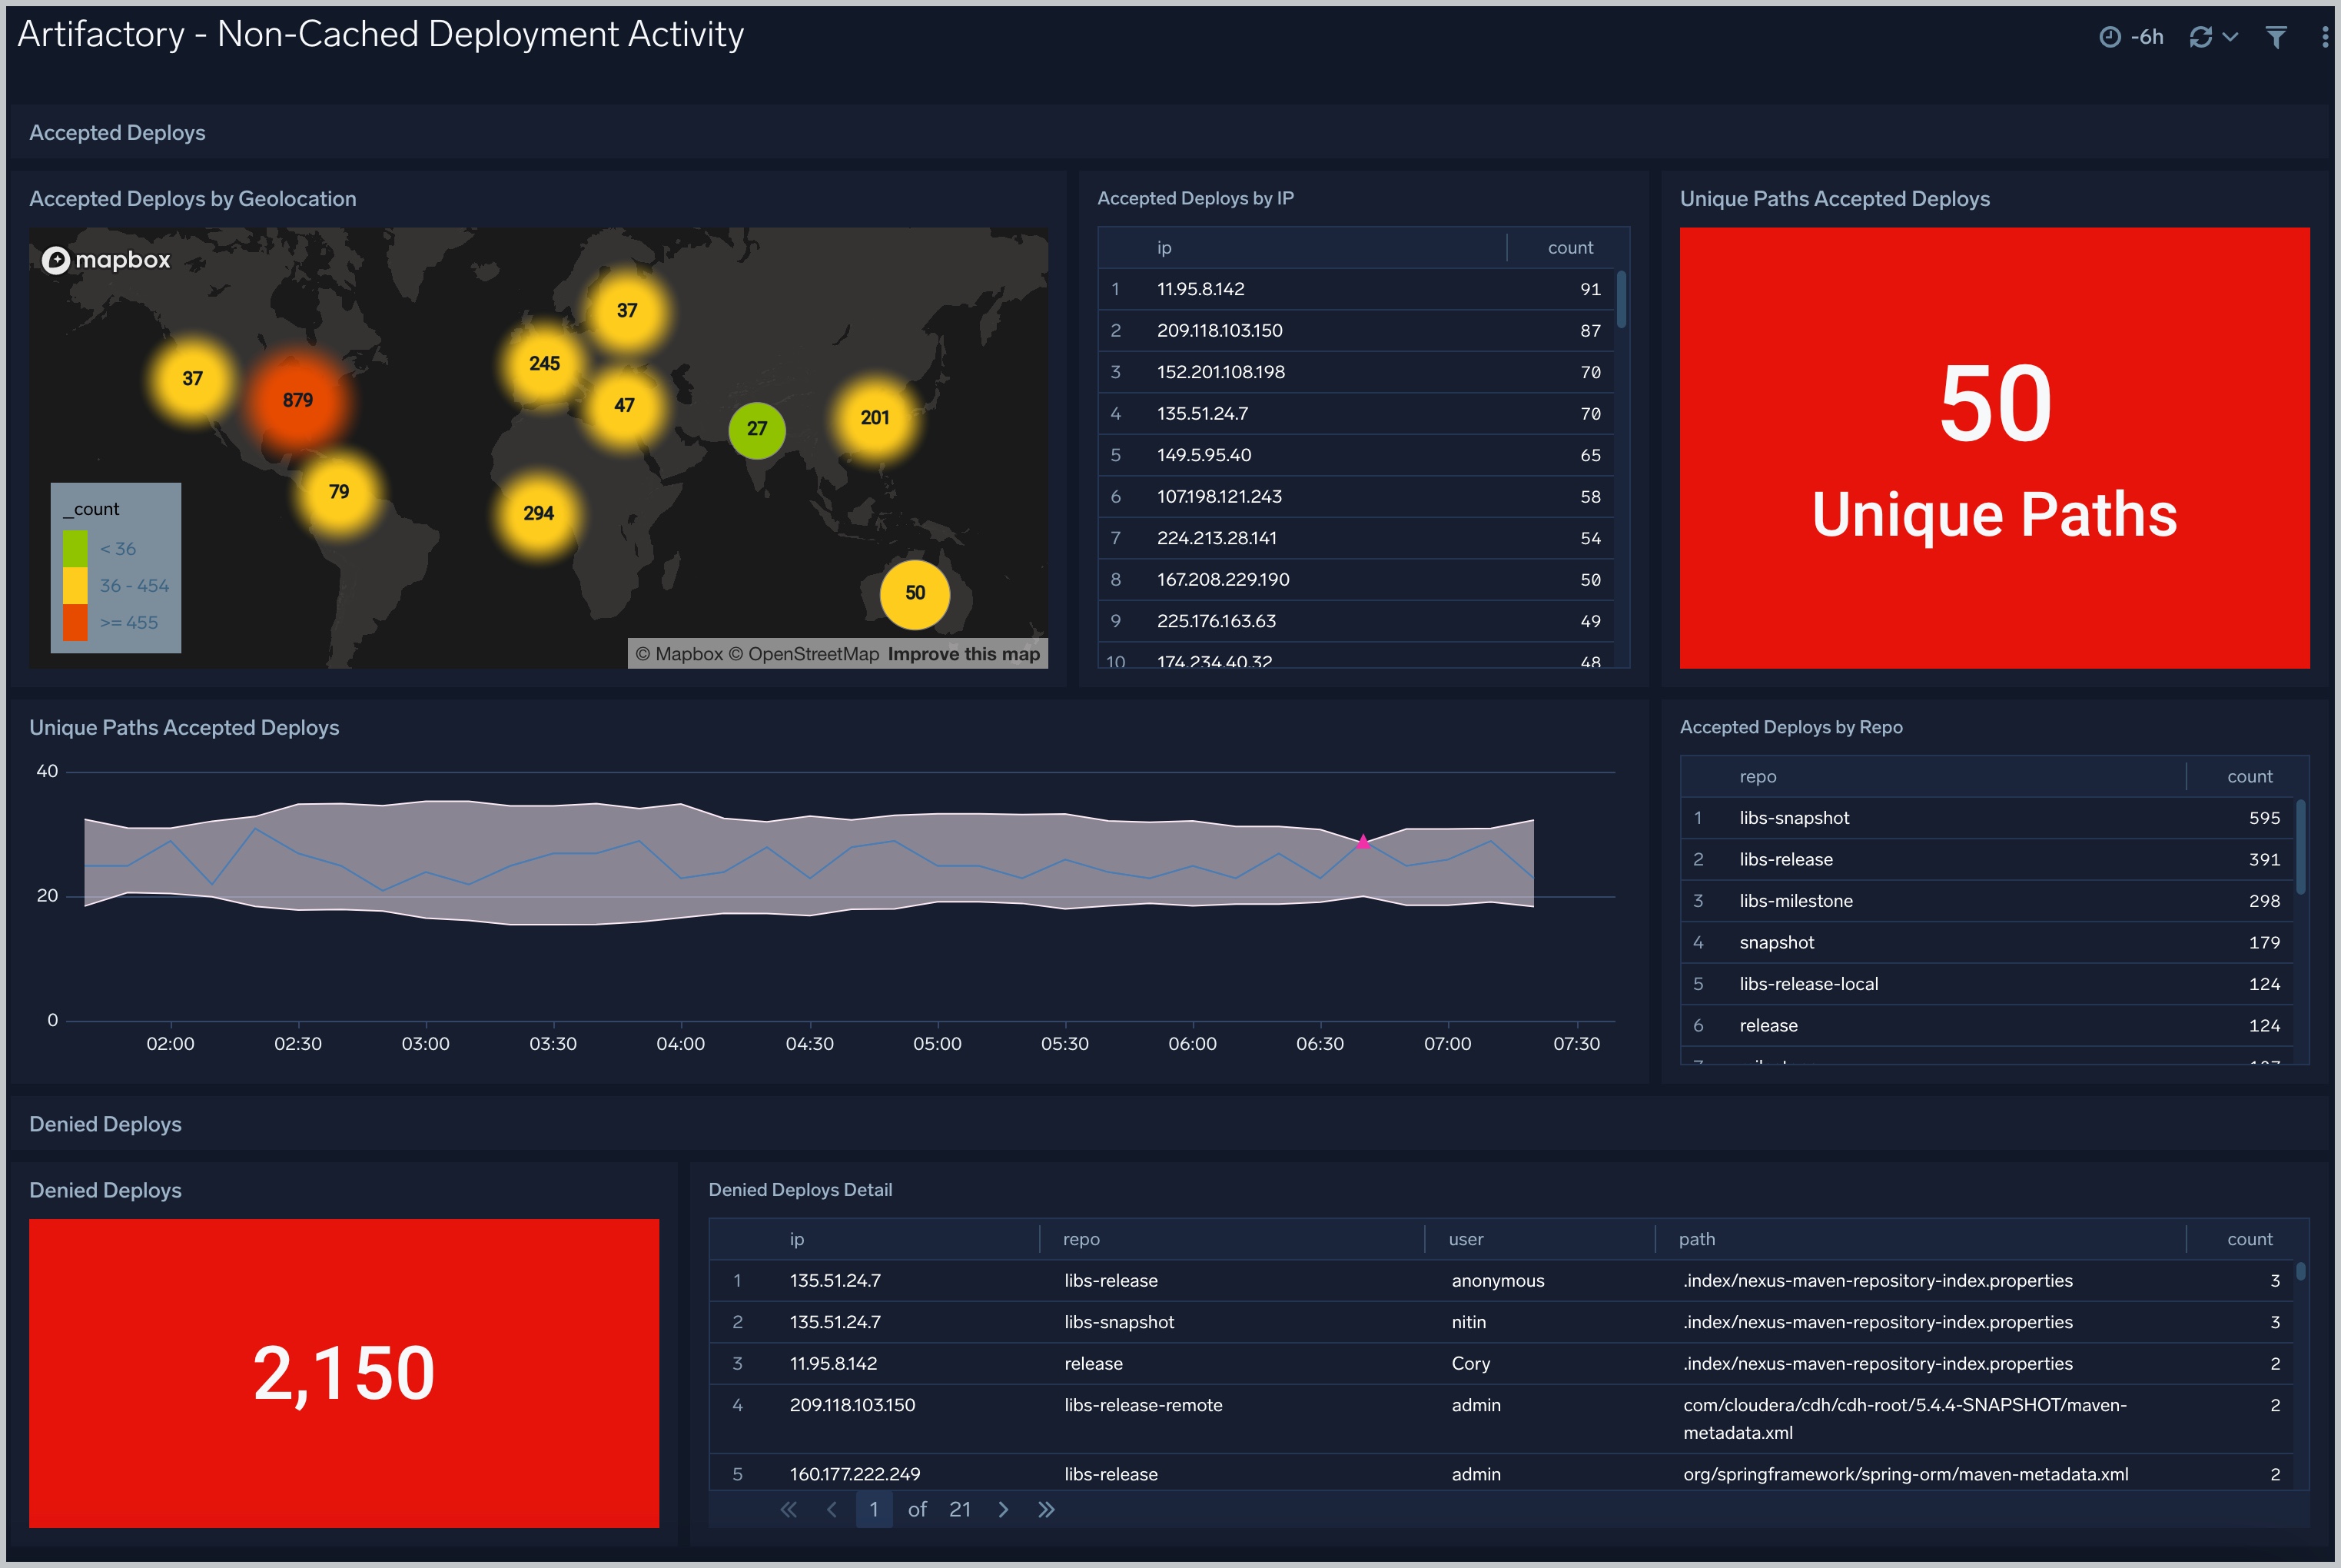
Accepted Deploys
Accepted Deploys by Geolocation. Uses a geo lookup operation to display accepted deploys by IP address on a map of the world for the last six hours.
Accepted Deploys by IP. Displays the number of accepted deploys by IP address in an aggregation table for the last six hours.
Unique Paths Accepted Deploys. Shows the number of unique paths of accepted deploys in a single value chart for the last six hours.
Unique Paths Accepted Deploys. Provides details on the number of unique paths of accepted deploys in a outlier combo chart on a timeline for the last six hours.
Accepted Deploys by Repo. Displays the number of accepted deploys by repo in an aggregation table for the last six hours.
Denied Deploys
Denied Deploys. Shows the number of denied deploys in a single value chart for the last six hours.
Denied Deploys Detail. Displays details on the number of denied deploys in an aggregation table, including IP address, repo name, user, path, and count for the last six hours.
Artifactory - Request and Access
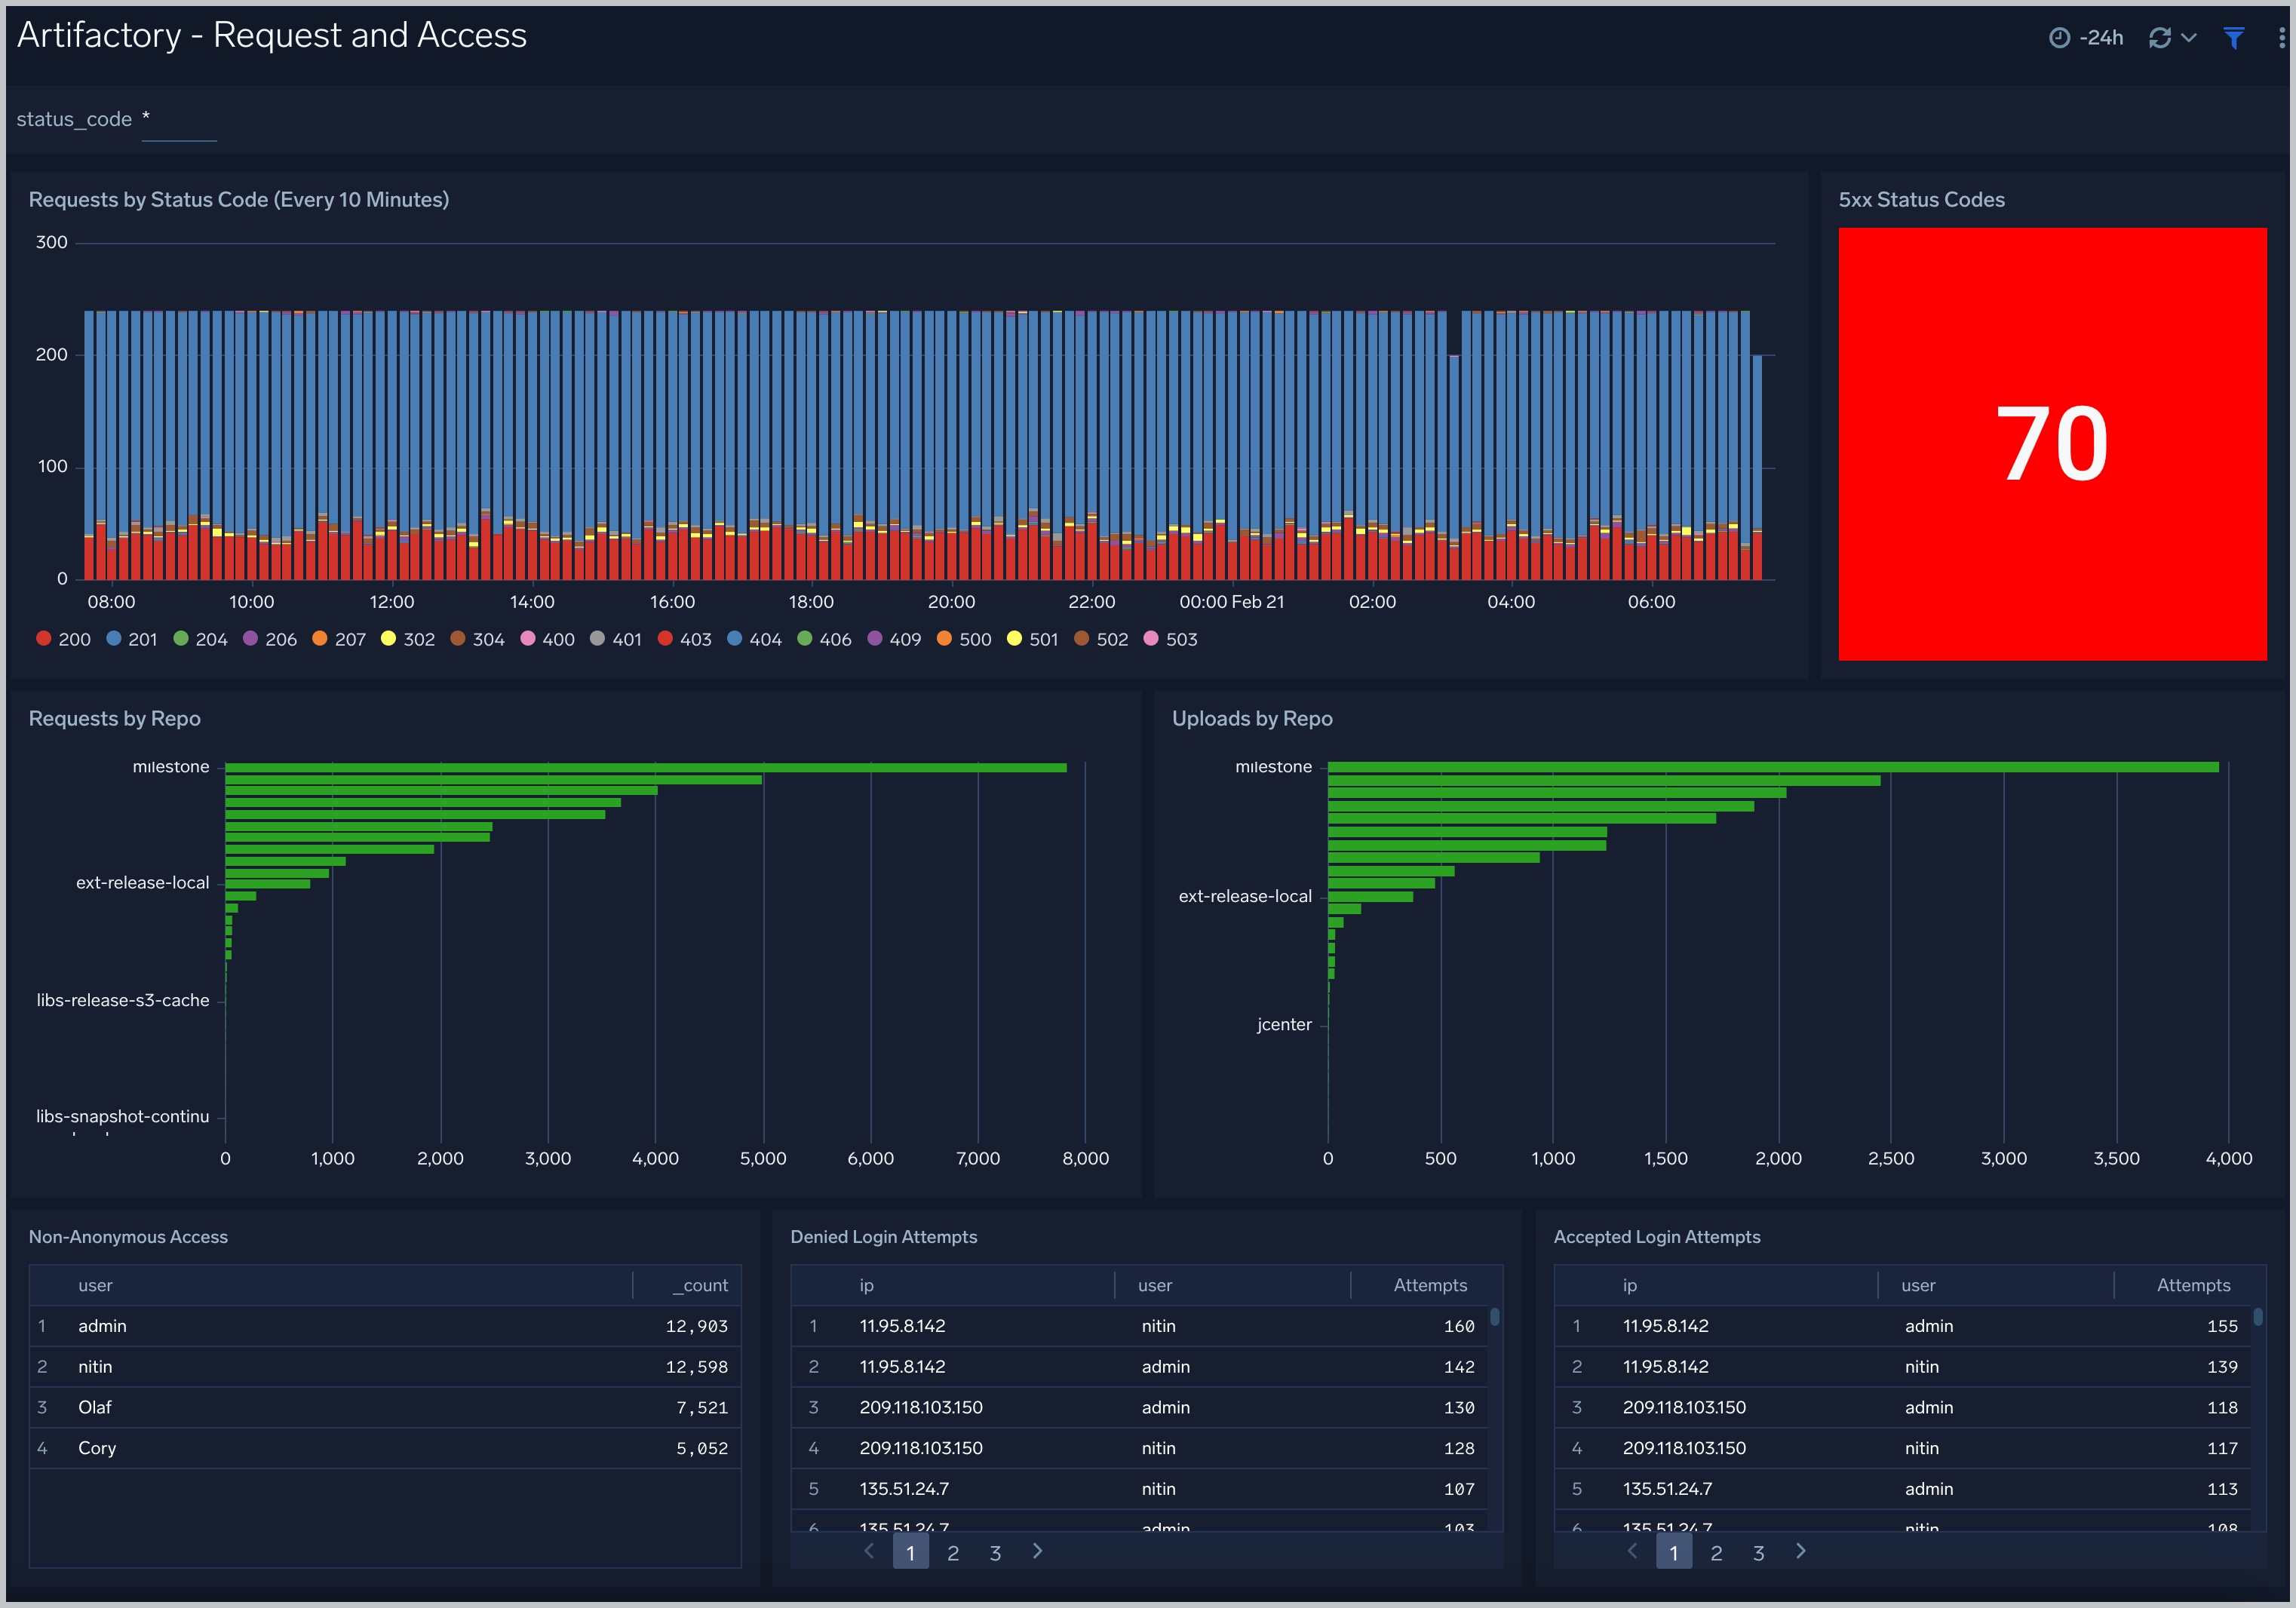
Requests by Status Code (Every 10 Minutes). Displays requests by status code every 10 minutes in a stacked column chart on a timeline for the last 24 hours.
5xx Status Codes. Provides the number of 5xx status codes in a single value chart for the last 24 hours.
Requests by Repo. Shows the number of requests by repo as a bar chart for the last 24 hours.
Uploads by Repo. Displays the number of uploads by repo as a bar chart for the last 24 hours.
Non-Anonymous Access. Displays the top 10 accepted non-anonymous access attempts in a table chart, including details on user name and count for the last 24 hours.
Denied Login Attempts. Displays the number of denied login attempts in a table chart, including details on IP address, user name, and number of attempts for the last 24 hours.
Accepted Login Attempts. Shows the number of accepted login attempts in a table chart, including details on IP address, user name, and number of attempts for the last 24 hours.
Artifactory - Traffic
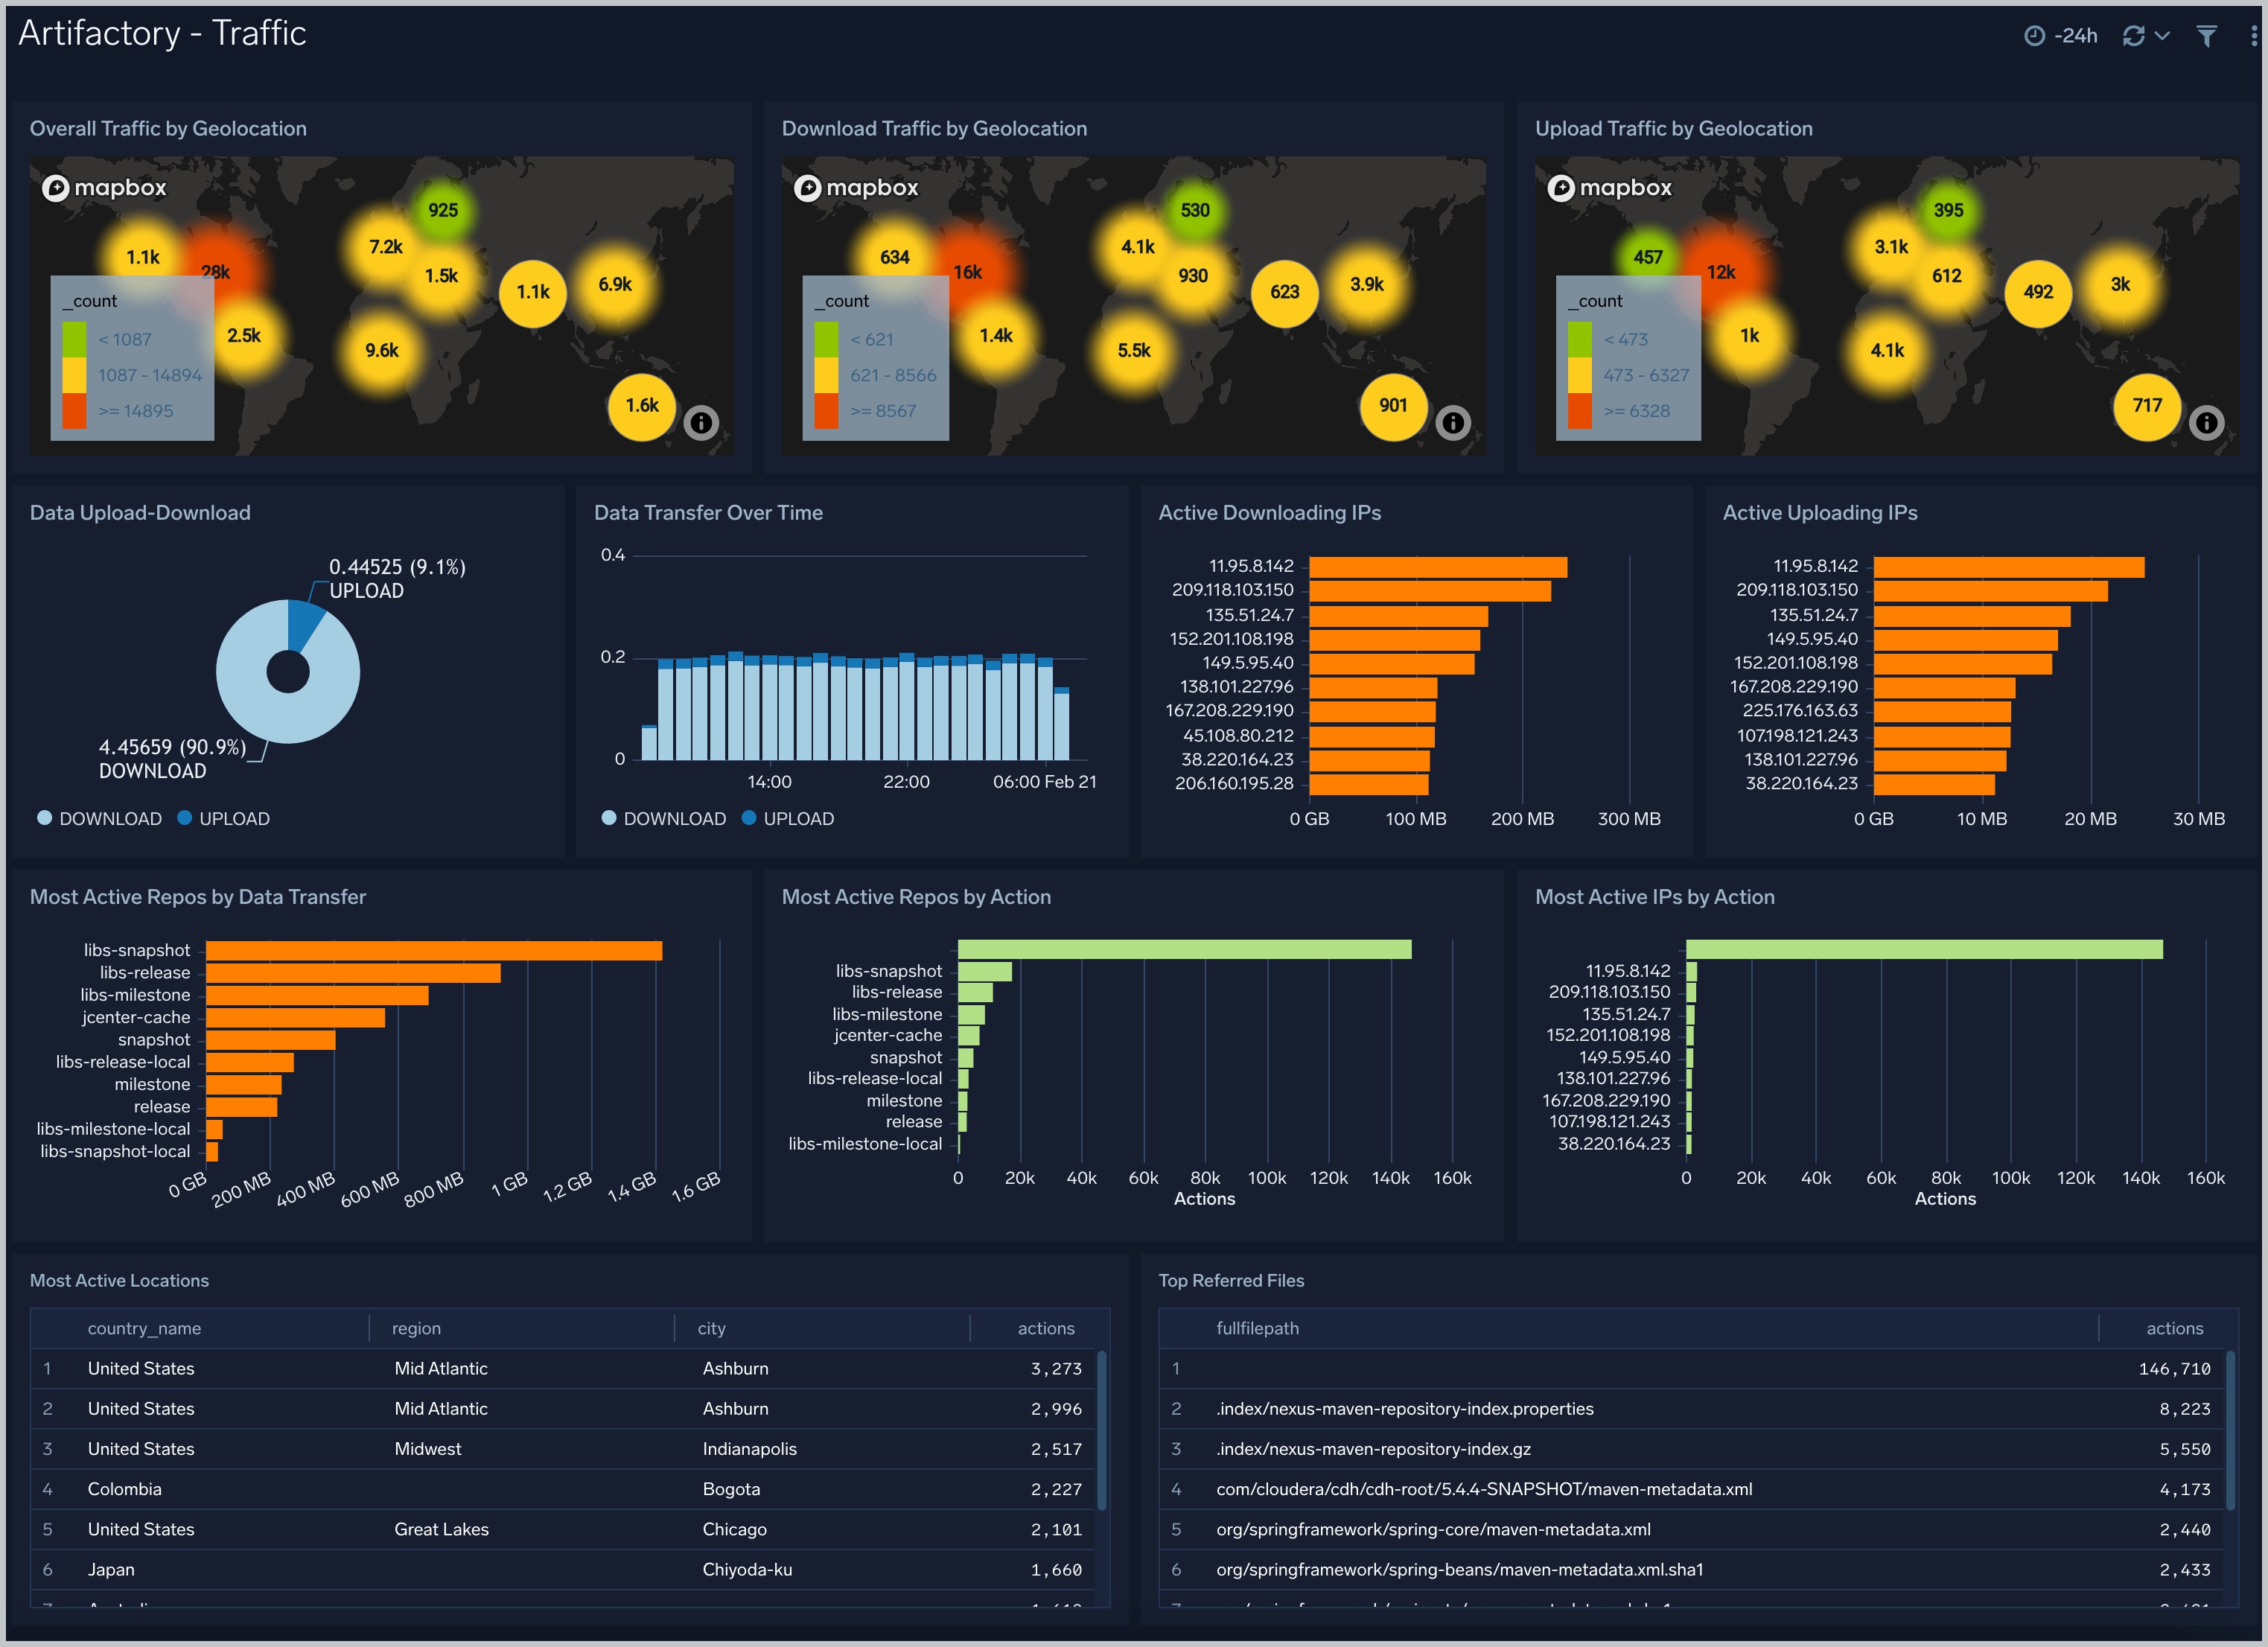
Overall Traffic by Geolocation. Uses a geo lookup operation to display overall traffic by IP address on a map of the world for the last 24 hours.
Download Traffic by Geolocation. Uses a geo lookup operation to display download traffic by IP address on a map of the world for the last 24 hours.
Upload Traffic by Geolocation. Uses a geo lookup operation to display upload traffic by IP address on a map of the world for the last 24 hours.
Data Upload-Download. Compares the upload and download count in GB displayed in a pie chart for the last 24 hours.
Data Transfer Over Time. Displays the amount of data transferred by upload and download over time as a stacked column chart on a timeline for the last 24 hours.
Active Downloading IPs. Shows the top 10 active downloading IPs in GB in a bar chart for the last 24 hours.
Active Uploading IPs. Provides the top 10 active uploading IPs in GB in a bar chart for the last 24 hours.
Most Active Repos by Data Transfer. Displays the top 10 most active repos by data transfer in GB in a bar chart for the last 24 hours.
Most Active Repos by Action. Shows the top 10 most active repos by action in GB in a bar chart for the last 24 hours.
Most Active IPs by Action. Provides information on the top 10 most active IPs by action in GB in a bar chart for the last 24 hours.
Most Active Locations. This aggregation table provides a list of the top 10 most active locations by country name, region, city, and the number of actions for the last 24 hours.
Top Referred Files. Displays a list of the top 10 referred files by file path and number of actions in an aggregation table for the last 24 hours.