JFrog Artifactory - Classic Collector

The Sumo Logic App for Artifactory provides insight into your JFrog Artifactory binary repository. The App provides preconfigured Dashboards that include an Overview of your system, Traffic, Requests and Access, Download Activity, Cache Deployment Activity, and Non-Cached Deployment Activity.
The Sumo Logic App for Artifactory only supports Artifactory On-Premise. It does not work with Artifactory Online. The JFrog Artifactory Sumo Logic integration supports both Artifactory On-Premise and Artifactory Online.
- If you do not have a Sumo Logic account, the JFrog Artifactory Sumo Logic integration is the most convenient way to start using Sumo Logic directly from Artifactory.
- If you do have a Sumo Logic account, you can still use use the integration, but this will create a secondary Sumo Logic account. If you choose to use your current account, you can do so by installing the Sumo Logic App for Artifactory and access your Artifactory data from Sumo Logic, instead of from your Artifactory instance.
Artifactory
Log Types
The Sumo Logic App for Artifactory collects data from the following logs:
- artifactory.log. The main Artifactory log file that contains data on Artifactory server activity.
- access.log. The security log containing important information about accepted and denied requests, configuration changes, and password reset requests. The originating IP address for each event is also recorded.
- request.log. Generic HTTP traffic information similar to the Apache HTTPd request log.
- traffic.log. A log that contains information about site traffic and file sizes.
For more details about Artifactory logs, refer to https://www.jfrog.com/confluence/display/RTF/Artifactory+Log+Files and Artifactory Log Files.
Sumo Logic reads logs in the directory /var/opt/jfrog/artifactory/logs:
artifactory.logaccess.logrequest.logtraffic.*.log
Sample Logs
20170113185444|17|REQUEST|1.1.1.1|anonymous|GET|/cloudera-repos/org/slf4j/slf4j-log4j12/1.7.5/slf4j-log4j12-1.7.5.jar|HTTP/1.1|200|8869
20170113185444|0|DOWNLOAD|1.1.1.1|cloudera-repos:org/apache/spark/spark-catalyst_2.11/2.0.1/spark-catalyst_2.11-2.0.1.jar.sha1|40
2017-01-13 18:54:12,121 [ACCEPTED DEPLOY] pypi-remote-cache:.pypi/test.html for billythekid/1.1.1.1.
Sample Queries
_sourceCategory=*artifactory*
| where _sourceCategory matches "*artifactory/traffic"
| parse regex
"(?<year>\d{4})(?<month>\d{2})(?<day>\d{2})(?<hour>\d{2})(?<minute>\d{2})(?<second>\d{2})\|\d*\|(?<direction>[^|]*)\|\s*(?<ip>\d{1,3}\.\d{1,3}\.\d{1,3}\.\d{1,3}|[^|]*)\|(?<repo>[^:]*):(?<fullfilepath>[^|]*)\|(?<size>\d*)" nodrop
| timeslice 1h
| sum(size) by _timeslice, direction
| _sum / (1024 * 1024 * 1024) as sizeinGB | sort by _sum
| fields -_sum
| transpose row _timeslice column direction
_sourcecategory=*artifactory*
| where _sourceCategory matches "*artifactory/request"
| parse "*|*|*|*|*|*|*|*|*|*" as datetime, response_time, type, ip, user, method, path, protocol, status_code, size
| timeslice 10m
| count _timeslice, status_code | sort by _count
| transpose row _timeslice column status_code
_sourceCategory=*artifactory* "ACCEPTED DEPLOY" "-cache"
| where _sourceCategory matches "*artifactory/access"
| parse "[*] *:* for */*" as what, repo, path, user, ip
| parse regex field=ip "(?<ip>.*)\."
| where what = "ACCEPTED DEPLOY" and repo matches "*-cache"
| timeslice 10m
| count_distinct(path) as paths by _timeslice
| outlier paths
Collecting Logs
This section demonstrates how to collect logs from JFrog Artifactory into Sumo Logic.
Step 1: Activate the traffic.log file
To activate the traffic.log file, add the following parameter to your artifactory.system.properties file, located under $ARTIFACTORY/etc:
artifactory.traffic.collectionActive=true
A restart is required for traffic collection to take effect.
Step 2: Configure a Collector
Configure an Installed Collector.
Step 3: Configure Sources
In this step, you configure four local file sources, one for each log source listed in the table below. When you create a file source for a log type:
- Use the value from the File Path column below as the File Path for the source.
- The value you specify for the source's Source Category must end with the suffix shown below in the Source Category column. For example, you could set the Source Category for the Artifactory Server log source to be
foo/artifactory/console, but notartifactory/console/foo.
The following suffixes are required. For example, you could use _sourceCategory=<Foo>/artifactory/console, but the suffix artifactory/console must be used.
| Log source | File Path | Source Category |
| Artifactory Server | /var/opt/jfrog/artifactory/logs/artifactory.log | artifactory/console |
| Access | /var/opt/jfrog/artifactory/logs/access.log | artifactory/access |
| Request | /var/opt/jfrog/artifactory/logs/request.log | artifactory/request |
| Traffic | /var/opt/jfrog/artifactory/logs/traffic.*.log | artifactory/traffic |
_sourceCategory names are case sensitive. When you run a search using _sourceCategory, make sure you use the same case as you did when configuring the source.
For complete instructions, see Local File Source.
- Configure a Local File source.
- Configure the Source fields:
- Name. (Required) A name is required.
- Description is optional.
- Source Category. (Required)
- Configure the Advanced section:
- Enable Timestamp Parsing. True
- Time Zone. Logs are in UTC by default
- Timestamp Format. Auto Detect
- Encoding Type. UTF-8
- Multi-line Parsing. Detect Messages Spanning Multiple Lines, Infer Boundaries
- Click Save.
Field Extraction Rules
Here are Artifactory extraction rules that use different approaches.
_sourceCategory=*artifactory*
| where _sourceCategory matches "*artifactory/traffic"
| parse regex "(?<year>\d{4})(?<month>\d{2})(?<day>\d{2})(?<hour>\d{2})(?<minute>\d{2})(?<second>\d{2})\|\d*\|(?<direction>[^|]*)\|\s*(?<ip>\d{1,3}\.\d{1,3}\.\d{1,3}\.\d{1,3}|[^|]*)\|(?<repo>[^:]*):(?<fullfilepath>[^|]*)\|(?<size>\d*)" nodrop
_sourceCategory=*artifactory*
| where _sourceCategory matches "*artifactory/access"
| parse "[*] *:* for */*" as what, repo, path, user, ip
_sourceCategory=*artifactory*
| where _sourceCategory matches "*artifactory/request"
| parse "*|*|*|*|*|*|*|*|*|*" as datetime, response_time, type, ip, user, method, path, protocol, status_code, size
JFrog Artifactory 7
This procedure documents how to collect logs from JFrog Artifactory 7 into Sumo Logic.
Log Types
For each JFrog service, you will find its active log files in the $JFROG_HOME/<product>/var/log directory. For consistency, each log file is prefixed by its service name and a dash, <service-name>-service.log. For example, artifactory-service.log and router-request.log.
artifactory-service.logartifactory-access.logartifactory-request.logartifactory-traffic.*.log
For more information about Artifactory logs, see JFrog's Artifactory Log Files, Access Logs.
Sample Logs
20201322001341|d29f485ce89ehh3i|0|DOWNLOAD|167.208.229.190
|libs-release:org/springframework/spring-tx/maven-metadata.xml.sha1|117127
20201222001254|g104521a2b42cc3l|176.164.175.181|nitin|GET|/milestone/org/freemarker
/freemarker/maven-metadata.xml|404|761|86|1|curl/7.54.0
2020-13-22 00:13:33,014 [ACCEPTED DEPLOY]
jcenter-cache:com/cloudera/cdh/cdh-root/5.4.4-SNAPSHOT/maven-metadata.xml for client :
admin/149.5.95.40.
Sample Queries
_sourceCategory = Labs/artifactory/*
| where _sourceCategory matches "*artifactory/request"
| parse "*|*|*|*|*|*|*|*|*|*|*" as datetime, traceid, ip, user, method, path, status_code, response_size, request_size, response_time, user_agent
| where !(path matches "/ui*" ) and !(path matches "/webapp*")
| parse regex field=path "/(?<repo>[^\/]+).*" nodrop
| parse regex field=path "(?<with_api>/api/(?:(?:npm|ruby|deb|docker|vcs|bower|pypi)/|))(?<repo>[^\/]+)"
| count as count by repo
| sort by count
_sourceCategory = Labs/artifactory/* "login" DENIED
| where _sourceCategory matches "*artifactory/access"
| parse " [*] *" as event_type, user_info
| parse regex field=user_info "\s*for\s*\w+\s*:\s*(?<user>[^\/]+)\s*\/\s*(?<ip>\d{1,3}\.\d{1,3}\.\d{1,3}\.\d{1,3})\."| where event_type = "DENIED LOGIN"
| count as Attempts by ip, user
| sort by Attempts
_sourceCategory = Labs/artifactory/*
| where _sourceCategory matches "*artifactory/traffic"
| parse regex "(?<year>\d{4})(?<month>\d{2})(?<day>\d{2})(?<hour>\d{2})(?<minute>\d{2})(?<second>\d{2})\|(?<traceid>\w+)\|\d*\|(?<direction>[^|]*)\|\s*(?<ip>\d{1,3}\.\d{1,3}\.\d{1,3}\.\d{1,3}|[^|]*)\|(?<repo>[^:]*):(?<fullfilepath>[^|]*)\|(?<size>\d*)" nodrop
| where !isNull(ip) and ip != ""
| count as actions by ip
| lookup country_name, region, city from geo://location on ip = ip
| fields country_name, region, city, actions
| sort by actions | limit 10
Collecting Logs
Step 1: Activate the traffic.log file
- To activate the traffic.log file, add the following parameter to your artifactory.system.properties file, located under $ARTIFACTORY/etc:
$JFROG_HOME/artifactory/var/etc/artifactory/artifactory.system.properties - A restart is required for traffic collection to take effect.
Step 2: Configure a collector
Configure an Installed Collector.
Step 3: Configure sources
In this step, you configure four local file sources, one for each log source listed in the table below. When you create a file source for a log type:
- Use the value from the File Path column below as the File Path for the source.
- The value you specify for the source's Source Category must end with the suffix shown below in the Source Category column. For example, you could set the Source Category for the Artifactory Server log source to be
foo/artifactory/console, but not artifactory/console/foo
The following suffixes are required. For example, you could use _sourceCategory=<Foo>/artifactory/console, but the suffix artifactory/console must be used.
| Log source | File Path | Source Category |
| Artifactory Server and other microservices | $JFROG_HOME/<product>/var/log/artifactory-service.log | artifactory/console |
| Access | $JFROG_HOME/artifactory/var/artifactory/log/artifactory-access.log. | artifactory/access |
| Request | $JFROG_HOME/<product>/var/log/artifactory-request.log | artifactory/request |
| Traffic | $JFROG_HOME/<product>/var/log/artifactory-traffic.*.log | artifactory/traffic |
Remember that _sourceCategory names are case sensitive. When you run a search using _sourceCategory, make sure you use the same case as you did when configuring the source.
For complete instructions, see Local File Source.
- Configure a Local File source.
- Configure the Source fields:
- Name. (Required) A name is required.
- Description is optional.
- Source Category. (Required)
- Configure the Advanced section:
- Enable Timestamp Parsing. True
- Time Zone. Logs are in UTC by default
- Timestamp Format. Auto Detect
- Encoding Type. UTF-8
- Multi-line Parsing. Detect Messages Spanning Multiple Lines, Infer Boundaries
- Click Save.
Installing the Artifactory App
Now that you have set up collection, install the Sumo Logic App for Artifactory to use the pre-configured searches and Dashboards that provide insight into your data.
To install the app:
Locate and install the app you need from the App Catalog. If you want to see a preview of the dashboards included with the app before installing, click Preview Dashboards.
- From the App Catalog, search for and select the app.
- Select the version of the service you're using and click Add to Library. Version selection is applicable only to a few apps currently. For more information, see Installing the Apps from the Library.
- To install the app, complete the following fields.
- App Name. You can retain the existing name, or enter a name of your choice for the app.
- Data Source. Select either of these options for the data source.
- Choose Source Category, and select a source category from the list.
- Choose Enter a Custom Data Filter, and enter a custom source category beginning with an underscore. Example: (
_sourceCategory=MyCategory).
- Advanced. Select the Location in Library (the default is the Personal folder in the library), or click New Folder to add a new folder.
- Click Add to Library.
Once an app is installed, it will appear in your Personal folder, or other folder that you specified. From here, you can share it with your organization.
Panels will start to fill automatically. It's important to note that each panel slowly fills with data matching the time range query and received since the panel was created. Results won't immediately be available, but with a bit of time, you'll see full graphs and maps.
Viewing JFrog Artifactory Dashboards
Overview
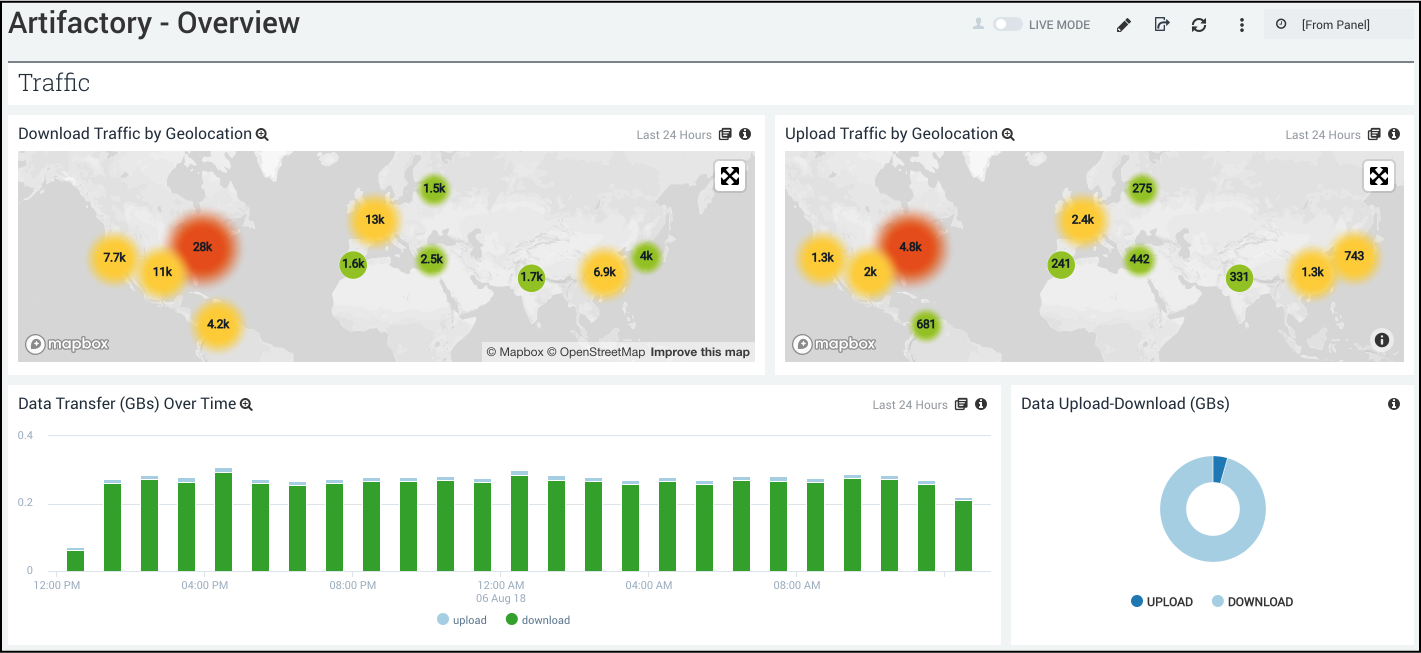
Traffic
Download Traffic by Geolocation. Uses a geo lookup operation to display download traffic by IP address on a map of the world for the last 24 hours.
Upload Traffic by Geolocation. Uses a geo lookup operation to display upload traffic by IP address on a map of the world for the last 24 hours.
Data Transfers (GBs) Over Time. Displays data transfers in GBs for uploads and downloads as a stacked column chart on a timeline for the last 24 hours.
Data Upload-Download (GBs). Compares the upload and download count in GB displayed in a pie chart for the last 24 hours.
Request
Requests by Status Code (Every 10 Minutes). Displays requests by status code every 10 minutes in a stacked column chart on a timeline for the last 24 hours.
Requests by Repo. Shows the number of requests by repo as a bar chart for the last 24 hours.
5xx Status Codes. Displays the number of 5xx status codes in a single value chart for the last 24 hours.
Activity
Non-Cached Accepted Deploys by Repo. Shows information about non-cached accepted deploys by repo in a table chart, including details on the repo and count, for the last 24 hours.
Cache Hit Ratio. Displays information on the cache hit ratio in a table chart, including details on repo, accepted cache deploy, accepted cache downloads, and cache hit ratio for the last 24 hours.
Accepted Downloads by Repo. Shows information on accepted downloads by repo including details on repo and count for the last 24 hours.
Remote Download Size (GB). Displays the remote download size in GBs as a single value chart for the last 24 hours.
Remote Incomplete Downloads. Displays the remote incomplete downloads in GB as a single value chart for the last 24 hours.
Traffic
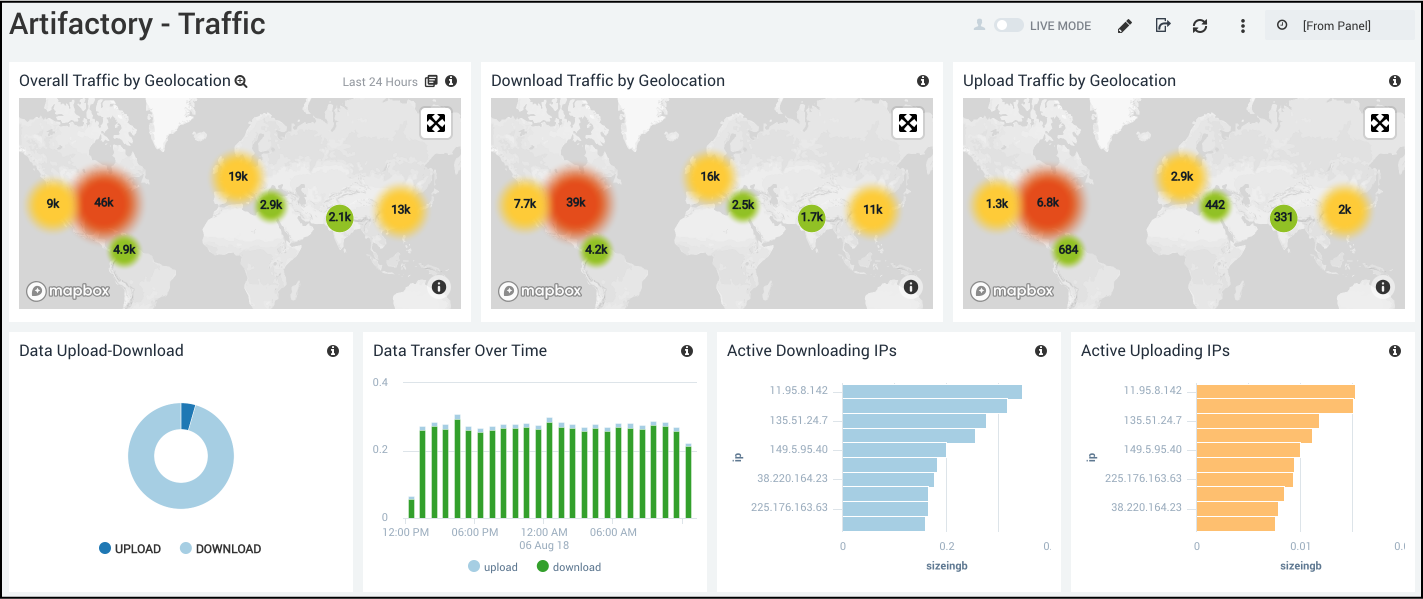
Overall Traffic by Geolocation. Uses a geo lookup operation to display overall traffic by IP address on a map of the world for the last 24 hours.
Download Traffic by Geolocation. Uses a geo lookup operation to display download traffic by IP address on a map of the world for the last 24 hours.
Upload Traffic by Geolocation. Uses a geo lookup operation to display upload traffic by IP address on a map of the world for the last 24 hours.
Data Upload-Download. Compares the upload and download count in GB displayed in a pie chart for the last 24 hours.
Data Transfer Over Time. Displays the amount of data transferred by upload and download over time as a stacked column chart on a timeline for the last 24 hours.
Active Downloading IPs. Shows the top 10 active downloading IPs in GB in a bar chart for the last 24 hours.
Active Uploading IPs. Provides the top 10 active uploading IPs in GB in a bar chart for the last 24 hours.
Most Active Repos by Data Transfer. Displays the top 10 most active repos by data transfer in GB in a bar chart for the last 24 hours.
Most Active Repos by Action. Shows the top 10 most active repos by action in GB in a bar chart for the last 24 hours.
Most Active IPs by Action. Provides information on the top 10 most active IPs by action in GB in a bar chart for the last 24 hours.
Most Active Locations. This aggregation table provides a list of the top 10 most active locations by country name, region, city, and the number of actions for the last 24 hours.
Top Referred Files. Displays a list of the top 10 referred files by file path and number of actions in an aggregation table for the last 24 hours.
Request and Access
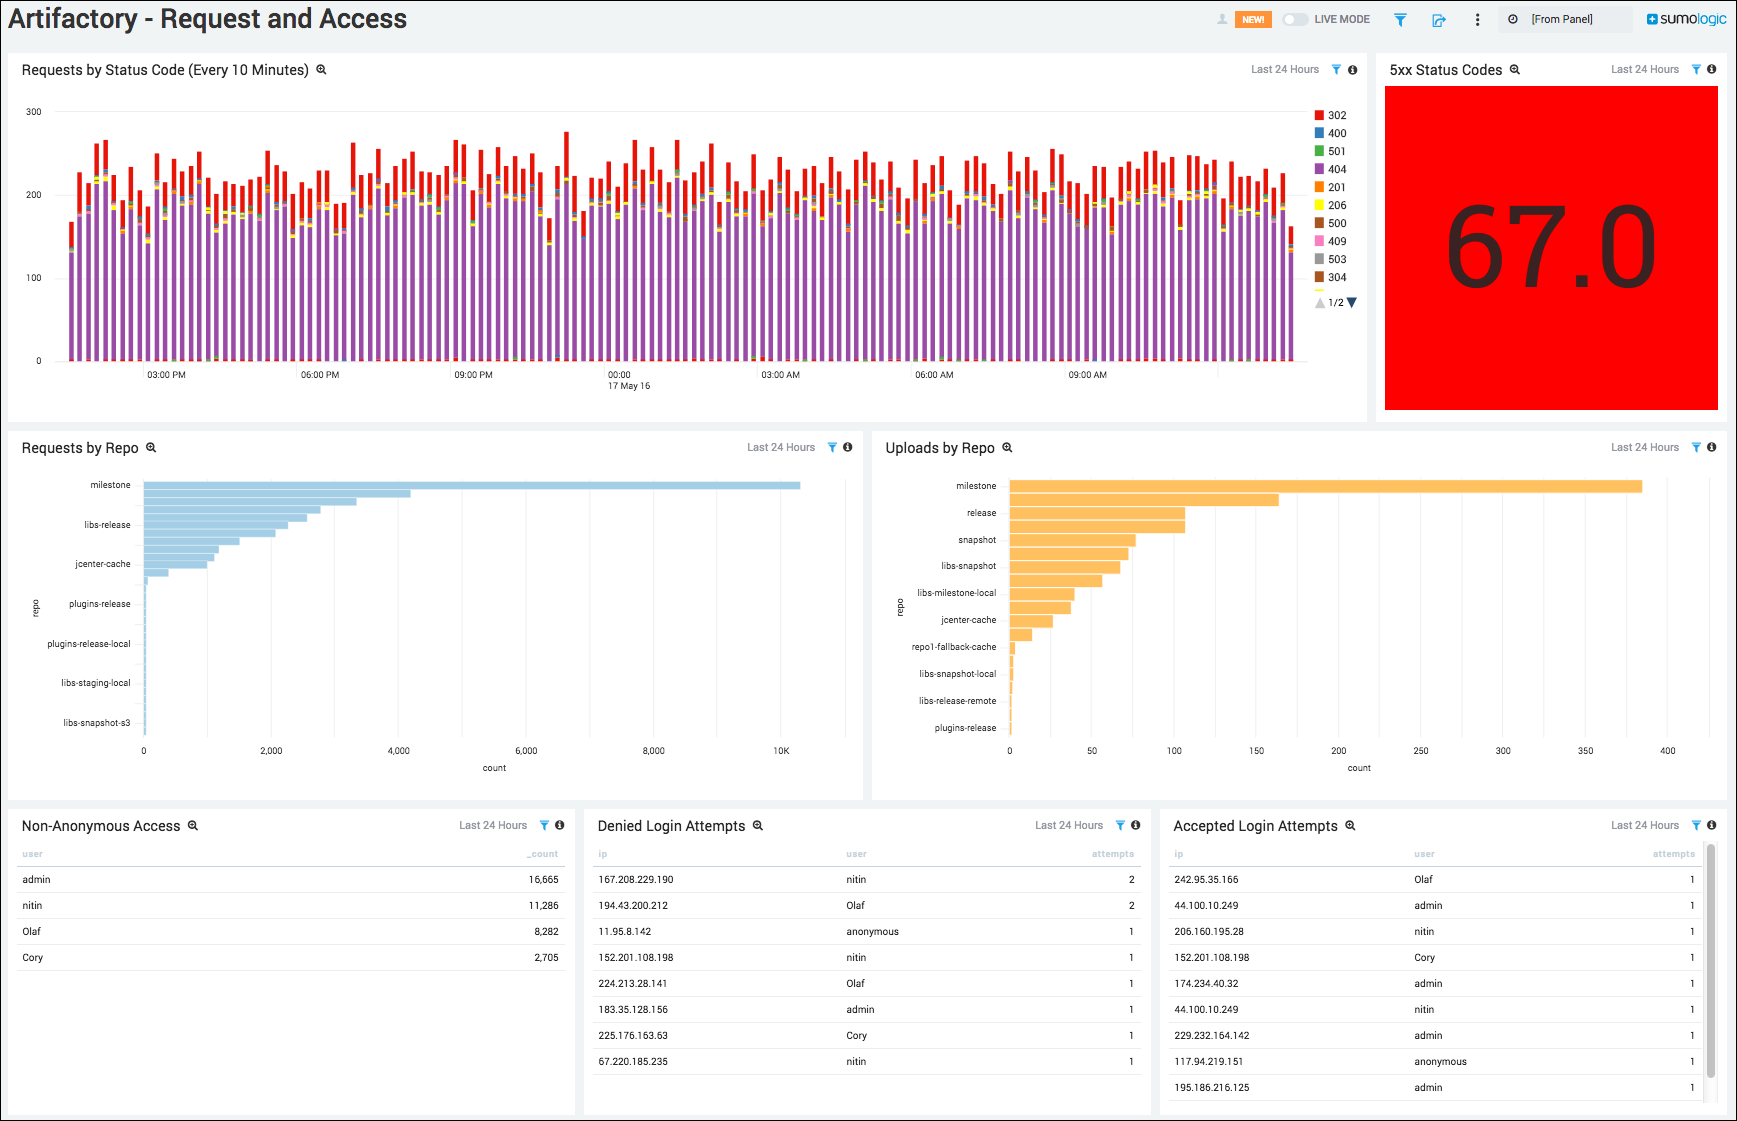
Requests by Status Code (Every 10 Minutes). Displays requests by status code every 10 minutes in a stacked column chart on a timeline for the last 24 hours.
5xx Status Codes. Provides the number of 5xx status codes in a single value chart for the last 24 hours.
Requests by Repo. Shows the number of requests by repo as a bar chart for the last 24 hours.
Uploads by Repo. Displays the number of uploads by repo as a bar chart for the last 24 hours.
Non-Anonymous Access. Displays the top 10 accepted non-anonymous access attempts in a table chart, including details on user name and count for the last 24 hours.
Denied Login Attempts. Displays the number of denied login attempts in a table chart, including details on IP address, user name, and number of attempts for the last 24 hours.
Accepted Login Attempts. Shows the number of accepted login attempts in a table chart, including details on IP address, user name, and number of attempts for the last 24 hours.
Download Activity
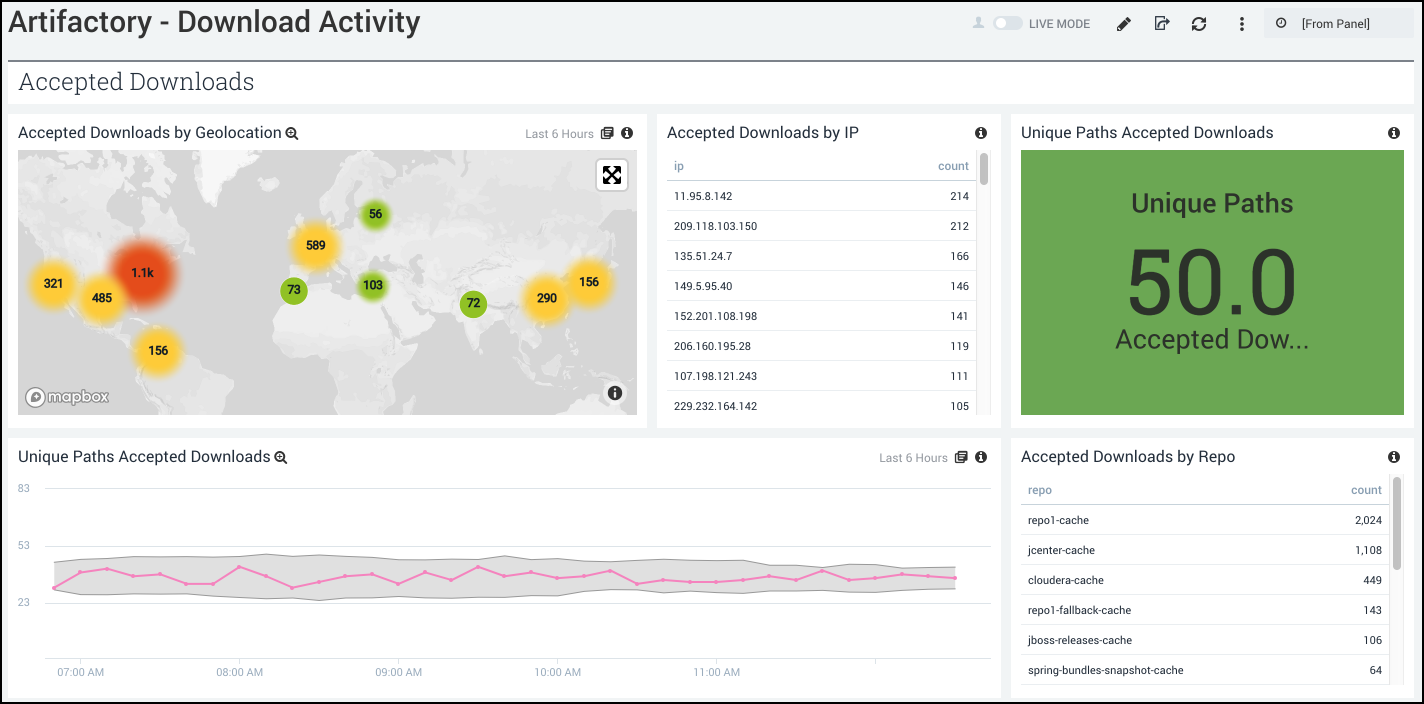
Accepted Downloads
Accepted Downloads by Geolocation. Uses a geo lookup operation to display accepted downloads by IP address on a map of the world for the last six hours.
Accepted Downloads by IP. Displays the number of accepted downloads by IP address in an aggregation table for the last six hours.
Unique Paths Accepted Downloads. Shows the number of unique paths of accepted downloads in a single value chart for the last six hours.
Unique Paths Accepted Downloads. Provides details on the number of unique paths of accepted downloads in a outlier combo chart on a timeline for the last six hours.
Accepted Downloads by Repo. Displays the number of accepted downloads by repo in an aggregation table for the last six hours.
Denied Downloads
Denied Downloads by Geolocation. Uses a geo lookup operation to display denied downloads by IP address on a map of the world for the last six hours.
Denied Downloads by IP. Displays the number of denied downloads by IP address in an aggregation table for the last six hours.
Unique Paths Denied. Shows the number of unique paths of denied downloads in a single value chart for the last six hours.
Unique Paths Denied Downloads. Provides details on the number of unique paths of denied downloads in a outlier combo chart on a timeline for the last six hours.
Denied Downloads by Repo. Provides details on the number of denied downloads per repo in an aggregation table for the last six hours.
Cached Deployment Activity
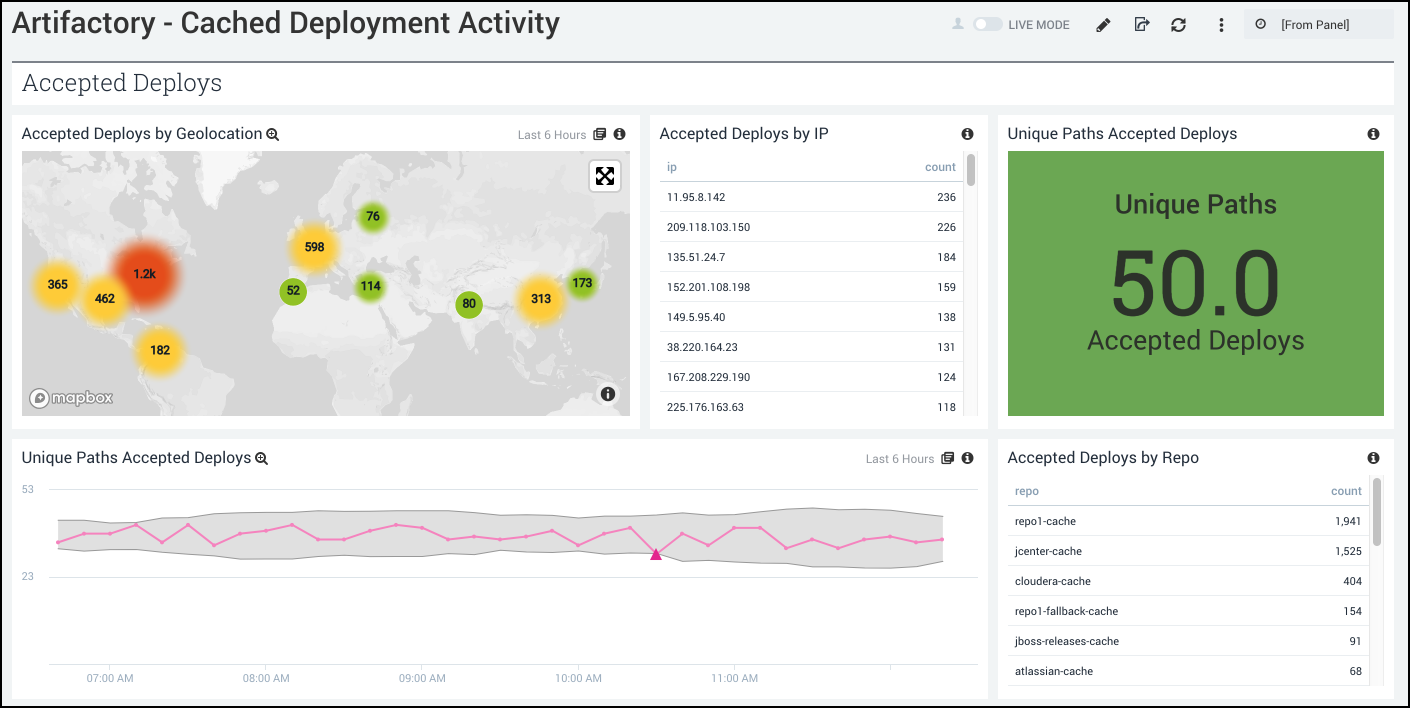
Accepted Deploys
Accepted Deploys by Geolocation. Uses a geo lookup operation to display accepted deploys by IP address on a map of the world for the last six hours.
Accepted Deploys by IP. Displays the number of accepted deploys by IP address in an aggregation table for the last six hours.
Unique Paths Accepted. Shows the number of unique paths of accepted deploys in a single value chart for the last six hours.
Unique Paths Accepted Deploys. Provides details on the number of unique paths of accepted deploys in a outlier combo chart on a timeline for the last six hours.
Accepted Deploys by Repo. Displays the number of accepted deploys by repo in an aggregation table for the last six hours.
Denied Deploys
Denied Deploys by Geolocation. Uses a geo lookup operation to display denied deploys by IP address on a map of the world for the last six hours.
Denied Deploys by IP. Displays the number of denied deploys by IP address in an aggregation table for the last six hours.
Unique Paths Denied Deploys. Shows the number of unique paths of denied deploys in a single value chart for the last six hours.
Unique Paths Denied Deploys. Provides details on the number of unique paths of denied deploys in a outlier combo chart on a timeline for the last six hours.
Denied Deploys by Repo. Provides details on the number of denied downloads per repo in an aggregation table for the last six hours.
Non-Cached Deployment Activity
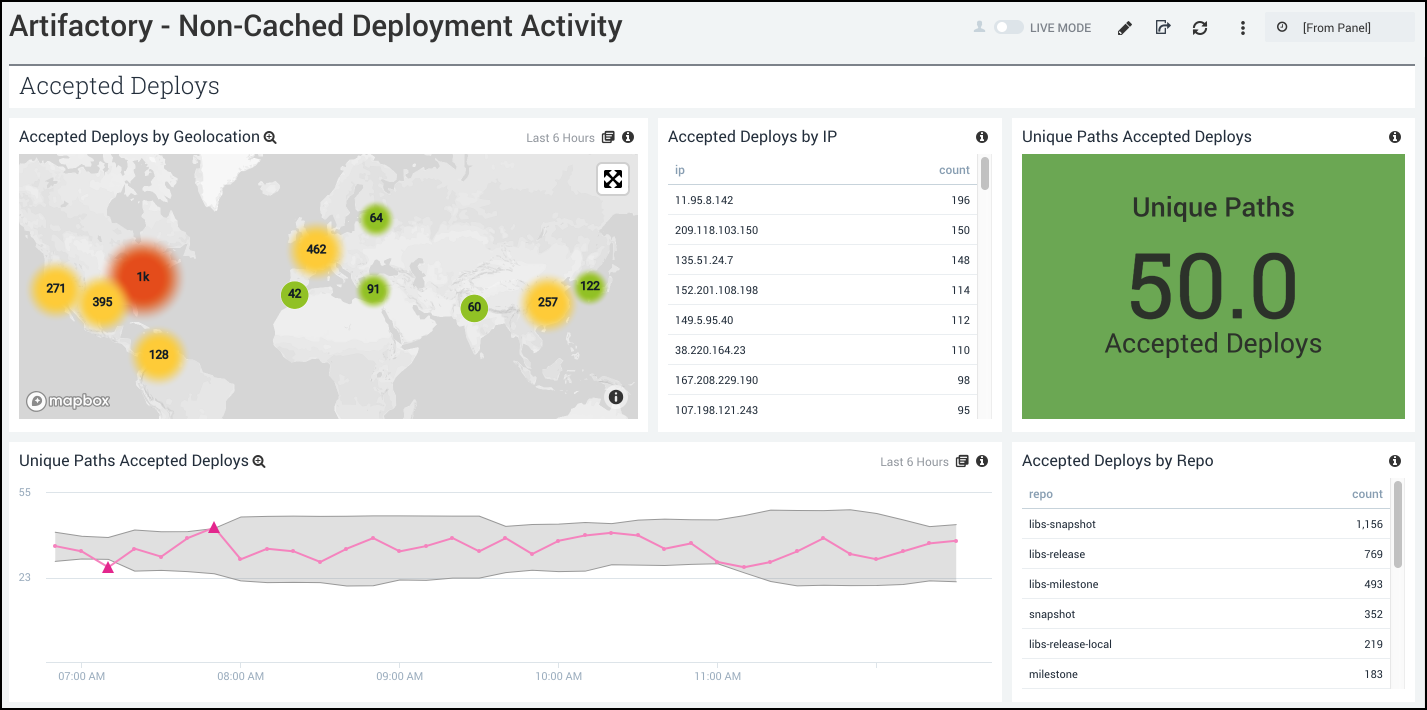
Accepted Deploys
Accepted Deploys by Geolocation. Uses a geo lookup operation to display accepted deploys by IP address on a map of the world for the last six hours.
Accepted Deploys by IP. Displays the number of accepted deploys by IP address in an aggregation table for the last six hours.
Unique Paths Accepted Deploys. Shows the number of unique paths of accepted deploys in a single value chart for the last six hours.
Unique Paths Accepted Deploys. Provides details on the number of unique paths of accepted deploys in a outlier combo chart on a timeline for the last six hours.
Accepted Deploys by Repo. Displays the number of accepted deploys by repo in an aggregation table for the last six hours.
Denied Deploys
Denied Deploys. Shows the number of denied deploys in a single value chart for the last six hours.
Denied Deploys Detail. Displays details on the number of denied deploys in an aggregation table, including IP address, repo name, user, path, and count for the last six hours.