Java Management Extensions (JMX)

Java Management Extensions (JMX) is a standard component of the Java Platform. JMX gives developers a standard and simple way to manage resources, including services, devices, and applications. JMX is dynamic, so you can manage and monitor resources as soon as they are created, implemented, or installed.
The Sumo Logic App for JMX allows you to analyze and gain insights about Java applications. The dashboards provide a quick glance at various deployment metrics like memory, CPU, GC performance, and thread behavior, so you can troubleshoot unexpected behavior in your Java environment and the applications running in it.
Metric Types
The Sumo Logic App for JMX collects Prometheus metrics from Java applications, via the Jolokia Plugin for telegraf.
The following types of metrics are collected from JMX:
- CPU Metrics
- Garbage Collection
- Memory
- Memory Pool
- Compilation
- Threads
- ClassLoader
Sample Query
This query sample is from the CPU Load Vs Current Threads panel of JMX - Overview dashboard.
_sourceCategory=Labs/jmx/metrics
metric=java_lang_OperatingSystem_TotalMemorySize jolokia_agent_url={{Server}} | eval (_value / 1024 / 1024 / 1024) | sum
Collecting Metrics for JMX
This section explains how to collect metrics from JMX and ingest them into Sumo Logic to use with the predefined dashboards and searches in the JMX app.
You can collect JMX metrics using the Jolokia Plugin for telegraf. You can configure the metrics in the Jolokia Plugin configuration and these metrics are exposed on a URL.
These metrics are then forwarded to Sumo Logic HTTP Source. The collection starts at the current time.
- Non-Kubernetes environments
- Kubernetes environments
Step 1: Metric Collection in Non-Kubernetes Environment
This section provides instructions for configuring metrics collection for the Sumo Logic App for JMX. Follow the below instructions to set up the metric collection.
- Configure metrics for JMX. To configure JMX metrics using Jolokia, do the following:
- Download the latest Jolokia JVM agent from Jolokia.
- You can attach the Jolokia JVM agent jar as a Java Agent to your application.
- Replace parameter
agentContextwith a value as per your environment or jmx instance.java ... -javaagent:jolokia-jvm-1.6.2-agent.jar=port=8778,host=localhost,agentContext=/${agentContext} ... - Alternatively, you can also attach process to the Jolokia JVM agent.
More information can be found using a JVM agent. Make a note of the URL that will be used in telegraf configuration.# List available applications
java -jar ./jolokia-jvm-1.6.2-agent.jar list
# 156 ./jolokia-jvm-1.6.2-agent.jar list
# 6 org.apache.catalina.startup.Bootstrap start
# Attach to the application which should be monitored
java -jar ./jolokia-jvm-1.6.2-agent.jar --agentContext /${agentContext} start 6
#Jolokia is already attached to PID 723#http://127.0.0.1:8778/${agentContext}/ - Configure a Hosted Collector. To create a new Sumo Logic hosted collector, perform the steps in the Configure a Hosted Collector section of the Sumo Logic documentation
- Configure a HTTP Logs and Metrics Source. Create a new HTTP Logs and Metrics Source in the hosted collector created above by following these instructions.
- Make a note of HTTP Source URL.
- Install Telegraf. Use the following steps to install Telegraf.
- Configure and start Telegraf. Create a file called telegraf.conf and add the appropriate configuration. The following is a basic example:
Metrics filtering is done by whitelisting the metrics we want through name/mbean/paths configuration.
[agent]
  interval = "60s"
[[inputs.jolokia2_agent]]
  urls = ["<Jolokia URL from Step 1>"]
   [[inputs.jolokia2_agent.metric]]
name  = "java_lang_ClassLoading"
mbean = "java.lang:type=ClassLoading"
paths = ["LoadedClassCount", "TotalLoadedClassCount", "UnloadedClassCount"]
  [[inputs.jolokia2_agent.metric]]
name  = "java_lang_Compilation"
mbean = "java.lang:type=Compilation"
paths = ["TotalCompilationTime"]
  [[inputs.jolokia2_agent.metric]]
name  = "java_lang_GarbageCollector"
mbean = "java.lang:name=*,type=GarbageCollector"
paths = ["CollectionCount", "CollectionTime", "LastGcInfo"]
tag_keys = ["name"]
  [[inputs.jolokia2_agent.metric]]
name  = "java_lang_MemoryPool"
mbean = "java.lang:name=*,type=MemoryPool"
paths = ["CollectionUsage", "CollectionUsageThresholdSupported", "PeakUsage", "Usage", "UsageThresholdSupported"]
tag_keys = ["name"]
  [[inputs.jolokia2_agent.metric]]
name  = "java_lang_Memory"
mbean = "java.lang:type=Memory"
paths = ["HeapMemoryUsage", "NonHeapMemoryUsage", "ObjectPendingFinalizationCount"]
  [[inputs.jolokia2_agent.metric]]
name  = "java_lang_OperatingSystem"
mbean = "java.lang:type=OperatingSystem"
paths = ["AvailableProcessors", "CommittedVirtualMemorySize", "FreePhysicalMemorySize", "FreeSwapSpaceSize", "MaxFileDescriptorCount", "OpenFileDescriptorCount", "ProcessCpuLoad", "ProcessCpuTime", "SystemCpuLoad", "SystemLoadAverage", "TotalPhysicalMemorySize", "TotalSwapSpaceSize"]
  [[inputs.jolokia2_agent.metric]]
name  = "java_lang_Runtime"
mbean = "java.lang:type=Runtime"
paths = ["BootClassPathSupported", "StartTime", "Uptime"]
  [[inputs.jolokia2_agent.metric]]
name  = "java_lang_Threading"
mbean = "java.lang:type=Threading"
paths = ["CurrentThreadCpuTime", "CurrentThreadUserTime", "DaemonThreadCount", "ObjectMonitorUsageSupported", "PeakThreadCount", "SynchronizerUsageSupported", "ThreadContentionMonitoringEnabled", "ThreadContentionMonitoringSupported", "ThreadCount", "ThreadCpuTimeEnabled", "ThreadCpuTimeSupported", "TotalStartedThreadCount"]
  -- Metrics which are unavailable for some of the jvm implementations
  -- Added in jdk14
  [[inputs.jolokia2_agent.metric]]
name  = "java_lang_OperatingSystem"
mbean = "java.lang:type=OperatingSystem"
paths = ["FreeMemorySize", "TotalMemorySize"]
  -- not available for jdk8
  [[inputs.jolokia2_agent.metric]]
name  = "java_lang_Runtime"
mbean = "java.lang:type=Runtime"
paths = ["Pid"]
  ## Added in jdk14
  [[inputs.jolokia2_agent.metric]]
name  = "java_lang_Threading"
mbean = "java.lang:type=Threading"
paths = ["CurrentThreadAllocatedBytes"]
  -- Not available for adoptopenjdk-openj9
  [[inputs.jolokia2_agent.metric]]
name  = "java_lang_Threading"
mbean = "java.lang:type=Threading"
paths = ["ThreadAllocatedMemoryEnabled", "ThreadAllocatedMemorySupported"]
-- The processor regex converts url like http://127.0.0.1:8778/${agentContext} to agentContext
[[processors.regex]]
  [[processors.regex.tags]]
    key = "jolokia_agent_url"
    pattern = '.*?([a-zA-Z0-9-_]+)[\/]?$'
    replacement = "${1}"
[[outputs.sumologic]]
  url = "<URL Created in Step 3>"
  data_format = "prometheus"
interval. This is the frequency to send data to Sumo Logic, in this example, we will send the metrics every 60 seconds. Please refer to this doc for more parameters that can be configured in the Telegraf agent globally.urls. The url to the Jolokia server. This can be a comma-separated list to connect to multiple Jolokia servers. Please refer to this doc for more information on configuring the Jolokia input plugin for Telegraf.url. This is the HTTP source URL created in step 3. Refer to this doc for more information on configuring the Sumo Logic Telegraf output plugin.data_format. The format to use when sending data to Sumo Logic. Please refer to this doc for more information on configuring the Sumo Logic Telegraf output plugin.
After you have finalized your telegraf.conf file, you can run the following command to start telegraf.
telegraf --config /path/to/telegraf.conf
Step 2: Metric Collection in Kubernetes Environment
The following steps assume you are collecting JMX metrics from a Kubernetes environment. In Kubernetes environments, we use the Telegraf Operator, which is packaged with our Kubernetes collection. You can learn more about this here.
- Set up Kubernetes Collection with the Telegraf Operator.
- On your Pods, add the following annotations to configure Telegraf.
Ensure that Prometheus passes all metrics to Sumo Logic. If you use the below annotations to configure Telegraf, it should work correctly, otherwise, refer to this doc.
annotations:
        telegraf.influxdata.com/inputs: |+
          [[inputs.jolokia2_agent]]
            urls = ["http://127.0.0.1:8778/jolokia"]
            [[inputs.jolokia2_agent.metric]]
              name  = "java_lang_ClassLoading"
              mbean = "java.lang:type=ClassLoading"
              paths = ["LoadedClassCount", "TotalLoadedClassCount", "UnloadedClassCount"]
            [[inputs.jolokia2_agent.metric]]
              name  = "java_lang_Compilation"
              mbean = "java.lang:type=Compilation"
              paths = ["TotalCompilationTime"]
            [[inputs.jolokia2_agent.metric]]
              name  = "java_lang_GarbageCollector"
              mbean = "java.lang:name=*,type=GarbageCollector"
              paths = ["CollectionCount", "CollectionTime", "LastGcInfo"]
              tag_keys = ["name"]
            [[inputs.jolokia2_agent.metric]]
              name  = "java_lang_MemoryPool"
              mbean = "java.lang:name=*,type=MemoryPool"
              paths = ["CollectionUsage", "CollectionUsageThresholdSupported", "PeakUsage", "Usage", "UsageThresholdSupported"]
              tag_keys = ["name"]
            [[inputs.jolokia2_agent.metric]]
              name  = "java_lang_Memory"
              mbean = "java.lang:type=Memory"
              paths = ["HeapMemoryUsage", "NonHeapMemoryUsage", "ObjectPendingFinalizationCount"]
            [[inputs.jolokia2_agent.metric]]
              name  = "java_lang_OperatingSystem"
              mbean = "java.lang:type=OperatingSystem"
              paths = ["AvailableProcessors", "CommittedVirtualMemorySize", "FreePhysicalMemorySize", "FreeSwapSpaceSize", "MaxFileDescriptorCount", "OpenFileDescriptorCount", "ProcessCpuLoad", "ProcessCpuTime", "SystemCpuLoad", "SystemLoadAverage", "TotalPhysicalMemorySize", "TotalSwapSpaceSize"]
            [[inputs.jolokia2_agent.metric]]
              name  = "java_lang_Runtime"
              mbean = "java.lang:type=Runtime"
              paths = ["BootClassPathSupported", "StartTime", "Uptime"]
            [[inputs.jolokia2_agent.metric]]
              name  = "java_lang_Threading"
              mbean = "java.lang:type=Threading"
              paths = ["CurrentThreadCpuTime", "CurrentThreadUserTime", "DaemonThreadCount", "ObjectMonitorUsageSupported", "PeakThreadCount", "SynchronizerUsageSupported", "ThreadContentionMonitoringEnabled", "ThreadContentionMonitoringSupported", "ThreadCount", "ThreadCpuTimeEnabled", "ThreadCpuTimeSupported", "TotalStartedThreadCount"]
            -- Metrics which are unavailable for some of the jvm implementations
            -- Added in jdk14
            [[inputs.jolokia2_agent.metric]]
              name  = "java_lang_OperatingSystem"
              mbean = "java.lang:type=OperatingSystem"
              paths = ["FreeMemorySize", "TotalMemorySize"]
            -- not available for jdk8
            [[inputs.jolokia2_agent.metric]]
              name  = "java_lang_Runtime"
              mbean = "java.lang:type=Runtime"
              paths = ["Pid"]
            -- Added in jdk14
            [[inputs.jolokia2_agent.metric]]
              name  = "java_lang_Threading"
              mbean = "java.lang:type=Threading"
              paths = ["CurrentThreadAllocatedBytes"]
            -- Not available for adoptopenjdk-openj9
            [[inputs.jolokia2_agent.metric]]
              name  = "java_lang_Threading"
              mbean = "java.lang:type=Threading"
              paths = ["ThreadAllocatedMemoryEnabled", "ThreadAllocatedMemorySupported"]
        -- The processor regex converts url like http://127.0.0.1:8778/jolokia to hostname
          [[processors.override]]
            [processors.override.tags]
              jolokia_agent_url = "$HOSTNAME"
          telegraf.influxdata.com/class: sumologic-prometheus
          telegraf.influxdata.com/limits-cpu: '750m'
          prometheus.io/scrape: "true"
          prometheus.io/port: "9273"
telegraf.influxdata.com/inputs- This contains the required configuration for the Telegraf Jolokia Input plugin. Please refer to this doc for more information on configuring the Jolokia input plugin for Telegraf. Note: As telegraf will be run as a sidecar, the host should always be localhost.telegraf.influxdata.com/class: sumologic-prometheus- This instructs the Telegraf operator what output to use. This should not be changed.prometheus.io/scrape: "true"- This ensures our Prometheus will scrape the metrics.prometheus.io/port: "9273"- This tells Prometheus what ports to scrape on. This should not be changed.
Sample Metric Names
| Metric Type | Sample |
| CPU | java_lang_OperatingSystem_ProcessCpuLoad |
| GC | java_lang_GarbageCollector_LastGcInfo_duration |
| Memory | java_lang_Memory_NonHeapMemoryUsage_committed |
| Threads | java_lang_Threading_ThreadCount |
| ClassLoader | java_lang_ClassLoading_LoadedClassCount |
Install the JMX App
This section has instructions for installing the Sumo App for JMX.
To install the app:
Locate and install the app you need from the App Catalog. If you want to see a preview of the dashboards included with the app before installing, click Preview Dashboards.
- From the App Catalog, search for and select the app.
- Select the version of the service you're using and click Add to Library.
Version selection is applicable only to a few apps currently. For more information, see Installing the Apps from the Library.
- To install the app, complete the following fields.
- App Name. You can retain the existing name, or enter a name of your choice for the app.
- Data Source. Select either of these options for the data source.
- Choose Source Category, and select a source category from the list.
- Choose Enter a Custom Data Filter, and enter a custom source category beginning with an underscore. Example: (
_sourceCategory=MyCategory).
- Advanced. Select the Location in Library (the default is the Personal folder in the library), or click New Folder to add a new folder.
- Click Add to Library.
Once an app is installed, it will appear in your Personal folder, or other folder that you specified. From here, you can share it with your organization.
Panels will start to fill automatically. It's important to note that each panel slowly fills with data matching the time range query and received since the panel was created. Results won't immediately be available, but with a bit of time, you'll see full graphs and maps.
Viewing JMX Dashboards
Template variables provide dynamic dashboards that can rescope data on the fly. As you apply variables to troubleshoot through your dashboard, you view dynamic changes to the data for a quicker resolution to the root cause. You can use template variables to drill down and examine the data on a granular level. For more information, see Filter with template variables.
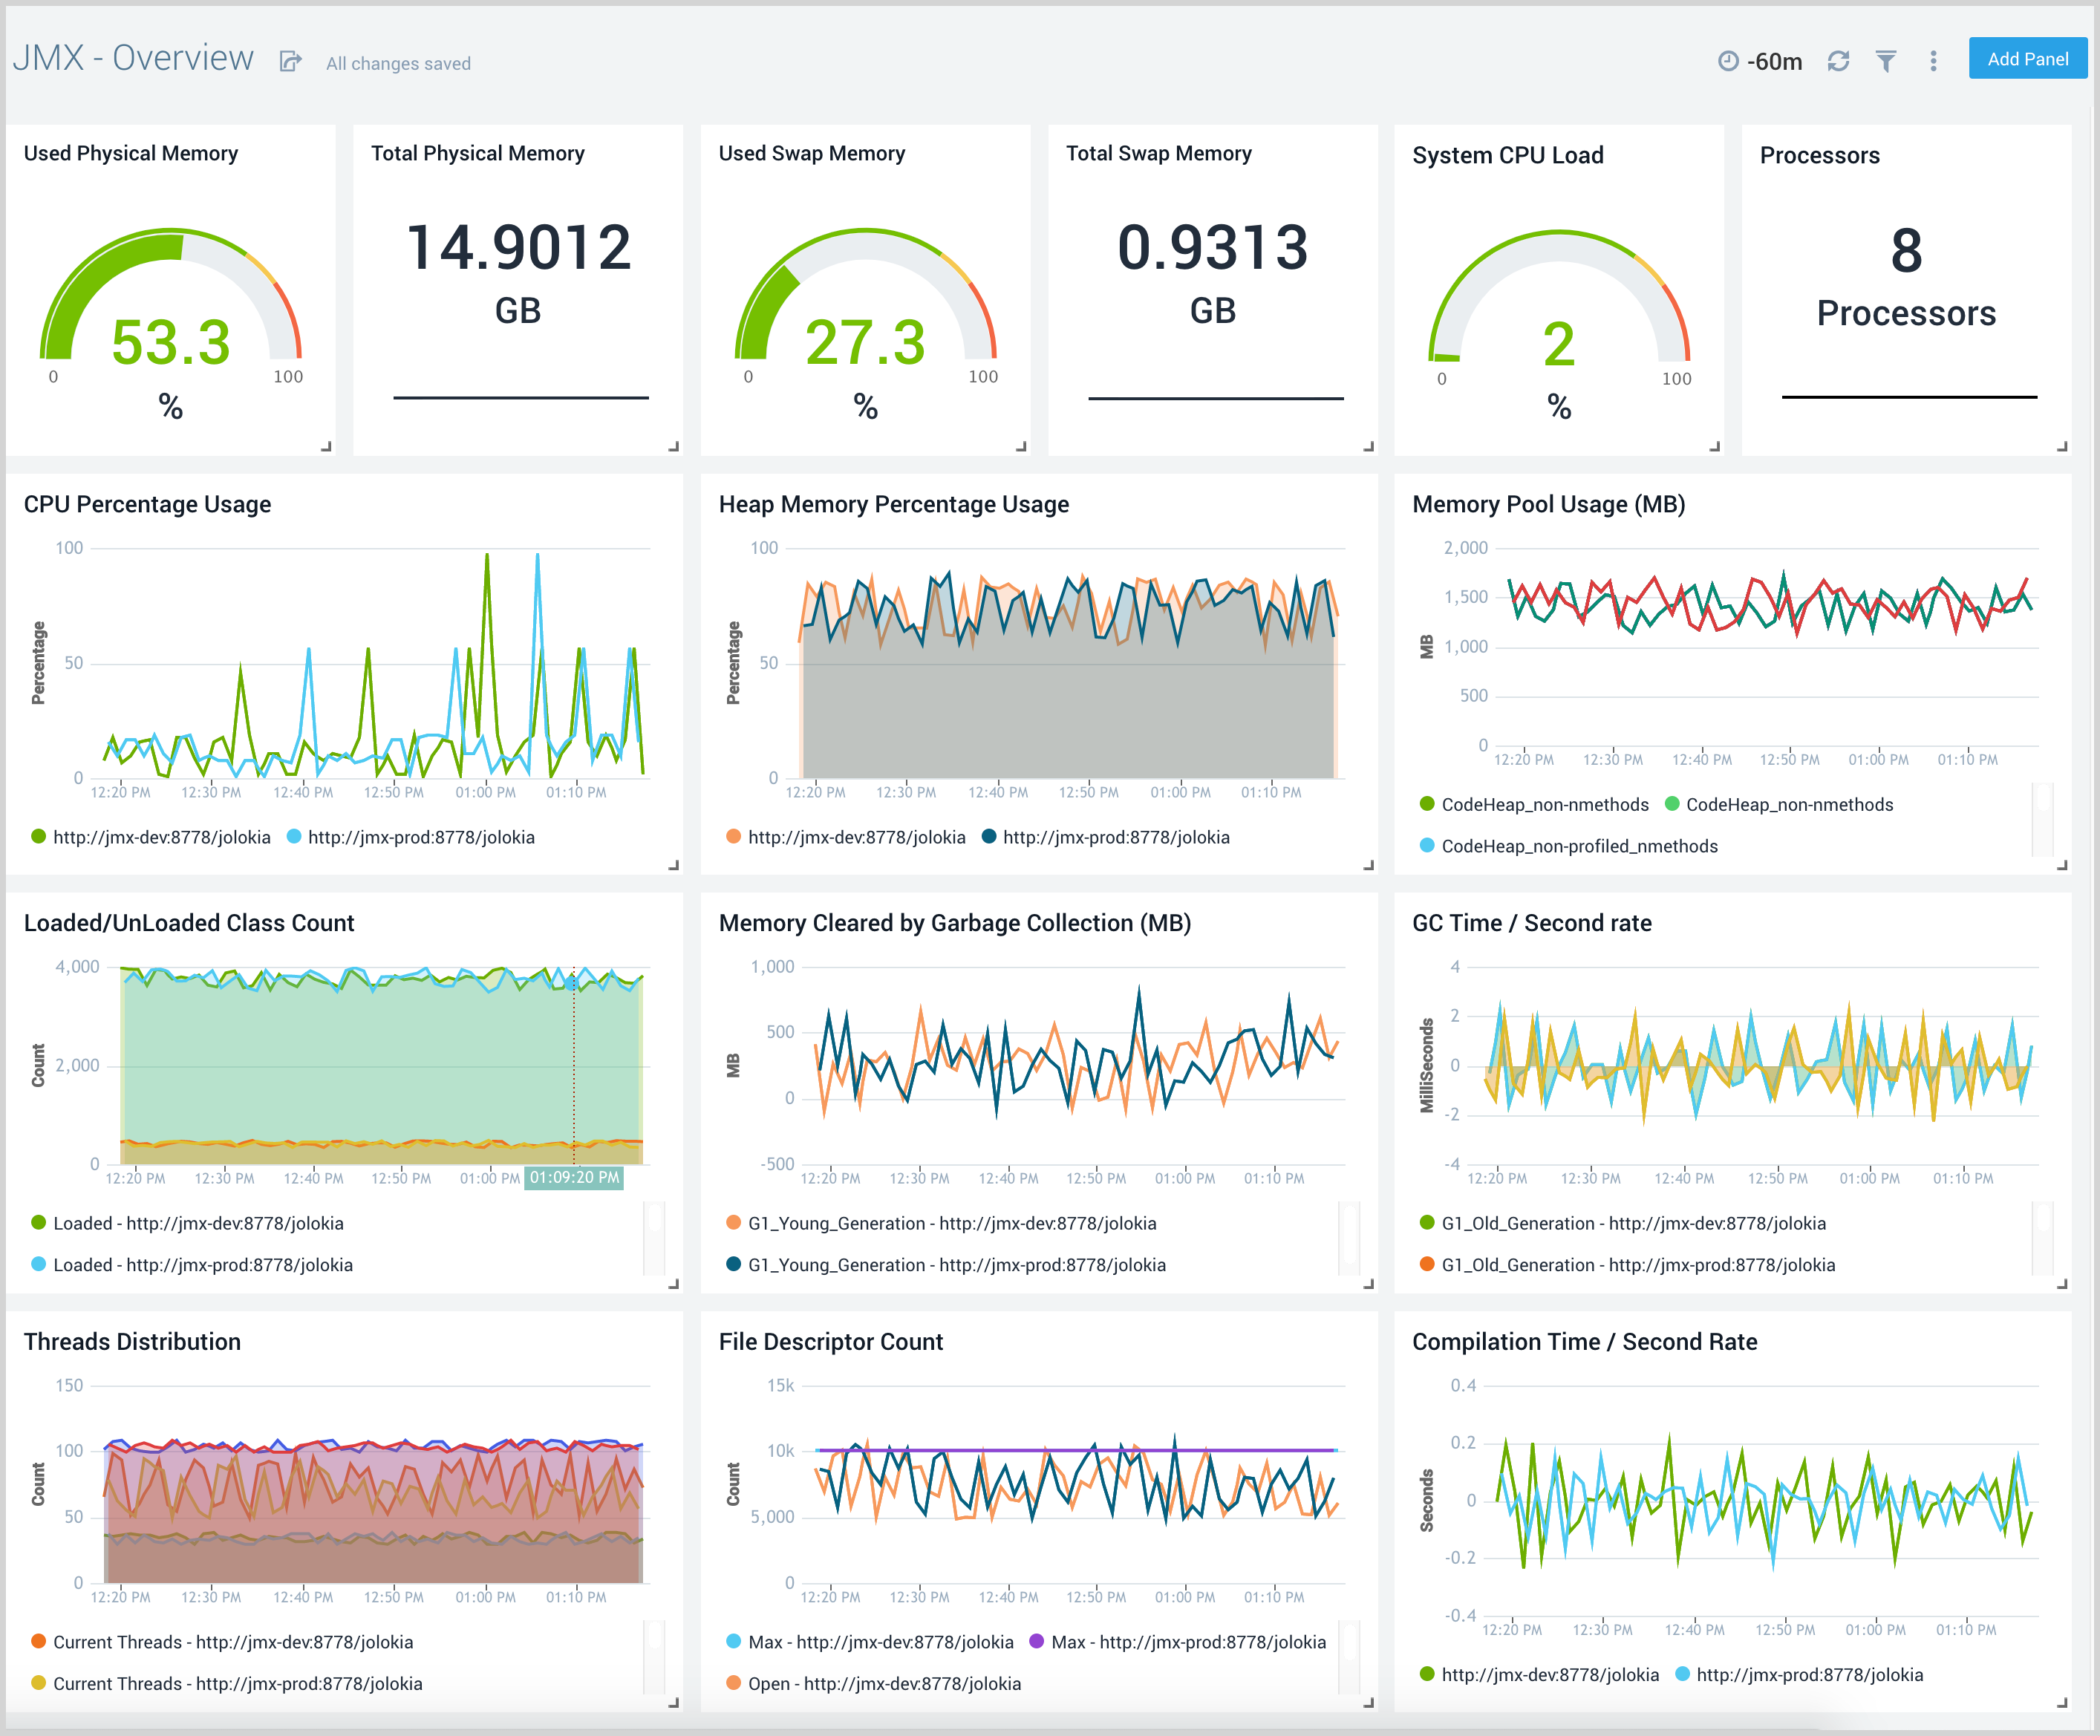
Overview
The JMX - Overview dashboard provides a quick summary of CPU and memory usage by different deployments. It also shows key statistics like JVM uptime, process versus system CPU load, committed versus used memory, objects collected by GC, and time taken by the last GC run server-wise.
Use this dashboard to:
- Understand the overall health of your java virtual machine.
- Monitor the number of open file descriptors. If the number of open file descriptors reaches maximum file descriptor, it can cause IOException: Too many files opens.
- Gain insight into Garbage collection and its impact on CPU usage and memory.
- Understand the dynamic behavior of threads.
- Understand the behavior of class count. If class count keeps on increasing, you may have a problem with the same classes loaded by multiple classloaders.
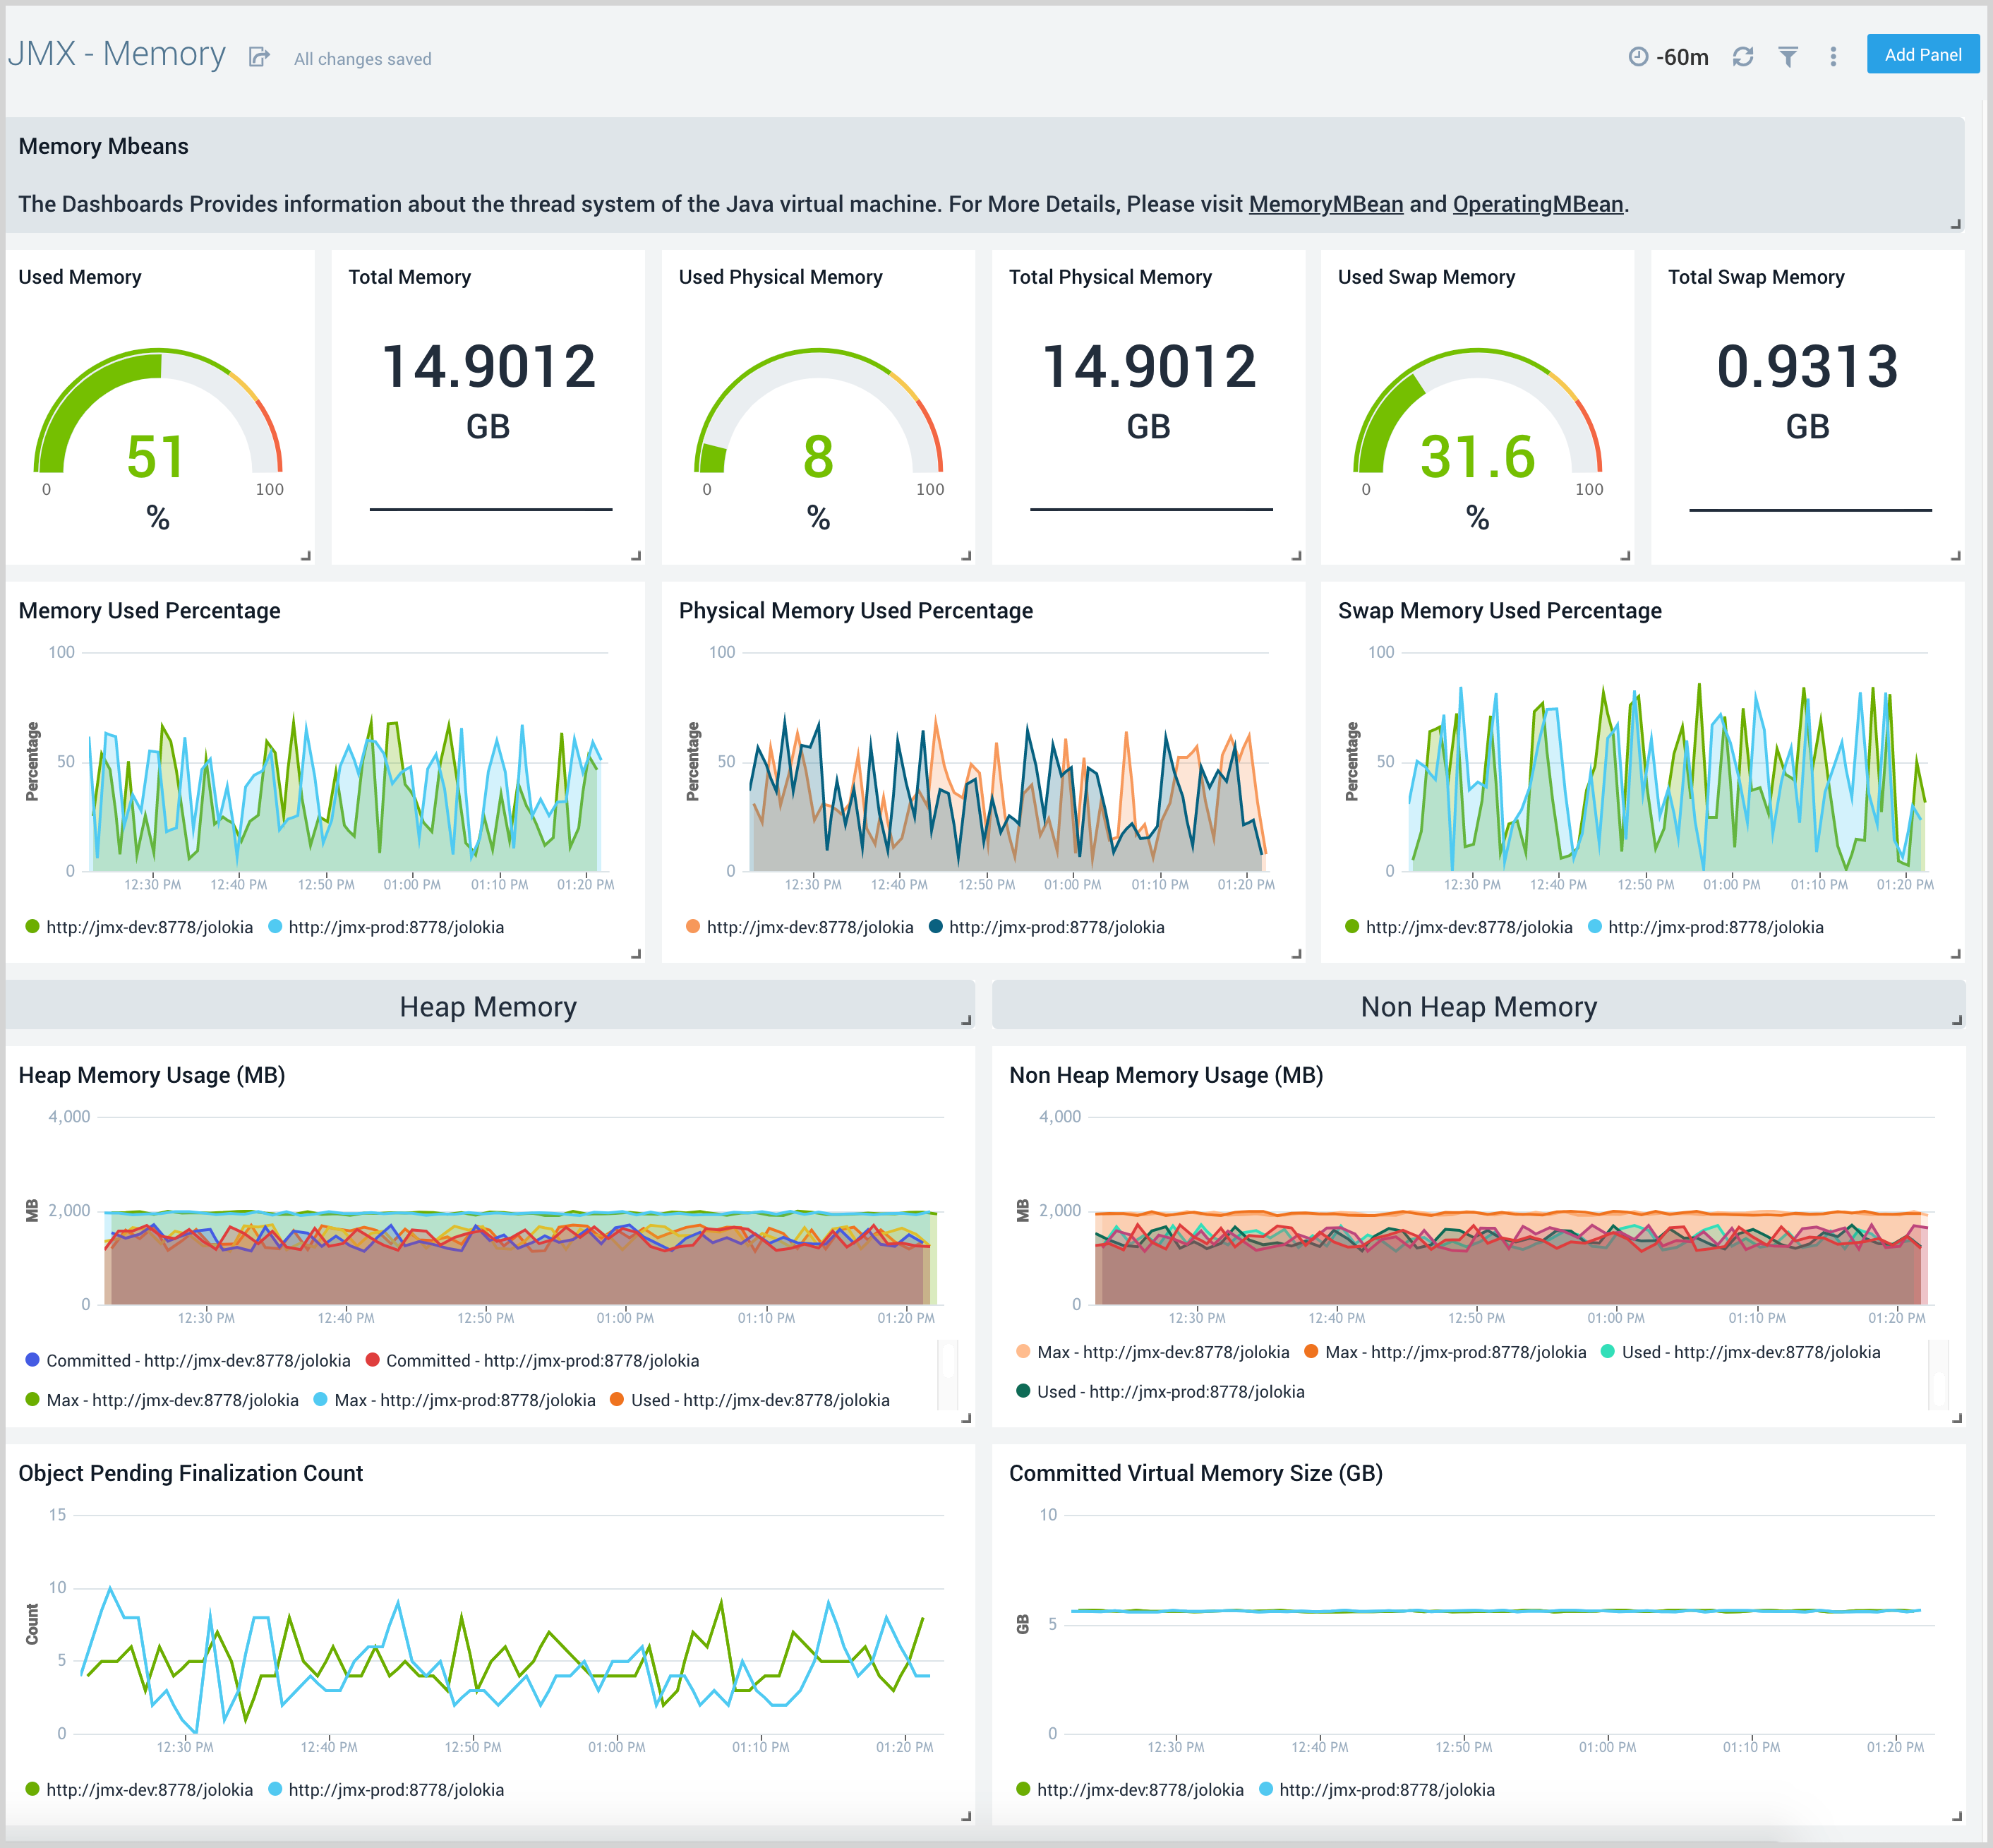
Memory
The JMX - Memory dashboard shows the percentage of the heap and non-heap memory used, physical and swap memory usage of your java virtual machine.
Use this dashboard to:
- Gain insights into Heap and Non-Heap memory usage.
- Review Physical and swap memory usage.
- Review pending object finalization count which when high can lead to excessive memory usage.
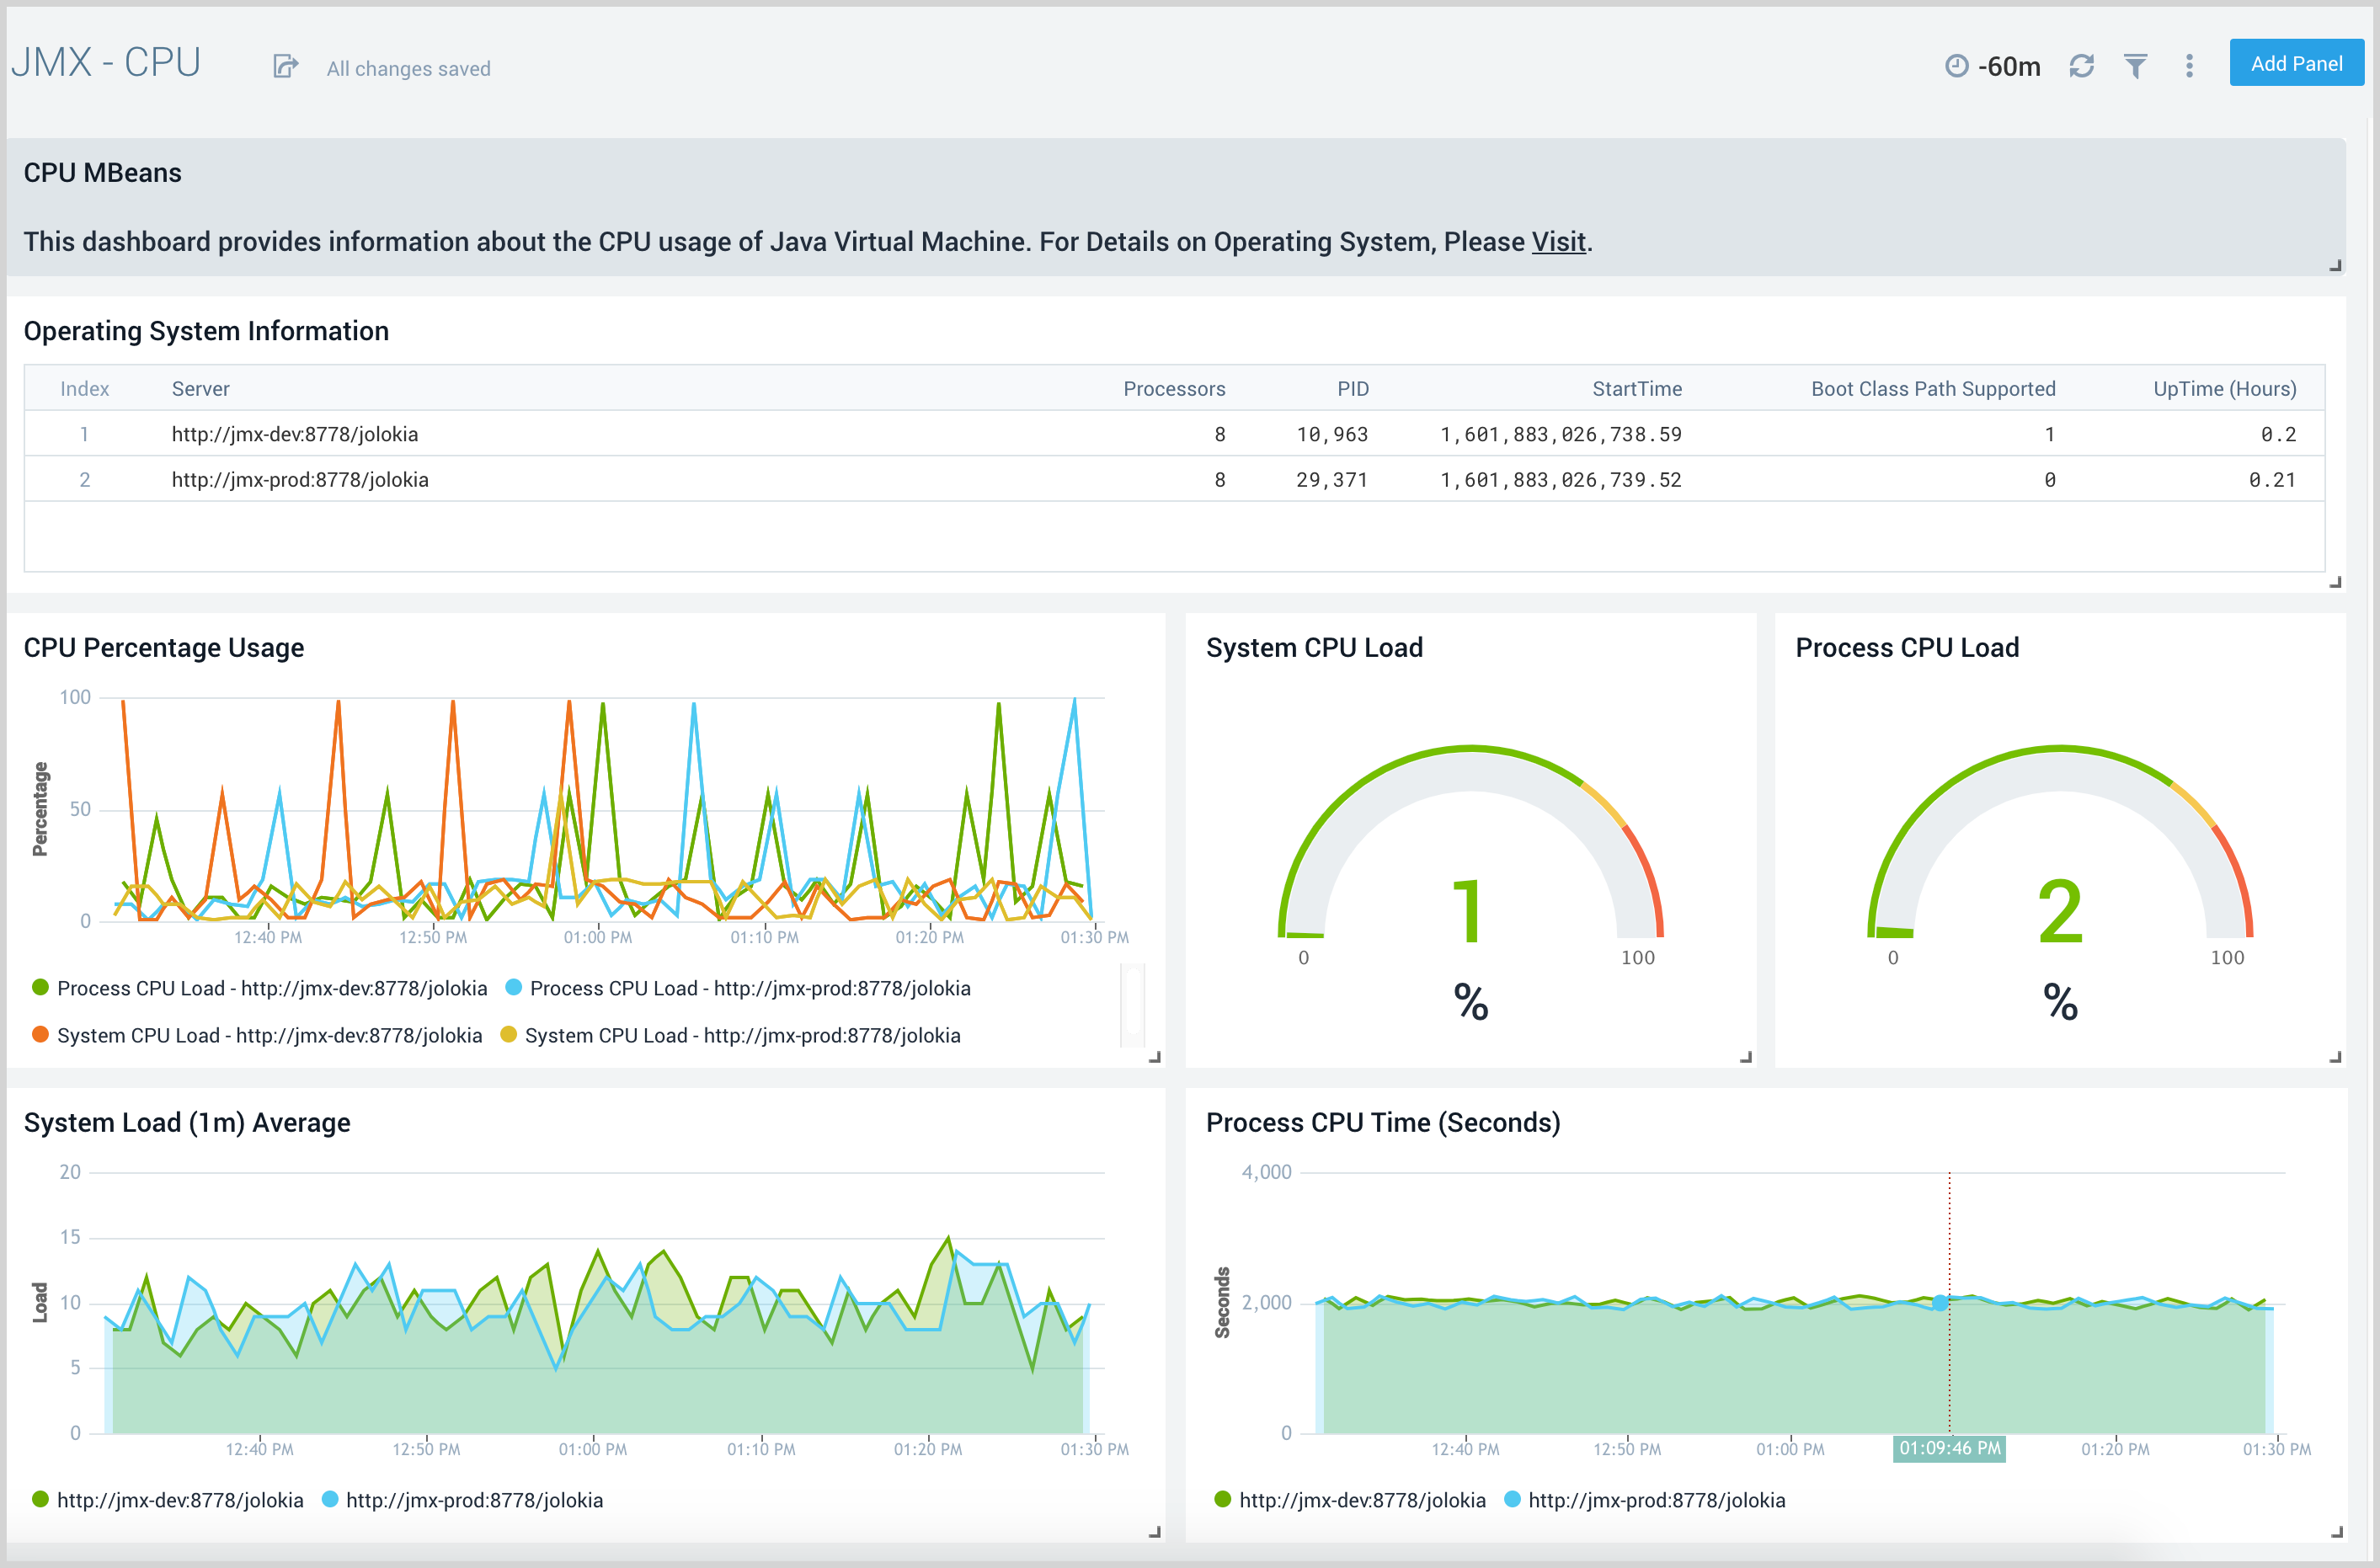
CPU
The JMX - CPU dashboard shows the process and system CPU usage. It also shows the operating system information of your java virtual machine.
Use this dashboard to:
- Gain insights into the process and system CPU load.
- Review the CPU processing time.
Garbage Collector
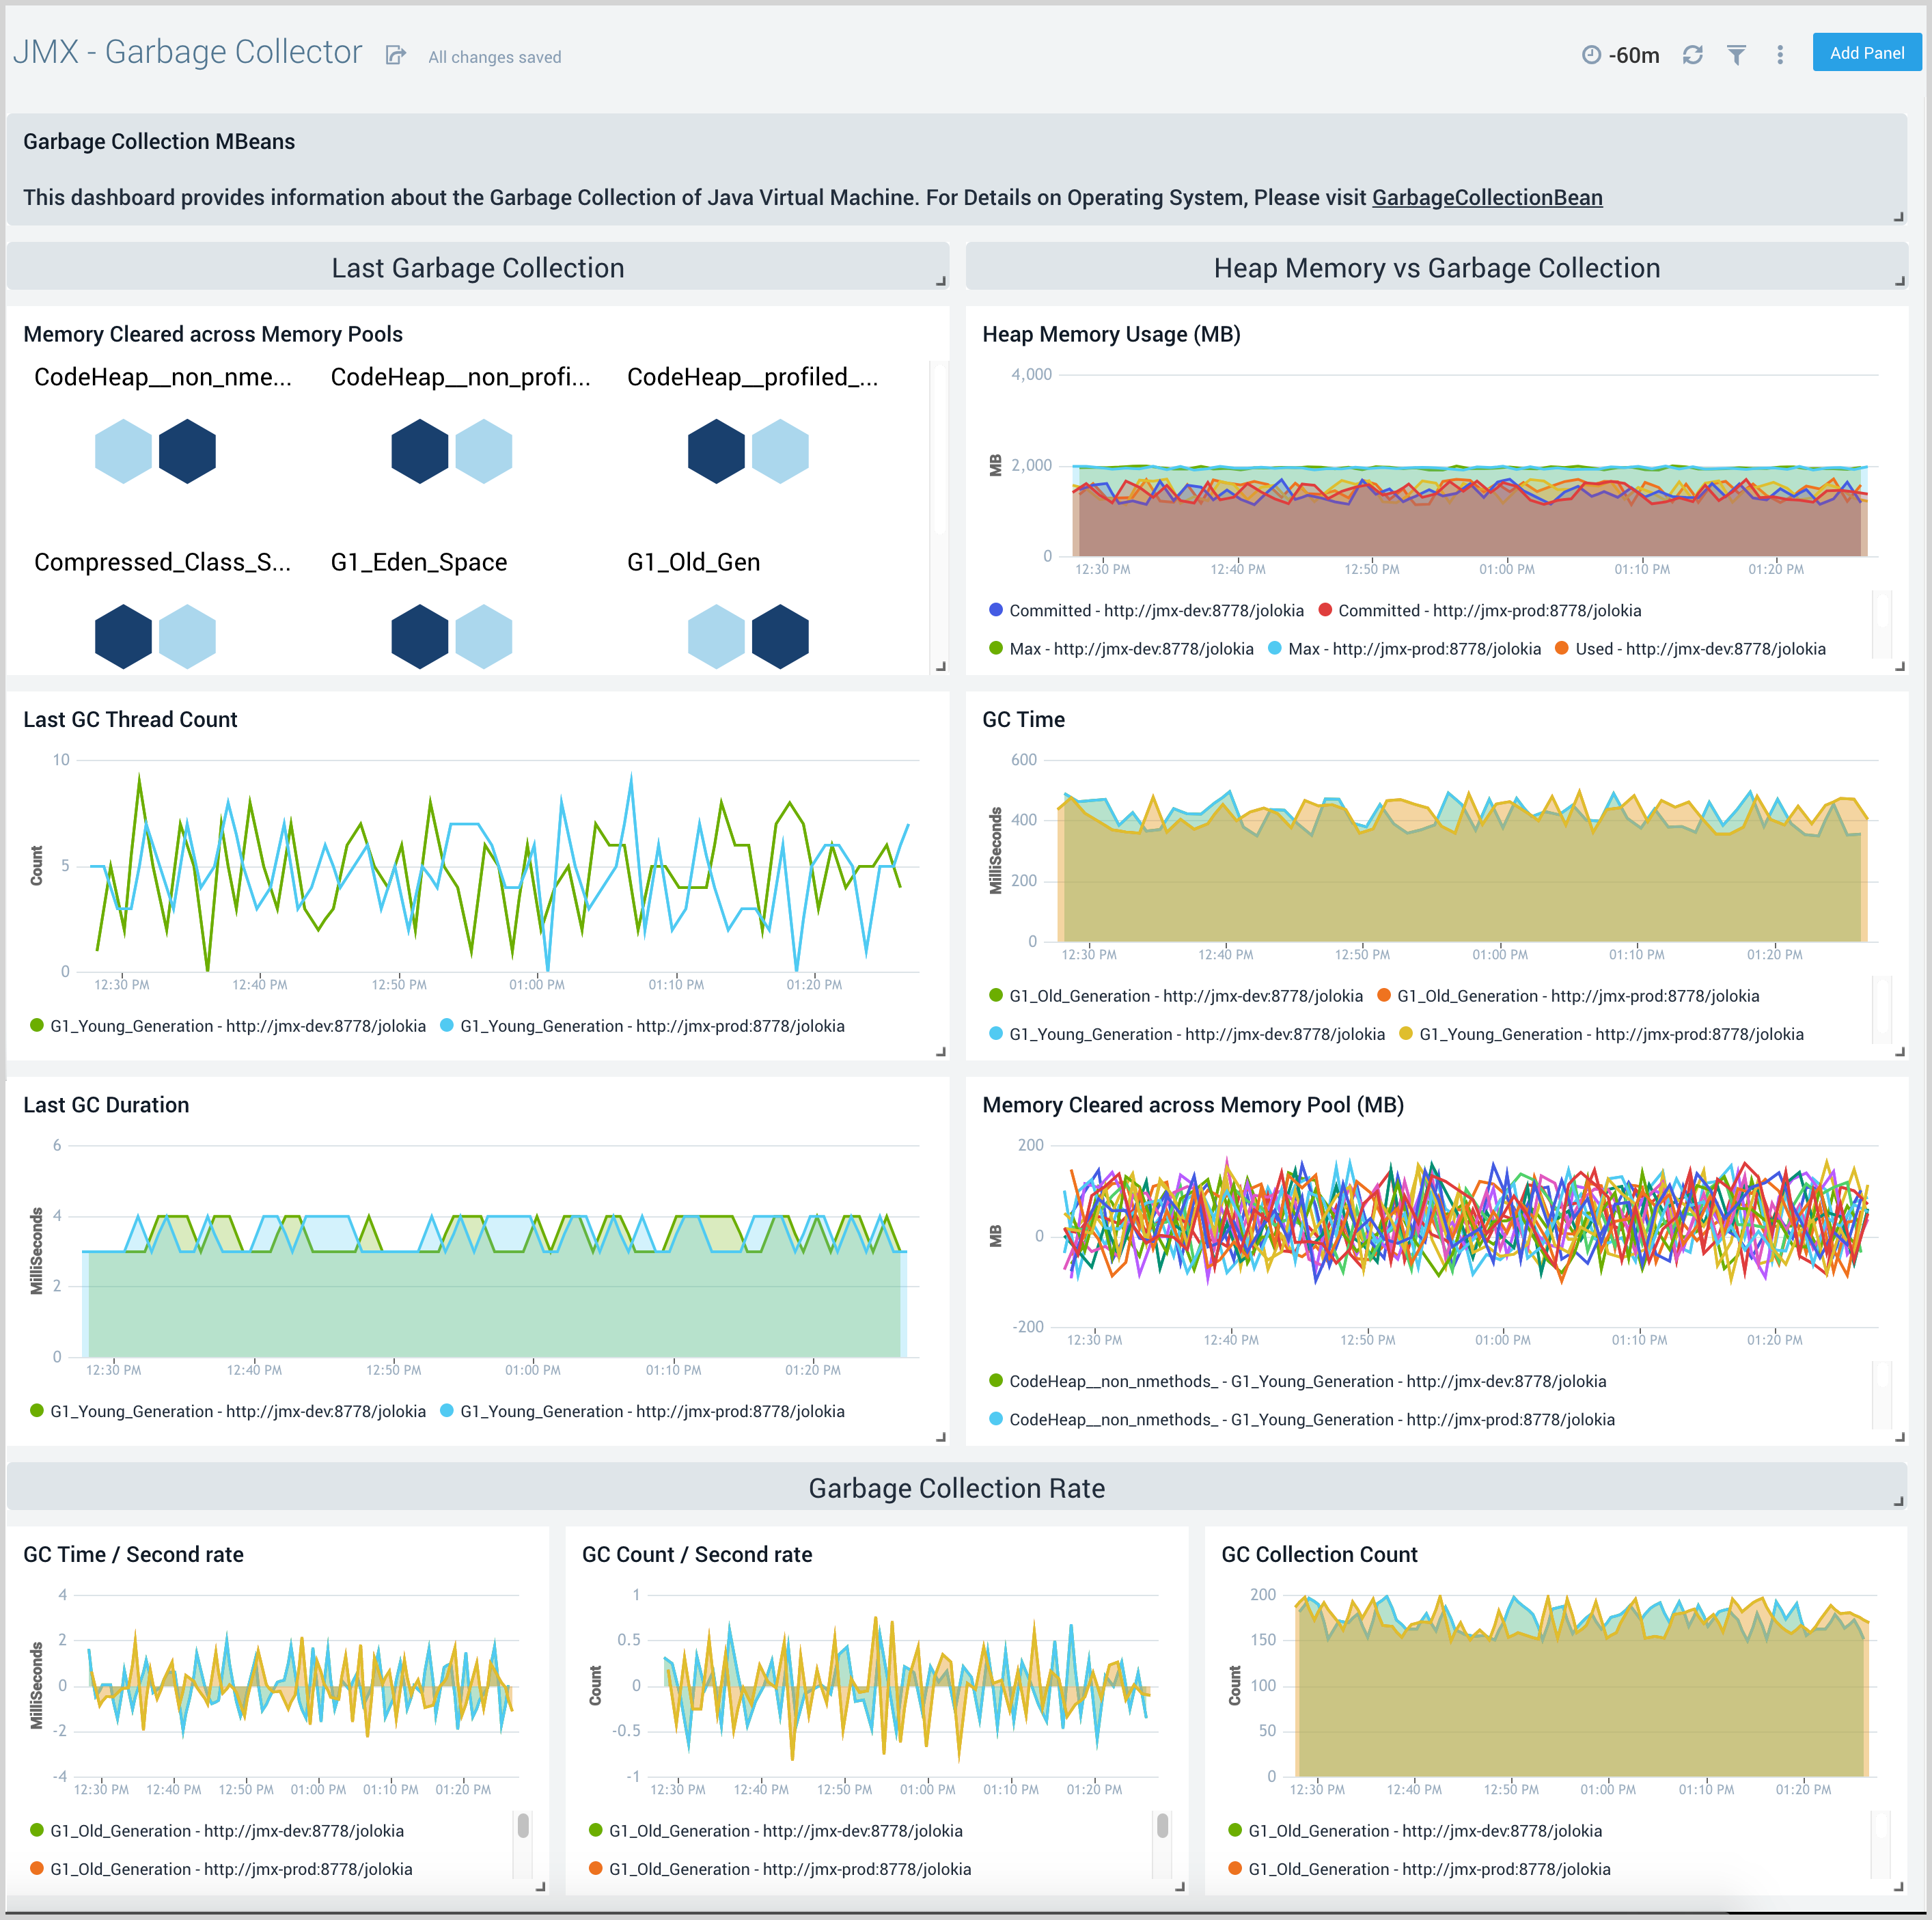
The JMX - Garbage Collector dashboard shows key Garbage Collector statistics like the duration of the last GC run, objects collected, threads used, and memory cleared in the last GC run of your java virtual machine.
Use this dashboard to:
- Understand the garbage collection time. If the time keeps on increasing, you may have more CPU usage.
- Understand the amount of memory cleared by garbage collectors across memory pools and its impact on the Heap memory.
Thread
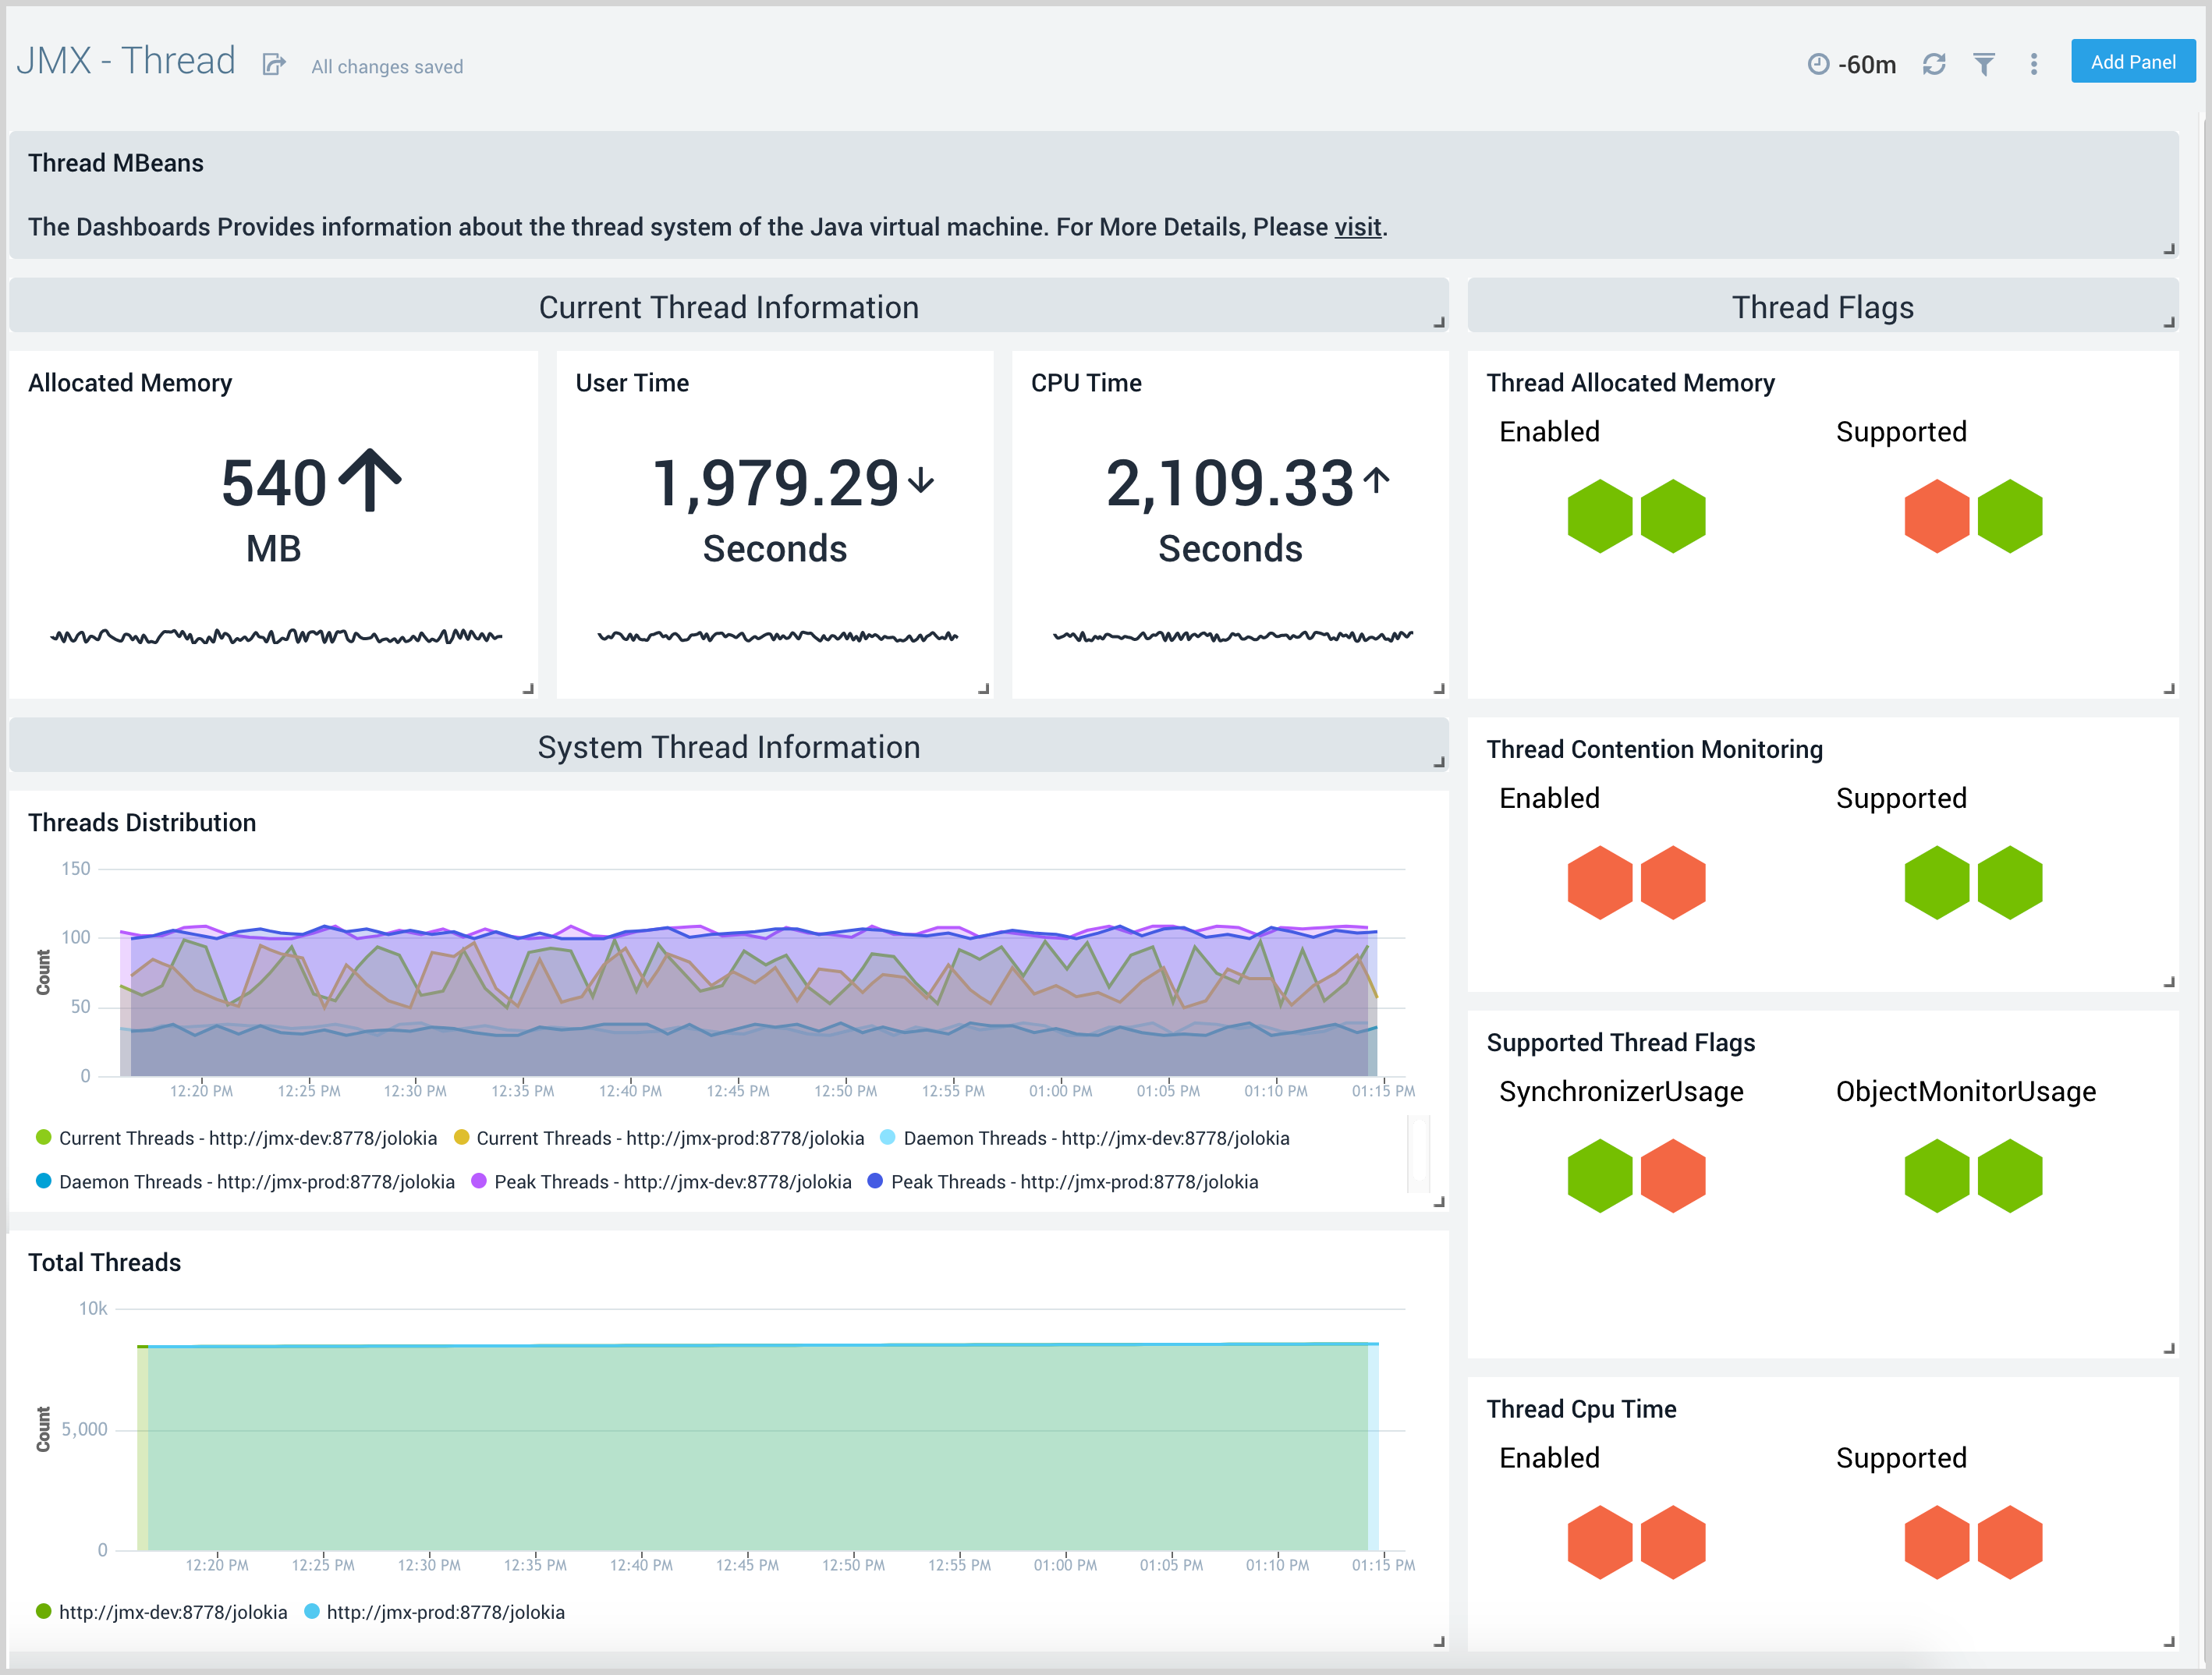
The JMX - Thread dashboard shows key information about the number and type of threads deadlocked, peak, and GC threads of your java virtual machine running on the deployment.
Use this dashboard to:
- Understand the dynamic behavior of the system using Peak, Daemon, and current threads.
- Gain insights into the memory and CPU time of the last executed thread.
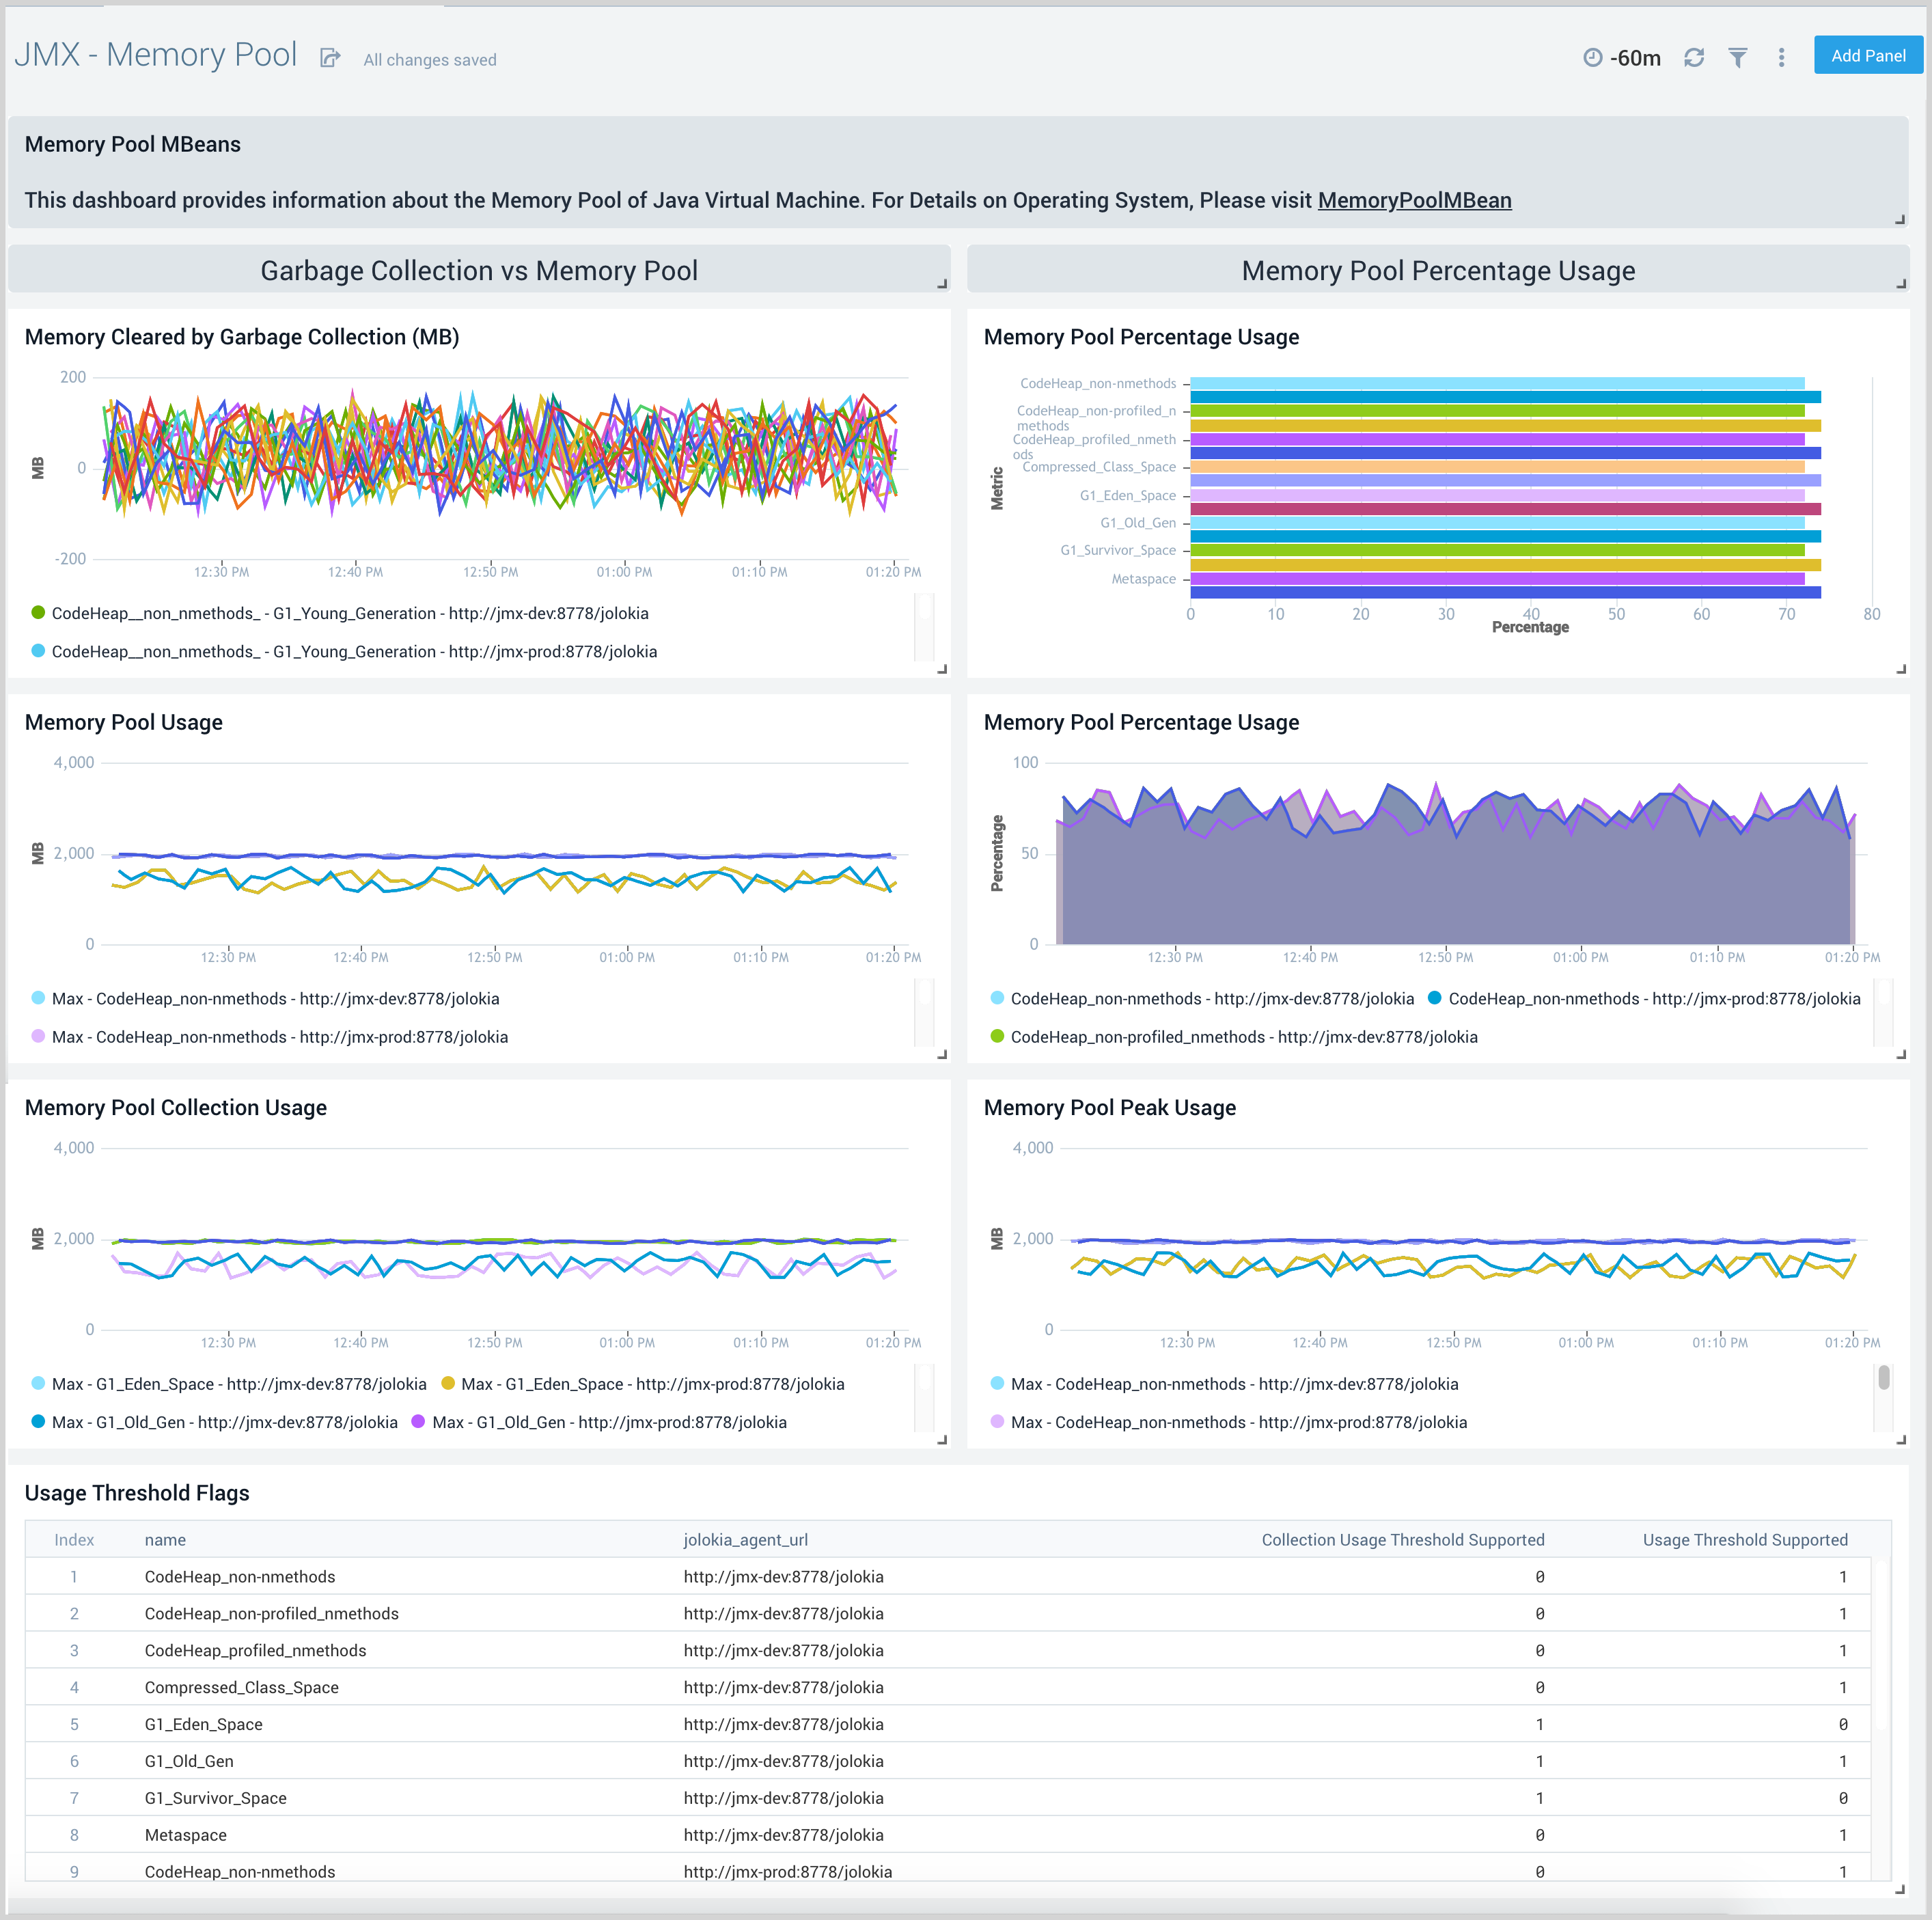
Memory Pool
The JMX - Memory Pool dashboard provides key information about the memory pool usage, peak usage, collection usage, garbage collection across various memory pools of your Java virtual machine.
Use this dashboard to:
- Gain insights into memory usage across different memory pools.
- Gain insights into garbage collection impact on different memory pools.
- Understand Peak usage and collection usage of different memory pools.
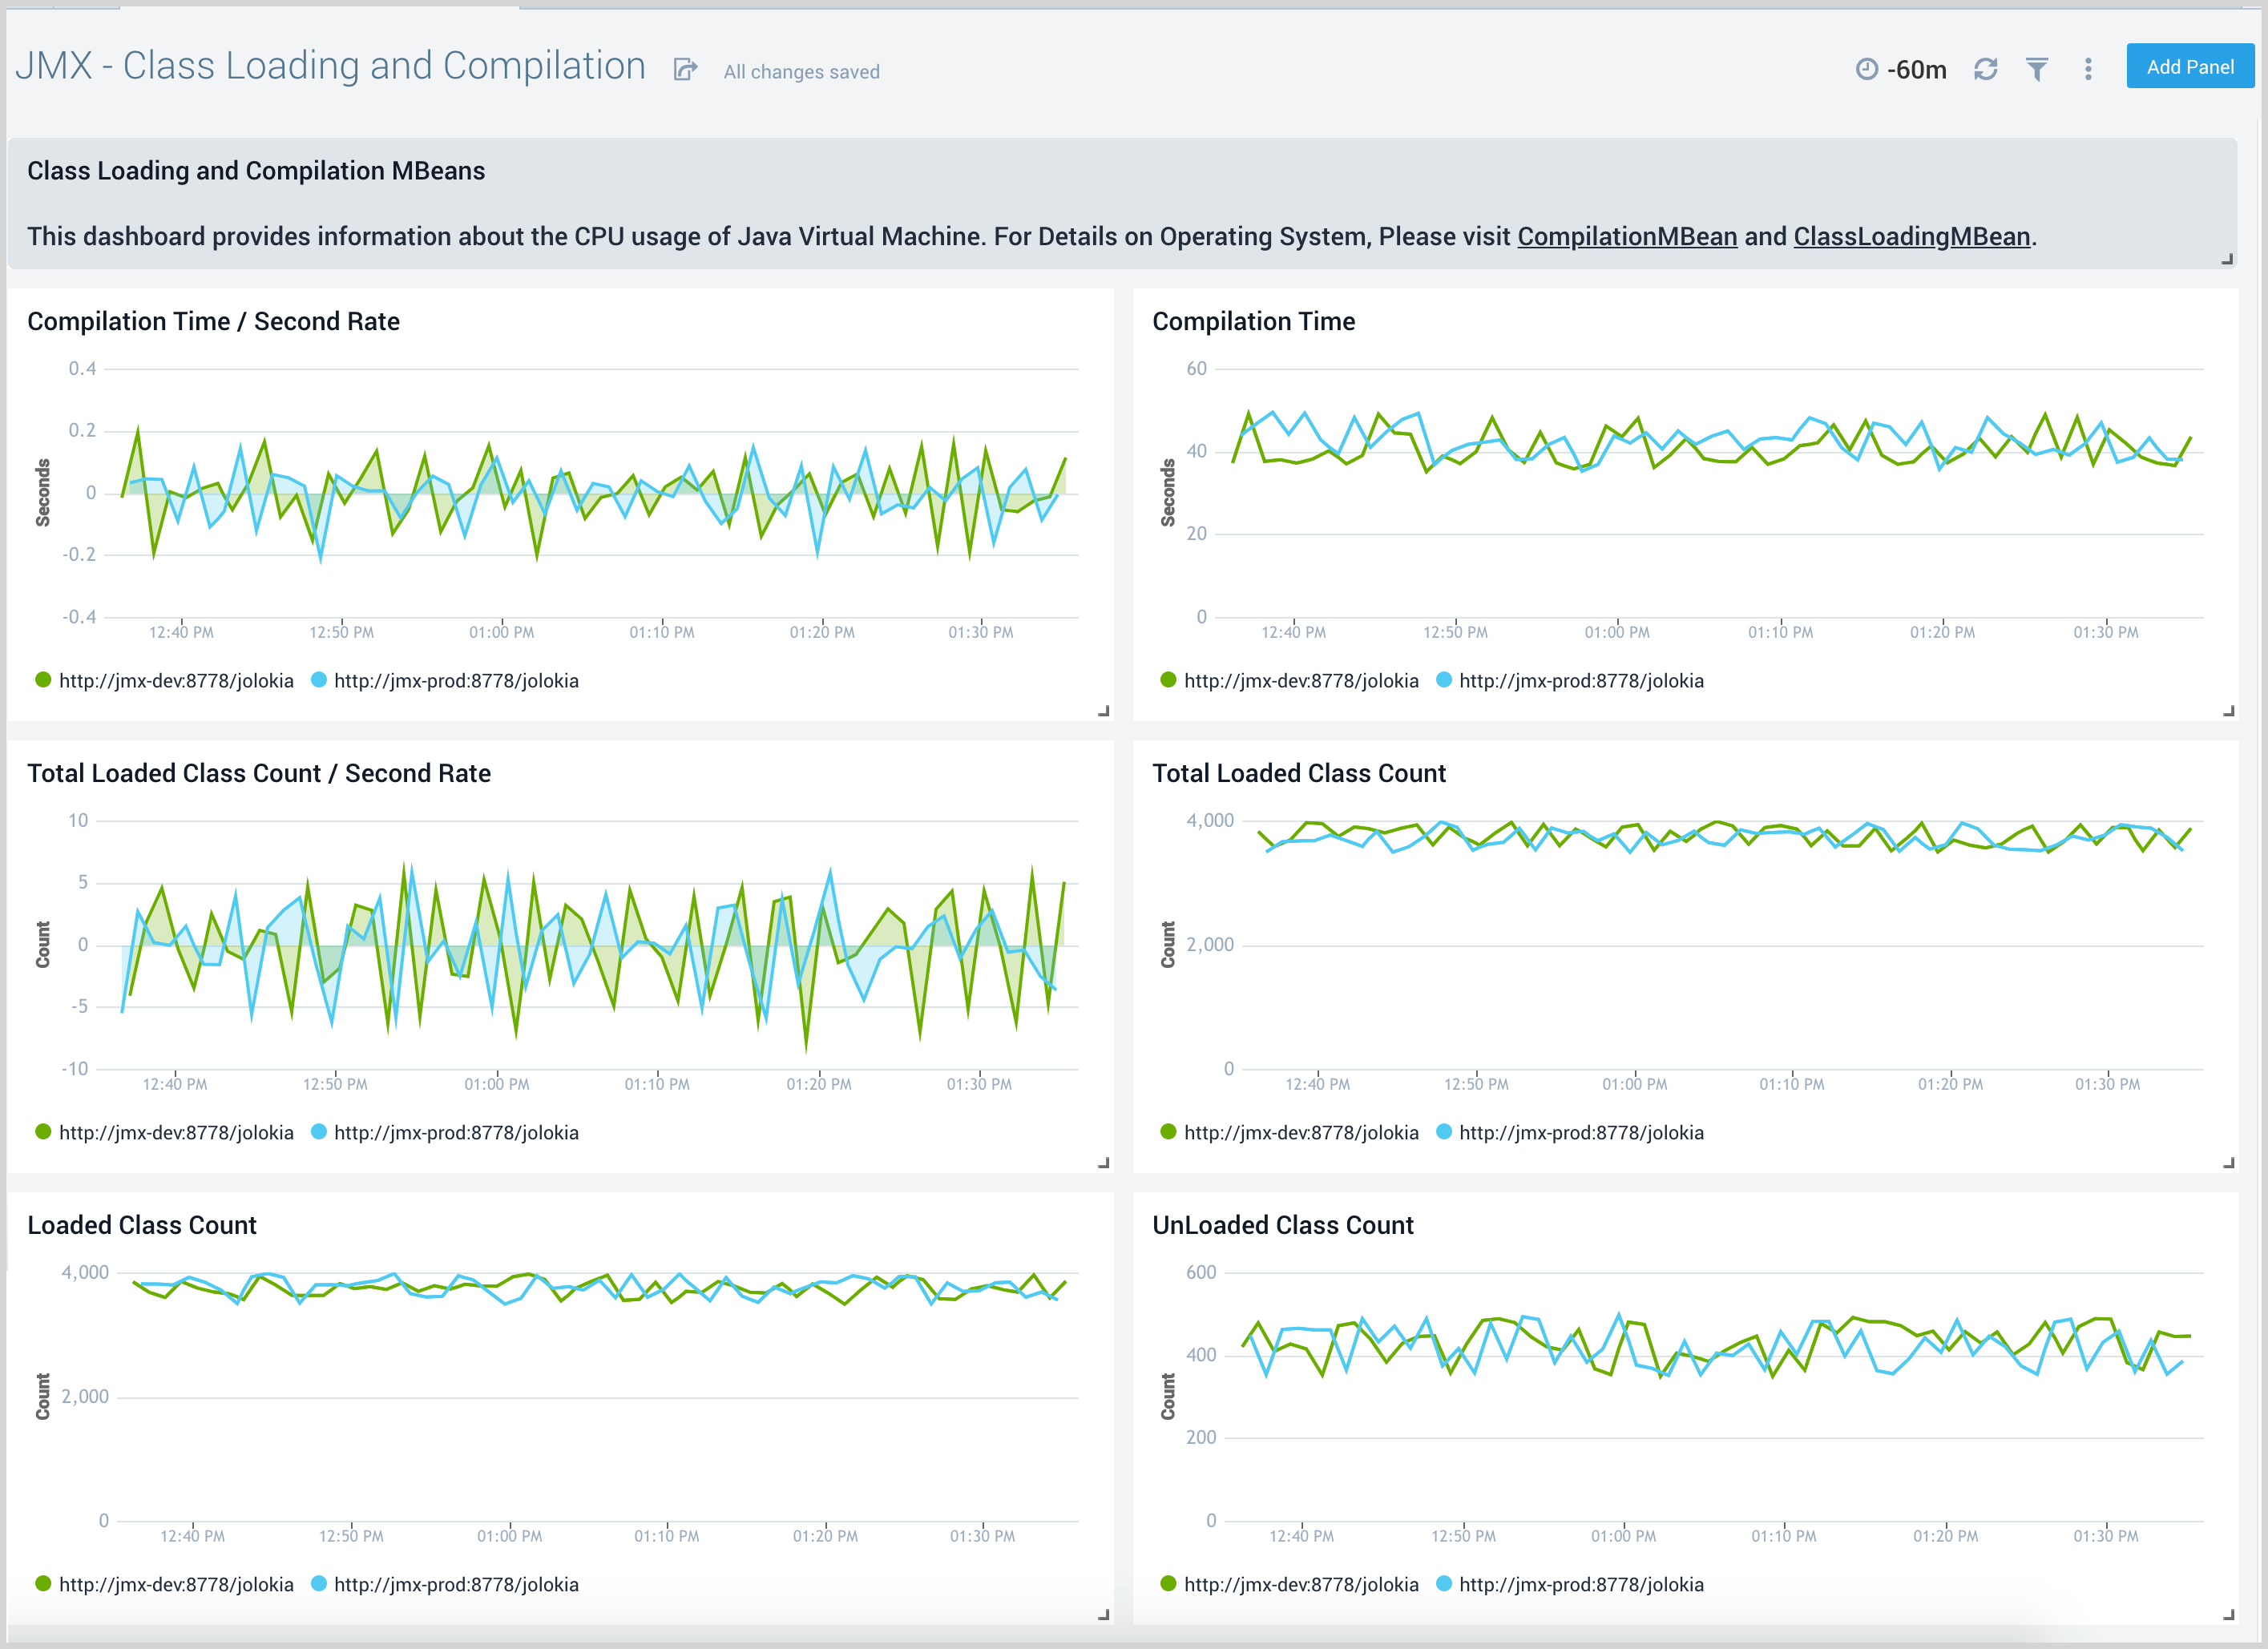
Class Loading and Compilation
The JMX - Class Loading and Compilation dashboard shows key information about the rate of total loaded class, compilation time, unloaded classes of your java virtual machine.
Use this dashboard to:
- Gain insights into the behavior of class count. If class count keeps on increasing, you may have a problem with the same classes loaded by multiple classloaders.
- Gain insights into time spent by java virtual machines in the compilation.