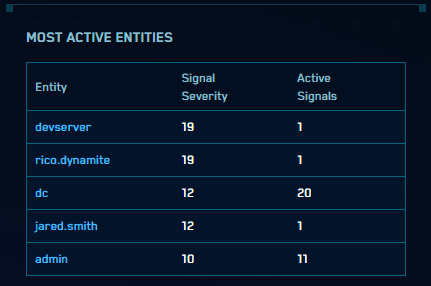
Active Entities Panel
To assist analysts detect potential security issues as early as possible, a new panel has been added to the Heads Up Display (HUD):

This panel lists the top five most active entities, ranked by Signal Severity Total. This metric, which was introduced with the Related Entities enhancement last year, is the total sum of the severities of all unique Signals the Entity appears in during the current Insight detection window (typically, the past 14 days).
The count of Active Signals (Signals within the detection window that have not been included in an Insight) is also listed.
When hovering over the Entity value, the Entity’s type will be displayed. The Entity value is a link to that Entity’s details page.
Analysts can use this tool to investigate what appears to be risky activity and potentially proactively security issues before they are raised to the level of an Insight.
Minor Changes and Enhancements
- [New] When looking at Signals in the new
sec_signalindex, attributes and values in array fields are now properly supported by auto-parsing, syntax likecount by, and features like right-click > filter selected value. - [New] An attribute
attackStagehas been added to the newsec_signalindex. This attribute summarizes the Mitre attack stage represented by the rule which triggered the signal. The value is defined the same way as theattack_stageattribute included in the older Signal forwarding feature. - [Updated] The
subResolutionattribute is now included in the Insight payload for http v2 actions. - [Updated] The way Release Notes are listed in the CSE UI is changing. There is no longer a “bell” item on the top menu; it has been replaced with a link to the Release Notes page in the Help menu. In addition, Release Notes are now directly visible in the UI when they are published.
- [New] When executing a context action on a Signal, fields will now be passed to the context action if they are available based on the record(s) in context.
Bug Fixes
- The “Radar” graph of records, Signals and Insights on the HUD has been updated so that the discontinuity at the top of the Signals section of the graph has been removed.
- When viewing the raw log message corresponding to a normalized record, the wrong message was displayed.
- The Network Block(s) associated with an Entity were not listed on the Entity details page.
- When testing Rule expressions, sometimes the selected Tuning expression was not included.
- Changes to entity tags or Criticality were not being listed on the History section of the Entity.
- Entity Criticality was sometimes not displaying properly on the Insight details page.