GCP Metrics Source
The Sumo Logic GCP Metrics Source gives you complete visibility into all Google Cloud Platform (GCP) infrastructure and managed services using an integrated Google Service account.
For information on API calls and collected metrics, see the Collected metrics section.
Google Service account
Sumo Logic uses a Google Service Account to connect and make API calls on your behalf to collect metrics.
Consider the following when setting up your project and Service account:
- The project you want to monitor requires the following enabled: Google Cloud billing, Cloud Monitoring API, the Compute Engine API, and the Cloud Asset API
- The Service account requires the following roles to enable monitoring: Compute Viewer, Monitoring Viewer, and Cloud Asset Viewer.
- When creating a GCP Metrics source, you will provide a JSON credentials file downloaded from Google Cloud Platform to enable this connection and collection.
You have two options for service accounts:
- Create and configure a Service Account and download a JSON authentication file. You will upload this when configuring the GCP Metric source.
- If one project holds all service accounts, add principals to the project id Sumo Logic will collect metrics from.
Create a Service Account and download JSON authentication
To create and configure a Service Account and download the JSON authentication file:
- Visit your Google Cloud project’s credentials page for the project you want to monitor.
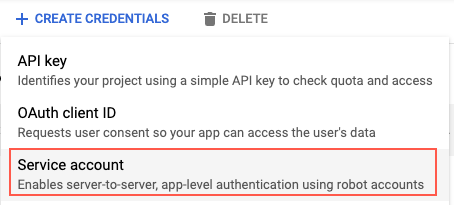
- Click Create Credentials and select Service account.
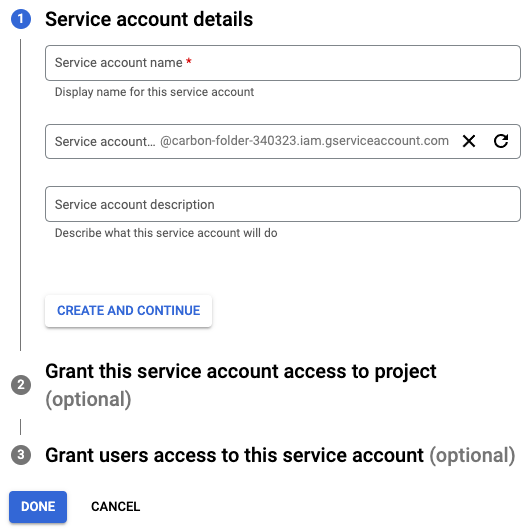
- Enter a unique name and click Create.
- Click the Service account on the page to modify roles and download the JSON key.
- Click the Permissions tab and add the following roles: Compute Viewer, Monitoring Viewer, and Cloud Asset Viewer.
- Click the Keys tab then Add Key.
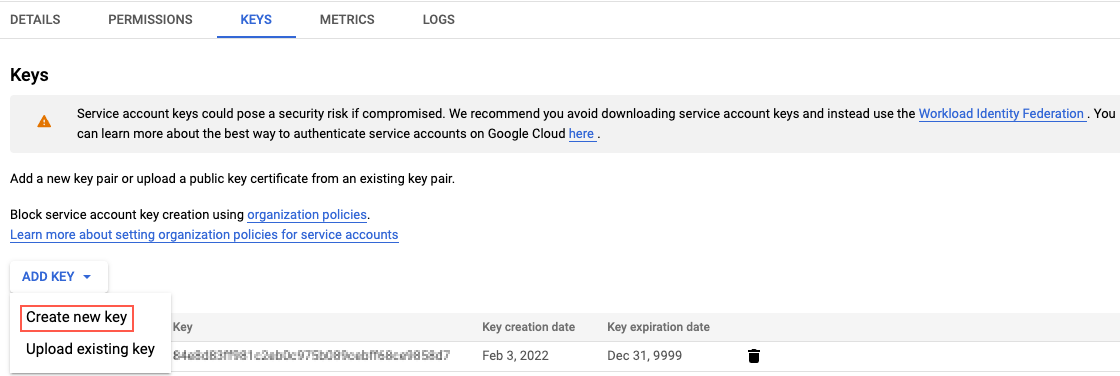
- Select JSON and click Create. You will use the downloaded JSON file when creating the source.
For more information, see Service account credentials.
Add Principals to the Project
If you create and manage all service accounts in one project which is different than the project Sumo Logic will collect metrics from, you need to add the Principal to the project you will collect GCP metrics.
- In the project, select IAM in the left navigation.
- Click +Add.
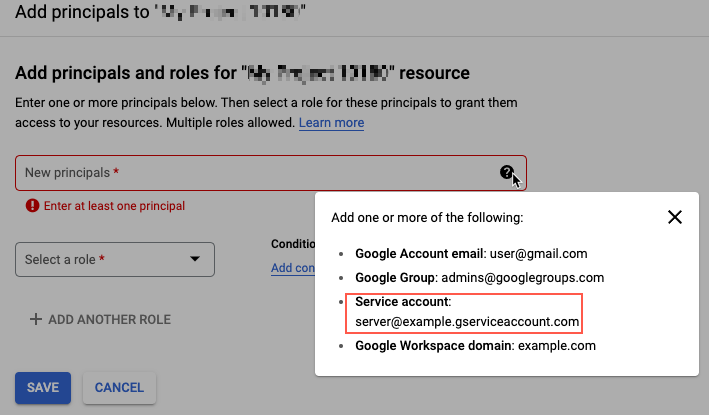
- Enter the email for the Service Account to add as a principal, for example:
server@example.gsserviceaccount.com. - Select a role from the list, or click +Add Another Role as needed.
- Click Save.
- You will need to make one change in the service account JSON if you have added a Principal. Change the project ID in the downloaded service account key to the projectId value where Sumo Logic will collect the metrics, not the project where the service account was created.
Set up a GCP Metrics source
For information on available metrics, see GCP Metrics.
Select an existing Hosted Collector upon which to add the Source. If you do not already have a Collector you would like to use, create one, using the instructions on Create a Hosted Collector.
In Sumo Logic select Manage Data > Collection > Collection.
Click Add Source next to a Hosted Collector.
Search for and select GCP Metrics.

Name. Enter a name to display for the new source.
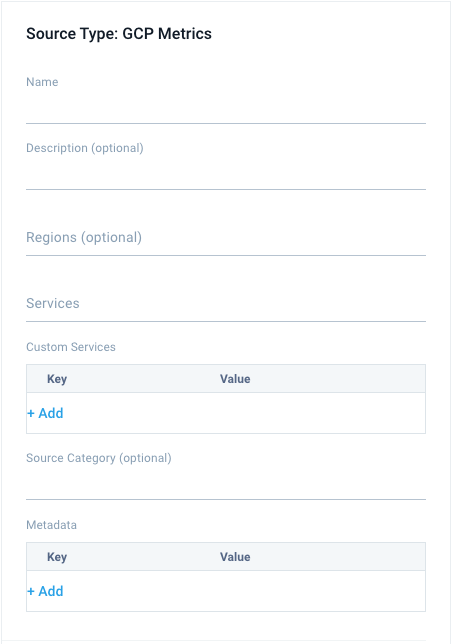
Description. Optional description.
Regions. Optional limit to selected Google Cloud regions.
noteSome metrics do not include or support a region.
Services. Select one or more of the following Services.
Click to expand.
App name App Engine appengine.googleapis.com Big Query bigquery.googleapis.com Bigtable bigtable.googleapis.com CloudSQL cloudsql.googleapis.com Cloud APIs serviceruntime.googleapis.com Cloud Composer composer.googleapis.com Cloud Dataproc dataproc.googleapis.com Cloud Filestore file.googleapis.com Cloud Firestore firestore.googleapis.com Cloud Interconnect interconnect.googleapis.com Cloud IoT cloudiot.googleapis.com Cloud Load Balancing loadbalancing.googleapis.com Cloud Memorystore for Redis redis.googleapis.com Cloud Router router.googleapis.com Cloud Run run.googleapis.com Cloud Tasks cloudtasks.googleapis.com Cloud TPU tpu.googleapis.com Compute Engine compute.googleapis.com Container Engine container.googleapis.com Datastore datastore.googleapis.com Firebase firebasedatabase.googleapis.com Functions cloudfunctions.googleapis.com Machine Learning ml.googleapis.com Pub/Sub pubsub.googleapis.com Spanner spanner.googleapis.com Cloud Logging logging.googleapis.com Storage storage.googleapis.com VPN vpn.googleapis.com Networking networking.googleapis.com Auto Scaler autoscaler.googleapis.com Network Security networksecurity.googleapis.com Net App netapp.com.googleapis.com Cloudvolumes Net App cloudvolumesgcp-api.netapp.com VPN Access vpcaccess.googleapis.com Custom Services (Optional). A Custom Service for collecting custom metrics. Click the +Add link to add a custom service using a name (key) and value. For example, enter
service1andcustom.googleapis.com/my_cumulative_metric1;custom.googleapis.com/my_cumulative_metric2;.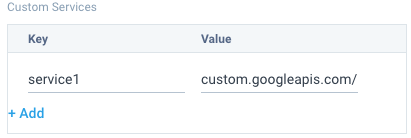 note
noteDo not use quotes when entering a custom service.
Source Category (Optional). The Source Category value is tagged to each log and stored in a searchable metadata field called
_sourceCategory. See our Best Practices: Good Source Category, Bad Source Category. Avoid using spaces so you do not have to quote them in keyword search expressions. This can be a maximum of 1,024 characters.Fields. Click the +Add link to add custom log metadata Fields, then define the fields you want to associate. Each field needs a name (key) and value. Look for one of the following icons and act accordingly:
 A green circle with a check mark is shown when the field exists and is enabled in the Fields table schema.
 An orange triangle with an exclamation point is shown when the field doesn't exist, or is disabled, in the Fields table schema. In this case, an option to automatically add or enable the nonexistent fields to the Fields table schema is provided. If a field is sent to Sumo that does not exist in the Fields schema or is disabled it is ignored, known as dropped.
GCP Access. Upload the JSON Google service account credentials file. This allows Sumo Logic to make API calls to Google Cloud.
Scan Interval. Use the default of 1 minute, or change this value to indicate how frequently Sumo Logic should poll the GCP API. To learn more about polling interval considerations, see GCP Scan Interval below.
Processing Rules. Configure any desired filters, such as allowlist and denylist, as described in Metrics Include and Exclude Rules.
Click Save.
GCP metric visibility
Your GCP metrics will not be immediately available in Sumo Logic. Metrics should be available after a period approximately equal to the metric latency on GCP plus five minutes.
The scan interval indicates the frequency at which Sumo Logic polls metrics, which may take a minute to complete the polling loop for a source. Sumo Logics takes 30 to 120 sections to become searchable on the platform.
GCP scan interval
The scan interval defines how long Sumo Logic waits between calls to the GCP API. This does not affect the number of metric data points collected. If metrics are published to GCP every minute, and you scan every 5 minutes, then each API response would return 5 data points. Decreasing the interval will reduce the number of API calls, which may help with your GCP bill. However, it will also add latency to your GCP Metrics collection.
Google reports GCP metrics at different granularities (1-minute and 5-minute intervals), so setting a scan interval that is too short could lead to excessive querying. Setting an interval that is too long can delay the update frequency of new metrics appearing in Sumo Logic.
Under some circumstances, Sumo Logic automatically increases the scan interval to avoid data loss due to throttling of data by Google Cloud Platform. See Enable and Manage the Audit Index for details.
Costs for using GCP Metric Sources
The monetary costs incurred for your Google accounts is based on the API calls made and amount of data accessed and scanned. Consider your source configuration of services and intervals to reduce costs. The number of collectors does not affect your credits or costs.
Metric ingestion costs include the following:
- Sumo Logic invokes the List Metric Descriptors and List Monitored Resource Descriptors APIs once per scan.
- The Number of Timeseries APIs invoked is a function of selected services and the configured scan interval. GCP charges an amount per one million API invocations.
Collected metrics
For details on GCP collected metrics, refer to the Google Cloud metrics documentation.
API Call Optimization for GCP Metrics
The minimum sample period for GCP metrics is 60 seconds, in which only 1 data point is returned with the same value for min, max, sum, avg, and count. To reduce the number of API calls and chance of throttling, Sumo fetches one statistic which reduces five API calls to one with a sample period of 60 seconds. Which statistics will be queries depends on Metric Kind and Value type. For more information, see Google Value types and metric kinds.
| Value Type | DELTA Metric Kind | CUMULATIVE Metric Kind | GAUGE Metric Kind |
|---|---|---|---|
| INT64 | Mean | Delta | Mean |
| DOUBLE | Mean | Delta | Mean |
| DISTRIBUTION | Sum | Delta | Sum |
| BOOL | N/A | N/A | Count |
Health Events
Health events are provided for the following:
- Connection to the GCP server fails: This connection error may be due to incorrect or invalid credentials or the project has been deleted, including incorrect project id, private key, client email, and access.
- No metric is found to ingest due to source configuration: The source may include a custom service that does not exist or match data (due to typos or incorrect name). Verify your source configuration against available GCP metrics.
- Throttling or Unavailable: A GCP timeseries query may fail due to the GCP server being throttled or unavailable.
API calls
Sumo Logic makes the following API calls for GCP metrics:
- List Metric Descriptors
- List Monitored Resource Descriptors
- List Time Series
Create Queries and Alerts
With the source collecting metrics from GCP, see Metric Queries and Alerts for more information on queries and alerts.