Metrics - Classic
This topic explains how to construct metrics queries and provides examples.
This topic has information about the Classic metrics UI. For information about the Metrics Explorer, the UI that replaces Classic metrics, see Metrics Explorer.
Structure of metrics queries
To create a metrics visualization on the Metrics page, you can specify up to six metrics queries. Enter each query in a separate query text box. Query text boxes are added as needed, up to the maximum of six.
- Each metrics query must include one or more selectors (filters), which can be either of the following:
- Sequence of space-separated
tag=valuepairs:cluster=search node=search-1 - Unqualified strings (value with no key):
statistic
- Sequence of space-separated
- Each query can optionally include one or more operators (avg, count, min, max, sum, and so on):
dep=prod metric=cpu_system | avg - Grouping of results by operator is supported, as in this example, which groups average results by node:
dep=prod metric=cpu_system | avg by node - Logical operators are supported, as in this example which uses NOT, OR, and AND:
not node=forge-12 and cluster=forge and (CPU_Idle or Idle_CPU) | avg
Color-coding of metrics query components
Metrics queries are color-coded to help you identify key elements.
| Color | Purpose |
|---|---|
| Green | Tag or Keyword (cluster, 404) |
| Blue | Value (apache/access) |
| Purple | Operators (avg, sum) |
| Violet | Numbers (10) |
| Orange | Quoted string ("1, 2, 3, 4, 5") |
Multiple selectors in a query
If you specify multiple selectors in one query, results are returned if all values match. For example, the following query returns time series that match deploy=prod AND have the word search appearing anywhere in the metadata: deploy=prod search.
Multiple queries
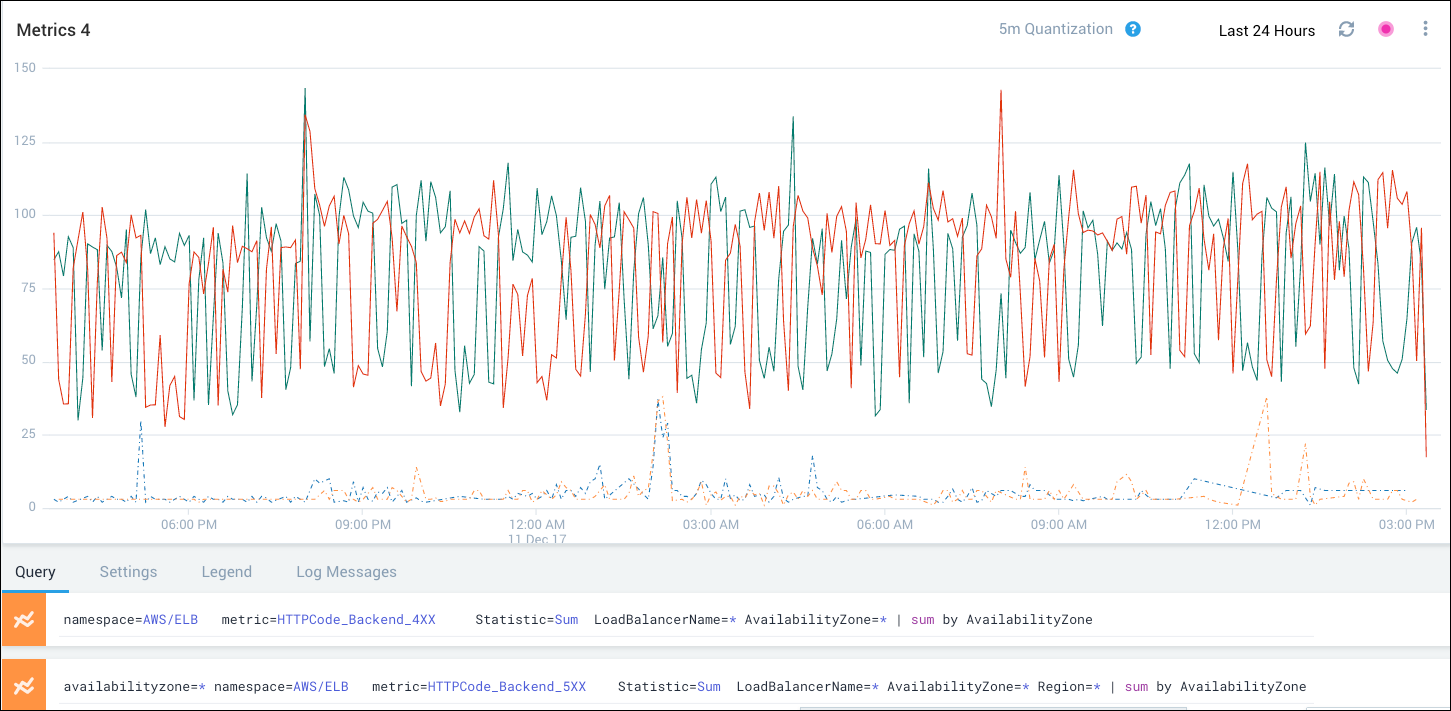
If you specify multiple queries, each is displayed as a separate set of time series charts. In the following example, the time series that match query A are shown with solid lines and the time series that matches query B is shown as a dotted line. See Create and Tailor Line and Area Metric Charts to learn about displaying particular time series and changing line styles.
How to construct a metrics query
On the Metrics page, click inside the query text box. When you first click inside the box, a help bubble opens to show the general query syntax:
SELECTORS [| OPERATOR | ...]
If you use logical operators in your query, follow this order of precedence, starting with most associative:
- = (dimension selector)
- NOT/! (either operator will work)
- AND (default operator, you don’t have to specify this one but you can)
- OR
The help bubble also includes examples:
_sourceCategory=category* metric=CPU_User | avg by _sourceHost prod.*.*.disk.space | max by node
To dismiss the bubble and display suggestions, press the spacebar. To dismiss the bubble without displaying suggestions, press esc.
Sometimes there may be a delay in updating the list of available choices following an update to the Source configuration. For example, there may be a delay of as much as 15 minutes following a change to the namespace configuration for CloudWatch metrics Sources. See Amazon CloudWatch Source for Metrics
Follow these guidelines to complete your queries:
Specify multiple pairs within a query for an AND, OR, or NOT/! match. If you enter multiple pairs manually, make sure to include a space between the
tag=valuepairs. For example, this query matchesHostMetricsAND the instance identifieri-e0b45532:_contentType=HostMetrics InstanceId=i-e0b455532Create up to six queries using multiple query text boxes. Each query is presented with its own graph or graphs in the chart area. See Interacting with Metric Charts for information on viewing and managing the display of multiple queries.
When you add a query, an additional query text box is added (up to six total). To delete any of the query text boxes, hover over the text box and click the Delete icon on the right.
You can use wildcard matches for selectors and/or values, as in these examples:
sys*and*temboth match systemfoo*matches all of the following:footag-a= foo1tag-b= tag-c=foo2
You can include aggregation functions and other operators, as in this example:
_sourceHost=sys1-cloudcollector-* metric=CPU_Idle | avg
Joined metrics queries
You can perform basic math operations (+, -, *, /) on two or more metrics queries. And in the expression of these values in a third row, you can associate and correlate information as needed in a single, joined visualization.
Math expressions support the same set of functions as the eval operator so you can use sin, cos, abs, log, round, ceil, floor, tan, exp, sqrt, min, and max.
Chart Rate of Traffic
If you are ingesting network information, you use metrics queries to chart your bytes going in (#A) and your outgoing traffic (#B). By removing A from B you can show your net difference of incoming and outgoing network traffic.
Define your incoming traffic as a rate and sum to simplify your data. For #A, enter:
metric\<network in byte\> | rate | sumDefine your outgoing traffic as a sum.
#B = metric\<network out byte\> | rate | sumSubtract #A from #B.
#B - #A(Optional) Adjust your Quantization level and Time Interval as needed.
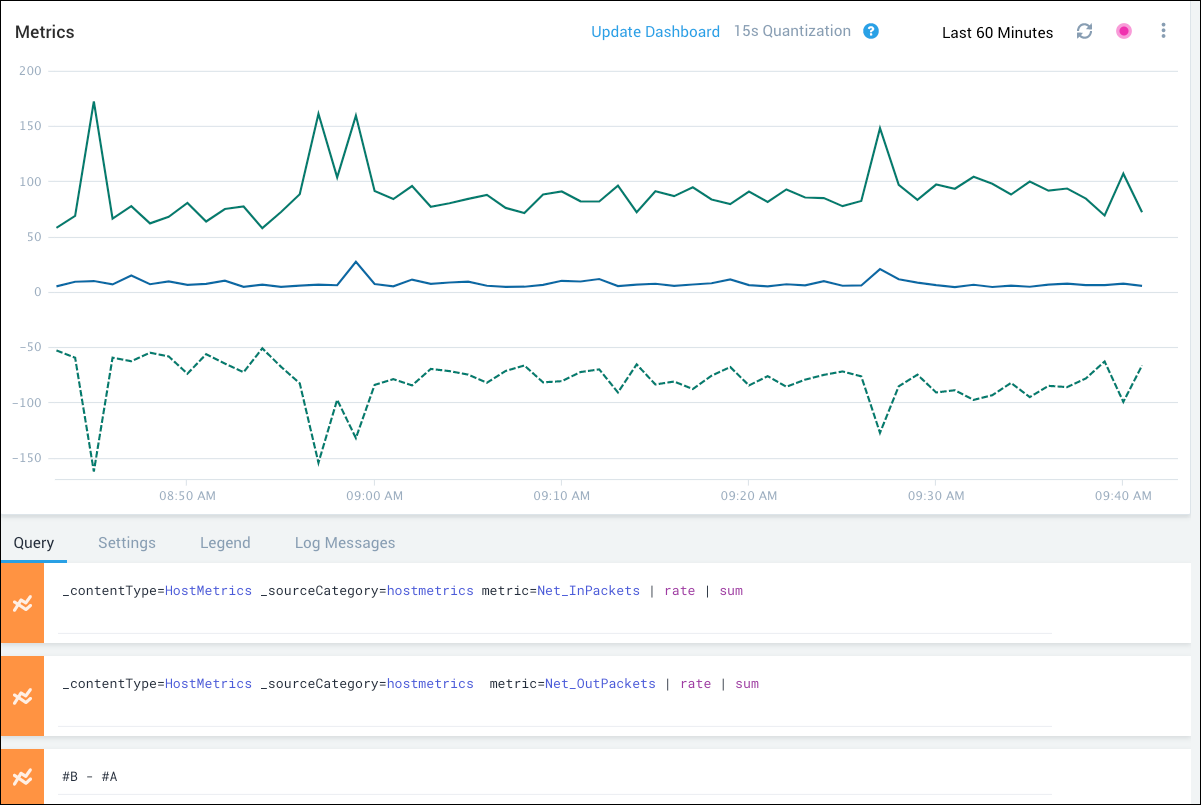
Hide the A and B rows, so that your visualization only shows the average.
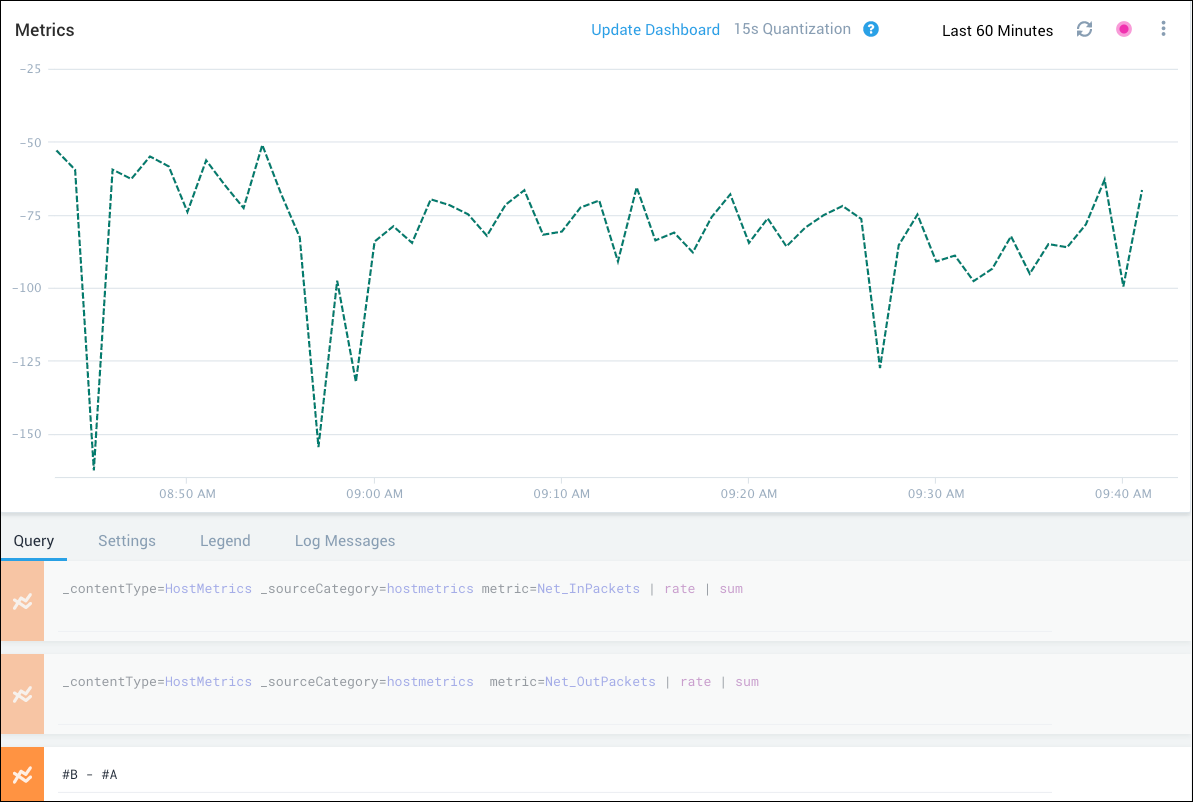
You now have a basic line chart of your rate of traffic over time.
Measuring CPU usage across your cluster
If you are interested in measuring CPU usage activity across nodes in a particular cluster, you can add the average user and system CPU utilization across this cluster.
- Take the average CPU use by user for source hosts in you cluster.
metric=CPU_User _sourceHost=cqsplitter | avg - Take the average CPU use by system for source hosts in your cluster.
metric=CPU_Sys _sourceHost=cqsplitter | avg - Add the two averages.
#A + #B - Clean up your view by hiding A and B.
.
The above graph suggests that CPU usage had suffered a spike on an average, but identify which nodes contributed to the spike. To get that, you want to calculate the sum of user- and system-cpu for each node individually.
To narrow down your query specify a particular source host:
- Instead of an average we'll look at all source hosts from a particular group, in this case cqsplitter.
metric=CPU_User _sourceHost=cqsplitter-* - Specify the CPU use by user for node you want to track in the cluster.
metric=CPU_Sys _sourceHost=cqsplitter-* - Now we'll use
along _sourceHostto evaluate the summation expression for each _sourceHost individually.#A + #B along _sourceHost
Finding outages and creating a baseline
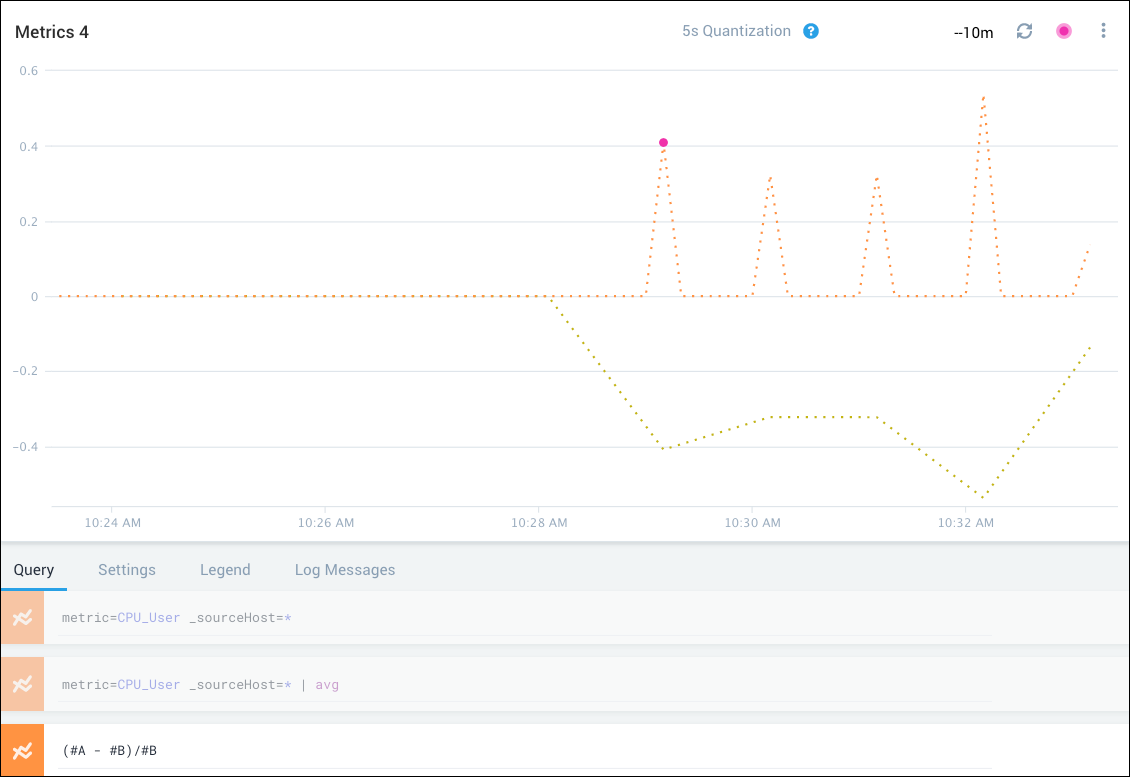
Now that we have the basic idea, let’s do something more complex. Let’s say that you’re curious about the level of CPU usage by your applications in your system and you want to create a baseline average.
We’ll start with a metric, CPU user and the same _sourceHost category, but we’ll create an average of the two and then a percentage.
Choose your metric for CPU usage by application and the source hosts you want to track:
metric=CPU_user _sourceHost=*Take an average of that of that metric.
metric=CPU_user _sourceHost=* | avgSee differences between your metric and your average.
(#A - #B)/#BIf the differences are subtle, you can multiply by 100 to make your visualization easier to read.
100* (#A - #B)/#BIf you want, you can hide your A and B query rows to make the visualization even easier to read.
Comparing today’s baseline to yesterday
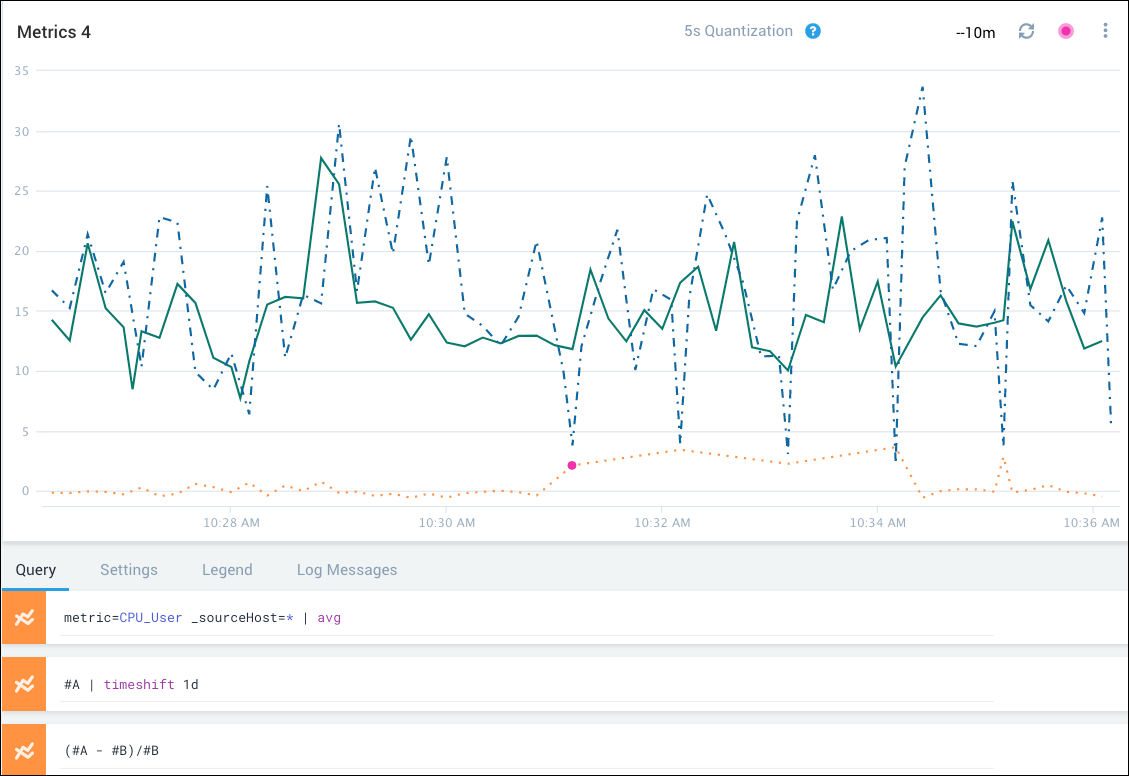
Another thing we can do with metrics queries and math operations is timeshift by our metrics by a day to compare today to yesterday. First we’ll start with creating a basic baseline as a math operation.
- Start with your average CPU usage for your source host for today.
metric=CPU_user _sourceHost=my_source_host | avg - Subtract today from yesterday’s average by using the query row and timeshift:
#A | timeshift 1d - See differences between your metric and your average.
(#A - #B)/#B - If the differences are subtle, you can multiply by 100 to make your visualization easier to read.
100* (#A - #B)/#B
Save a metric query
When you save a metric query, it will be saved the currently selected time range, chart options, outlier detection, and quantization settings to the Sumo Logic library. Timezone is saved using UTC format, as is the case for other search content in the library, so you can share content with users in different time zones without problem.
Follow these steps to save a metric query.
- Enter a metric query, and run it to make sure it returns results. Before Sumo Logic saves a metric query, it validates the query syntax, but does not not run the query.
- Click the save icon in the upper right corner of the metric query tab. Alternatively, you can select Save As from the three-dot more options menu, also in the upper right corner of the metric query tab.
- The Save Item popup appears.
- Name. Enter a name for the metric query
- Navigate to the folder where you want to save the query.
- Click Save.
Metric query errors
Sumo Logic will present an error message when a metric query times out or returns too many matching time series.
Too many time series
For a single metrics query row, Sumo limits input time series at 1000 for non-aggregate queries and 15000 for aggregate queries (queries that have an aggregate operator like avg and max). The input time series is the time series before aggregation that match the selector.
When a metric query returns more than 1000 time series, Sumo limits the number of time series in the visualization and any aggregate calculations, and presents a message like this:
Too many time-series matched '(query-selectors)'. Displaying n of m+ matching series. Add more filters to select fewer time series or apply an aggregation function
Where:
query-selectorsare the selectors you used in your query.nis the number of time series displayed in the visualization.mis the number of time series that matched your query.
If the query that results in the message contains an aggregation operator, the results presented are likely to be erroneous because the aggregation will be based on only 1000 time series.
One solution is to add additional selectors to your query to reduce the number of time series returned, for example, by adding additional tag=value pairs to the query. You can also filter the time series returned using the topk, bottomk, and filter operators.
Long-running metric query
For a single metrics query request, Sumo limits the output time series at 1000 for visualization. Output time series can either exceed the limit for a single row or multiple rows combined.
When a metric query runs for 30 seconds, it will time out, and Sumo will present a message like this:
The metrics query timed out. Please consider making the query more selective.
The error might results from the query matching too many time series, but it could also be caused by other conditions, for instance a backend failure or problem.