Google Cloud Functions
The Google Cloud Functions App enables you to monitor your usage of Google Cloud Functions. The App preconfigured dashboards provide insight into function executions, operations, latency, errors, and failures.
Log Types
This app uses the following logs:
- Google Cloud Audit Logs - Logs events on multiple GCP services, including Cloud Functions.
- Google Cloud Functions Logs - Debug information of function executions.
Sample Query
_sourceCategory=*gcp* logName textPayload "\"type\":\"cloud_function\"" "\"textPayload\":\"Function execution took"
| parse regex "\"logName\":\"(?<log_name>[^\"]+)\""
| where log_name matches "projects/*/logs/cloudfunctions.googleapis.com%2Fcloud-functions"
| json "message.data.resource.labels" as labels
| json field=labels "function_name", "project_id", "region" as function, project, region
| timeslice 1h
| count as executions by _timeslice
| compare with timeshift 1d 7 avg
Collecting Logs for the Google Cloud Functions App
This section describes the Sumo pipeline for ingesting logs from Google Cloud Platform (GCP) services and provides instructions for configuring log collection for the Google Cloud Functions App.
Collection Process for GCP Services
The key components in the collection process for GCP services are Google Logs Export, Google Cloud Pub/Sub, and Sumo’s Google Cloud Platform (GCP) source running on a hosted collector.
The GCP service generates logs which are exported and published to a Google Pub/Sub topic through Stackdriver. You will then set up a Sumo Logic Google Cloud Platform source that subscribes to this topic and receives the exported log data.
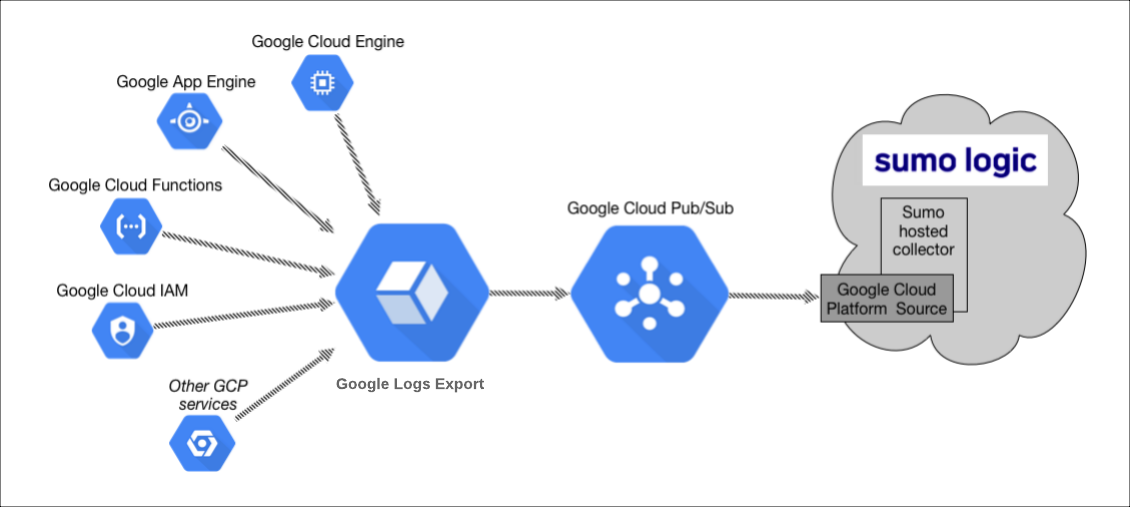
Configuring collection for GCP uses the following process:
- Configure a GCP source on a hosted collector. You'll obtain the HTTP URL for the source.
- Create a topic in Google Pub/Sub and subscribe the GCP source URL to that topic.
- Create an export of GCP logs from Google Stackdriver Logging. Exporting involves writing a filter that selects the log entries you want to export, and choosing a Pub/Sub as the destination. The filter and destination are held in an object called a sink.
See the following sections for configuration instructions.
Configure a Google Cloud Platform Source
The Google Cloud Platform (GCP) Source receives log data from Google Pub/Sub.
You can use the same GCP Source to receive log data from multiple GCP services. For example, you can send logs collected from Google Cloud Application Engine, Google Cloud IAM, and Google Cloud Audit.
However, this is not recommended since you cannot define specific Source Category values to each GCP service. If you create a GCP Source for each service you can define a specific Source Category to each service.
This Source will be a Google Pub/Sub-only Source, which means that it will only be usable for log data formatted as data coming from Google Pub/Sub.
- In Sumo Logic select Manage Data > Collection > Collection.
- Select an existing Hosted Collector upon which to add the Source. If you don't already have a Collector you'd like to use, create one, using the instructions on Configure a Hosted Collector.
- Click Add Source next to the Hosted Collector and click Google Cloud Platform.
- Enter a Name to display for the Source. A Description is optional.
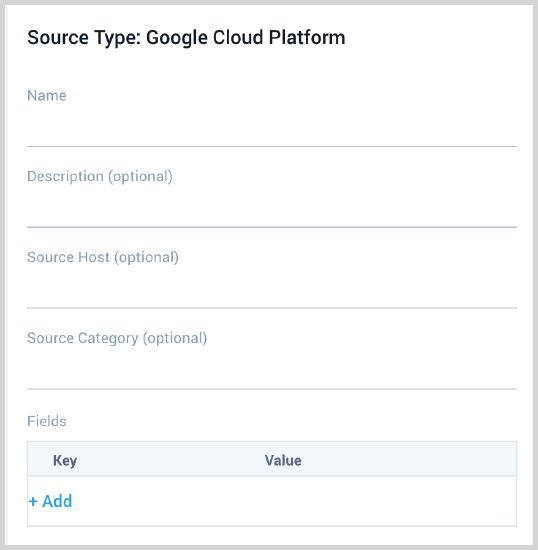
- Source Host (Optional). The Source Host value is tagged to each log and stored in a searchable metadata field called _sourceHost. Avoid using spaces so you do not have to quote them in keyword search expressions. This can be a maximum of 128 characters.
- Source Category (Optional). The Source Category value is tagged to each log and stored in a searchable metadata field called
_sourceCategory. See our Best Practices: Good Source Category, Bad Source Category. Avoid using spaces so you do not have to quote them in keyword search expressions. This can be a maximum of 1,024 characters. - Fields. Click the +Add Field link to add custom log metadata Fields, then define the fields you want to associate. Each field needs a name (key) and value. Look for one of the following icons and act accordingly:
 If an orange triangle with an exclamation point is shown, use the option to automatically add or enable the nonexistent fields before proceeding to the next step. The orange icon indicates that the field doesn't exist, or is disabled, in the Fields table schema. If a field is sent to Sumo that does not exist in the Fields schema or is disabled it is ignored, known as dropped.
 If a green circle with a checkmark is shown, the field exists and is already enabled in the Fields table schema. Proceed to the next step.
- Advanced Options for Logs.
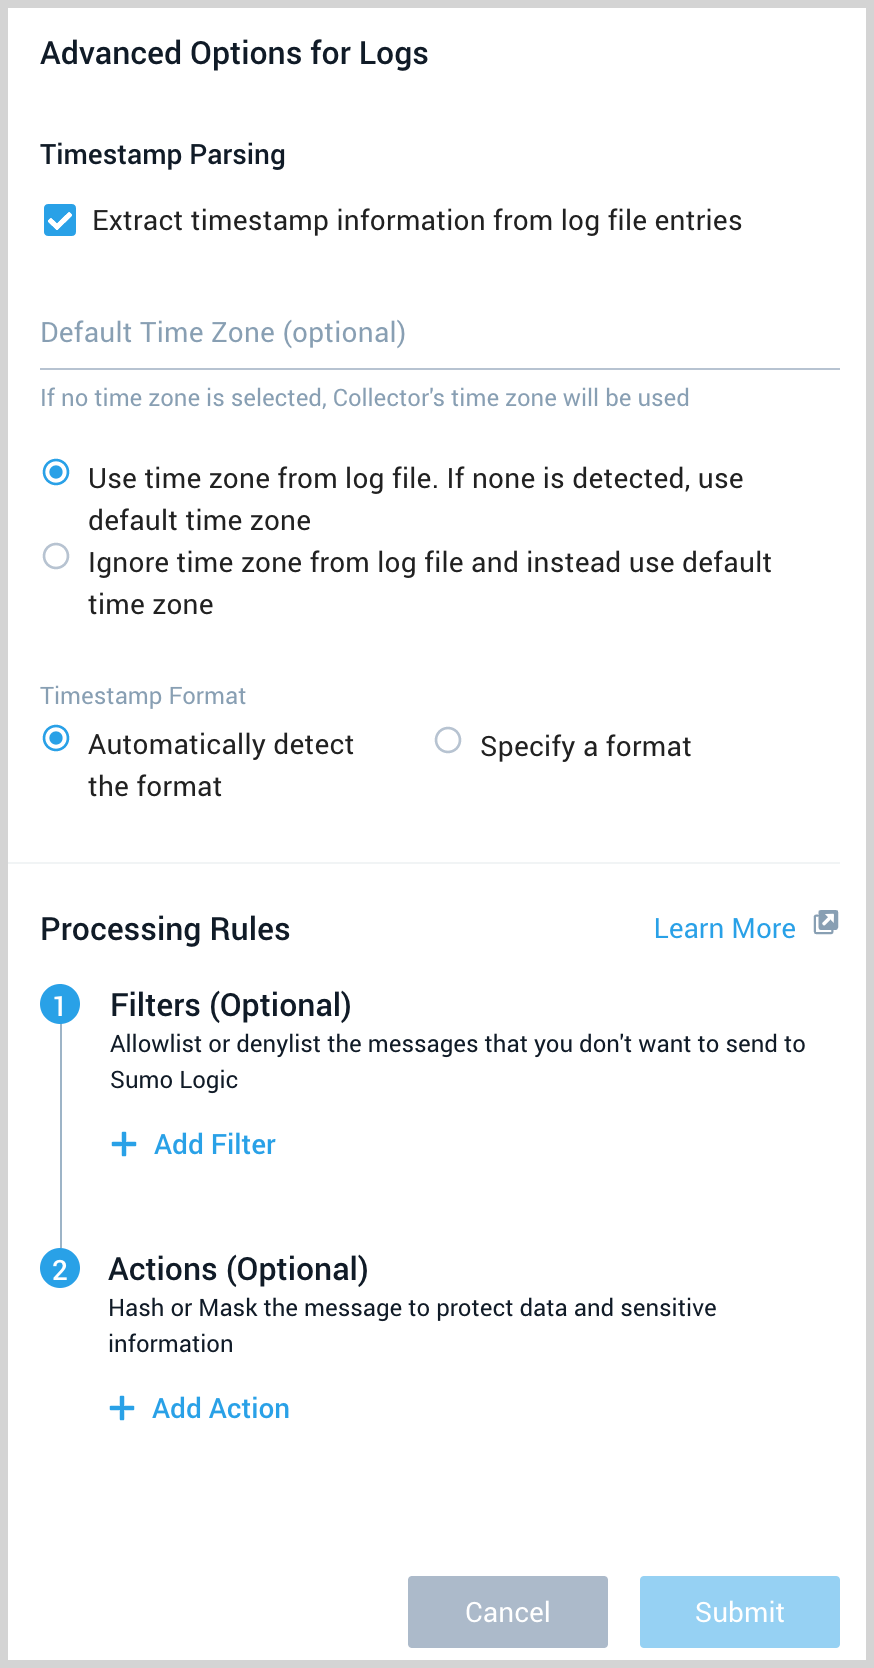
- Timestamp Parsing. This option is selected by default. If it's deselected, no timestamp information is parsed at all.
- Time Zone. There are two options for Time Zone. You can use the time zone present in your log files, and then choose an option in case time zone information is missing from a log message. Or, you can have Sumo Logic completely disregard any time zone information present in logs by forcing a time zone. It's very important to have the proper time zone set, no matter which option you choose. If the time zone of logs can't be determined, Sumo Logic assigns logs UTC; if the rest of your logs are from another time zone your search results will be affected.
- Timestamp Format. By default, Sumo Logic will automatically detect the timestamp format of your logs. However, you can manually specify a timestamp format for a Source. See Timestamps, Time Zones, Time Ranges, and Date Formats for more information.
- Processing Rules. Configure any desired filters, such as allowlist, denylist, hash, or mask, as described in Create a Processing Rule.
- When you are finished configuring the Source, click Save.
Configure a Pub/Sub Topic for GCP
You need to configure a Pub/Sub Topic in GCP and add a subscription to the Source URL that belongs to the Sumo Logic Google Cloud Platform Source you created. Once you configure the Pub/Sub, you can export data from Google Logging to the Pub/Sub. For example, you can export Google App Engine logs, as described on Collect Logs for Google App Engine.
- Create a Pub/Sub Topic in GCP. See Google Cloud documentation for the latest configuration steps.
- Create a Pub/Sub subscription to the Source URL that belongs to the Sumo Logic Google Cloud Platform Source you created. See Google Cloud documentation for the latest configuration steps.
- Use a Push Delivery Method to the Sumo Logic Source URL. To determine the URL, navigate to the Source on the Collection page in Sumo Logic and click Show URL.
Limitations
Google limits the volume of data sent from a Topic. Our testing resulted in the following data limits:
| Topics | Megabytes per second | Payload size |
|---|---|---|
| One | 18 MBps (1.5 TB/day) | 100 KB |
| One | 6 MBps (0.5 TB/day) | 2.5 KB |
These limits may vary based on your setup and are based on our previous tests.
We recommend the following:
- Shard messages across topics within the above data limits.
- Ask GCP to increase the allowable capacity for the topic.
Create export of Google Cloud Function logs from Google Logging
In this step you export logs to the Pub/Sub topic you created in the previous step.
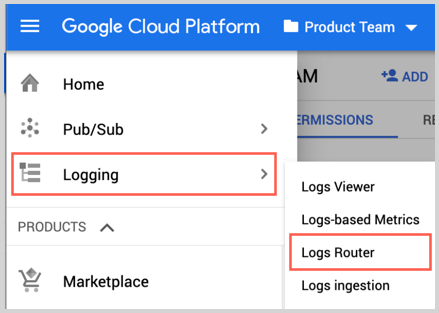
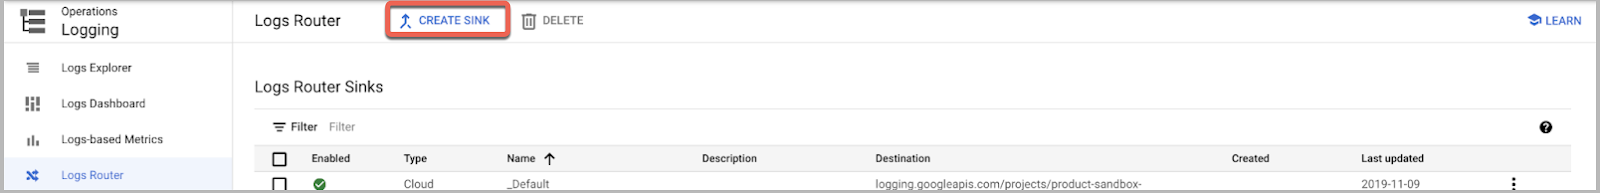
- Go to Logging and click Logs Router.
- Click Create Sink.
- As part of Create logs routing sink, add the following information.
- Enter a Sink Name. For example, "gce-vm-instance".
- Select "Cloud Pub/Sub" as the Sink Service.
- Set Sink Destination to the Pub/Sub topic you created in the Google Cloud Platform Source procedure. For example, "pub-sub-logs".
- In Choose logs to include in sink section for
resource_type, replace"<resource_variable>"with"cloud_function". - Click Create Sync.
Installing the Google Cloud Functions App
Now that you have set up collection for Google Cloud Functions, install the Sumo Logic App to access the pre-configured searches and dashboards.
Locate and install the app you need from the App Catalog. If you want to see a preview of the dashboards included with the app before installing, click Preview Dashboards.
To install the app:
- From the App Catalog, search for and select the app.
- Select the version of the service you're using and click Add to Library. Version selection is applicable only to a few apps currently. For more information, see Installing the Apps from the Library.
- To install the app, complete the following fields.
- App Name. You can retain the existing name, or enter a name of your choice for the app.
- Data Source. Select either of these options for the data source.
- Choose Source Category, and select a source category from the list.
- Choose Enter a Custom Data Filter, and enter a custom source category beginning with an underscore. Example: (
_sourceCategory=MyCategory).
- Advanced. Select the Location in Library (the default is the Personal folder in the library), or click New Folder to add a new folder.
- Click Add to Library.
Once an app is installed, it will appear in your Personal folder, or other folder that you specified. From here, you can share it with your organization.
Panels will start to fill automatically. It's important to note that each panel slowly fills with data matching the time range query and received since the panel was created. Results won't immediately be available, but with a bit of time, you'll see full graphs and maps.
Viewing Google Cloud Functions Dashboards
You can use the pre-configured searches and dashboards for visibility into your environment with visual displays of real-time performance analytics and overall usage.
Overview
See an overview of Google Cloud Function processing; including daily executions; execution by status, execution outliers by function, and the top 10 functions by executions, average latency, and error status.
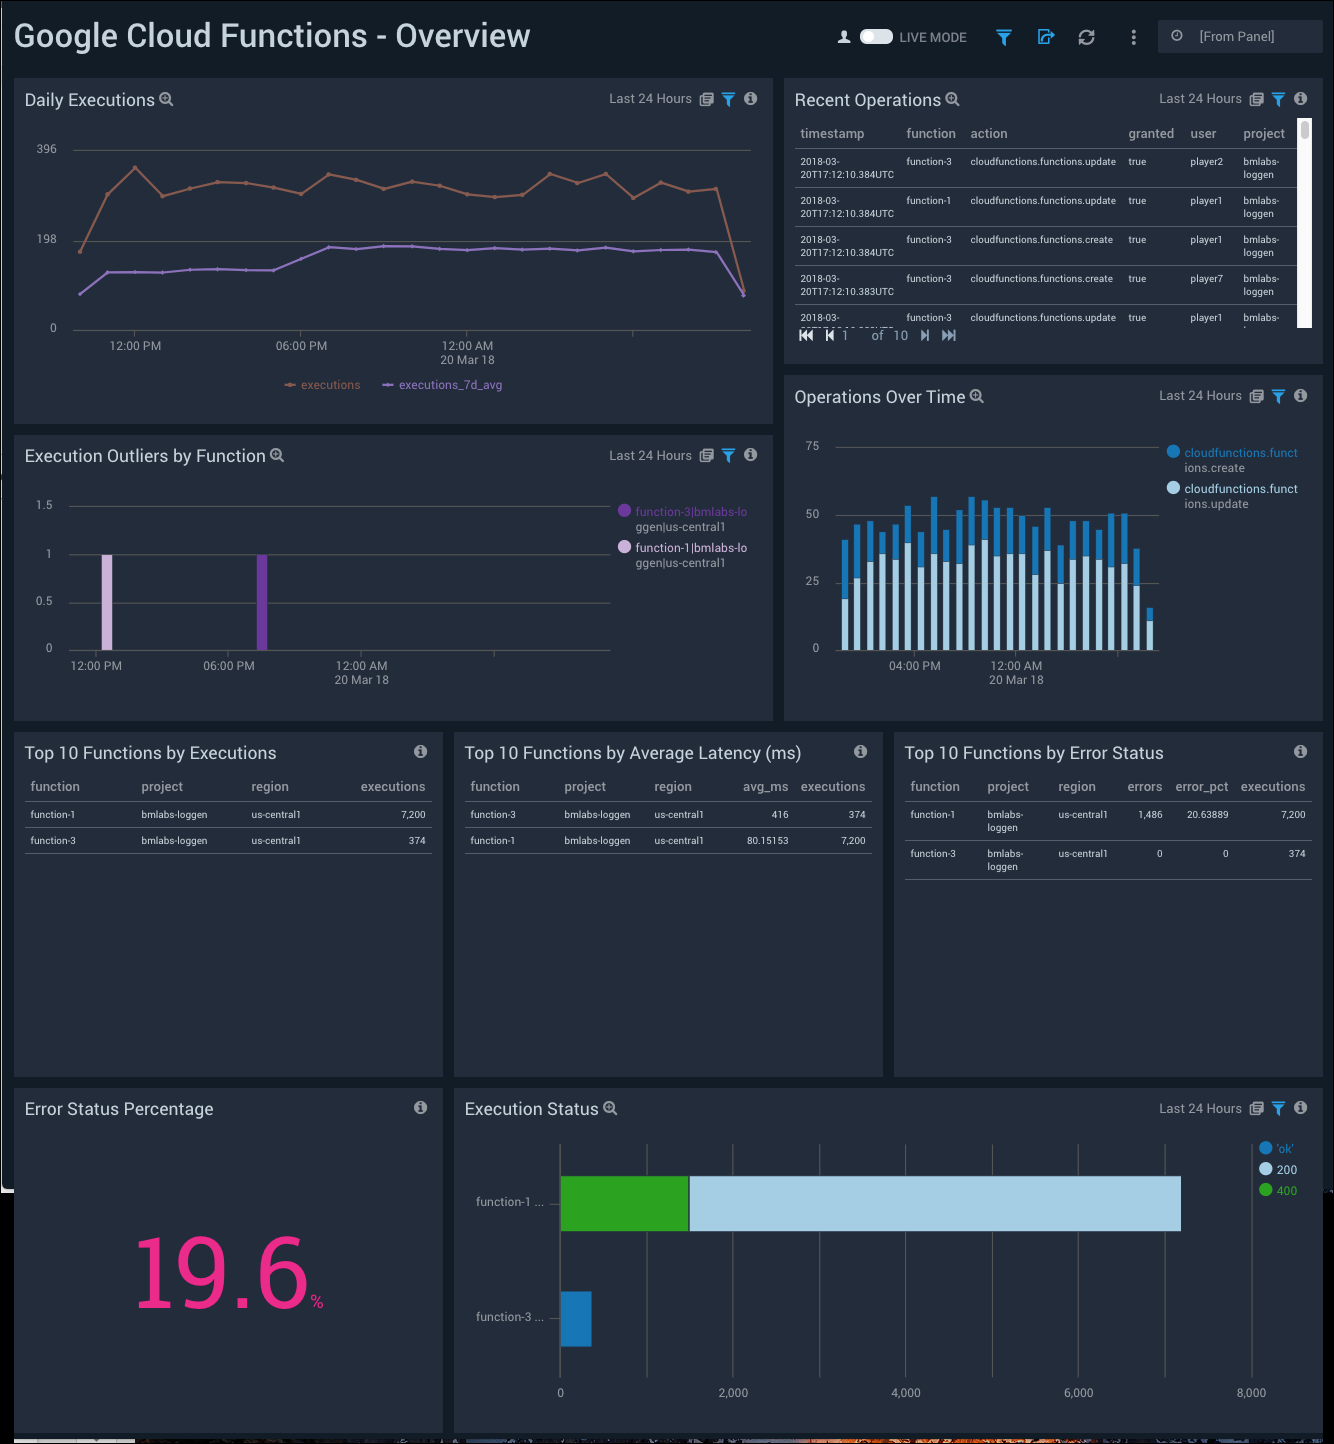
Daily Executions. A line chart that shows the count of daily executions, per one hour timeslice over the last 24 hours.
Recent Operations. A table that shows recent operations over the last 24 hours, including function, action, granted, user, and project.
Execution Outliers by Function. A column chart that shows execution outliers by functions over the last 24 hours.
Operations Over Time. A stacked column chart that shows the number of operations over the last 24 hours.
Top 10 Functions by Executions. A table that shows the top 10 functions by executions over the last 24 hours.
Top 10 Functions by Average Latency (ms). A table that shows the top 10 functions by average latency over the last 24 hours.
Top 10 Functions by Error Status. A table that shows the top 10 functions by error status over the last 24 hours.
Error Status Percentage. The percentage of error statuses in the last 24 hours.
Execution Status. A bar chart with the count of execution statuses in the last 24 hours.
Statistics
See statistical summaries of function executions, latency, errors, and failures.
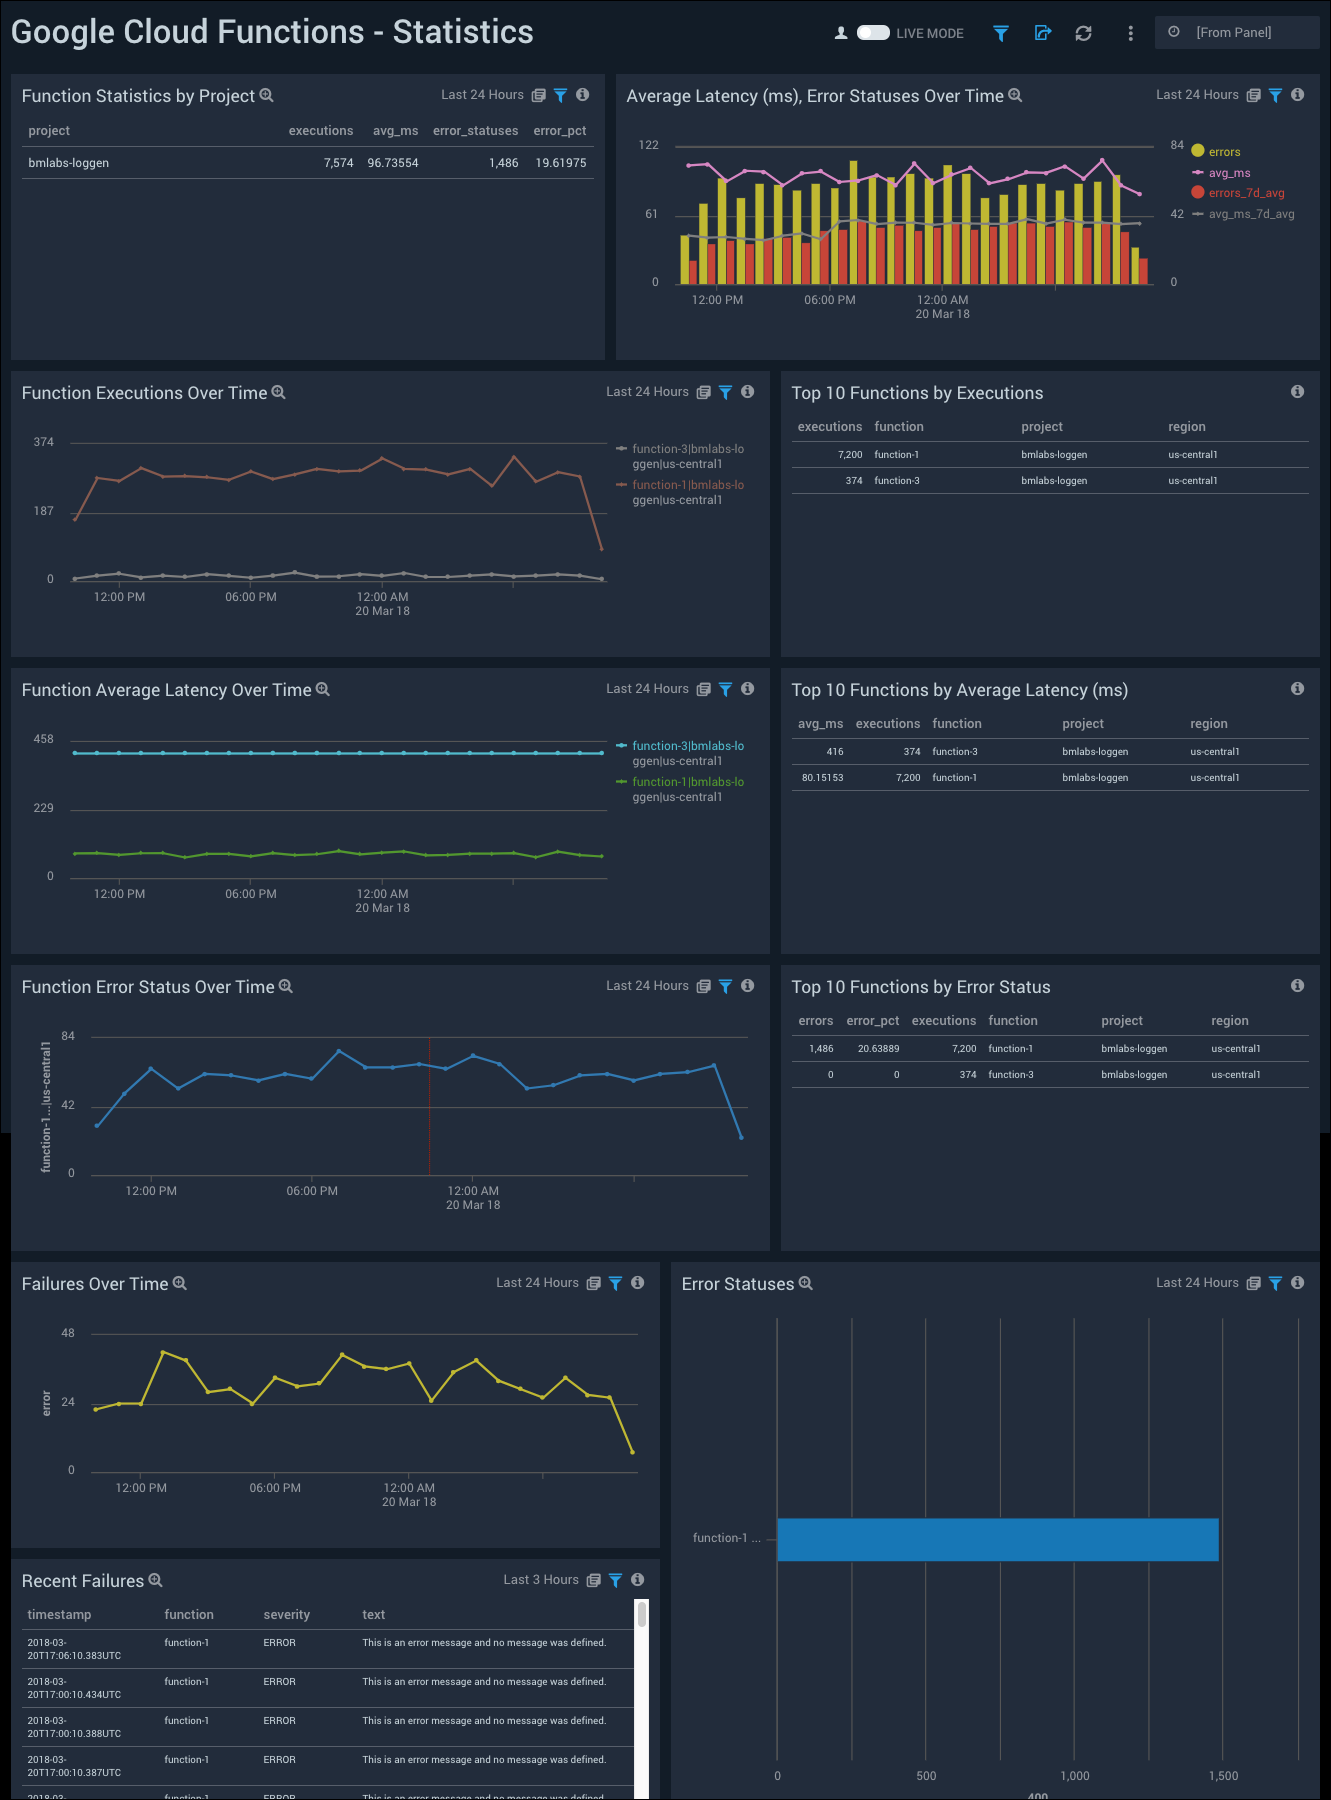
Function Statistics by Project. A table with function statistics by project in the last 24 hours.
Average Latency (ms), Error Statuses Over Time. A line chart that shows a count of average latency over the last 24 hours. And a column chart with a count of error status in the last 24 hours.
Function Executions Over Time. A line chart showing the count of function executions in the last 24 hours.
Top 10 Functions by Executions. A table listing the top 10 functions by executions in the last 24 hours.
Function Average Latency Over Time. A line chart showing a count of average function latency in the last 24 hours.
Top 10 Functions by Average Latency (ms). A table listing the top 10 functions by executions in the last 24 hours.
Function Error Status Over Time. A line chart showing a count of function error statuses in the last 24 hours.
Top 10 Functions by Error Status. A table listing the top 10 functions by error statuses in the last 24 hours.
Failures Over Time. A line chart showing a count of failures in the last 24 hours.
Recent Failures. A table that shows recent failures over the last 24 hours, including function, severity, and the text.
Error Statuses. A bar chart that shows the count of error statuses in the last 24 hours.
Advanced Metrics
See trends over time and outliers for executions per hour, average latency per hour, and error status per hour.
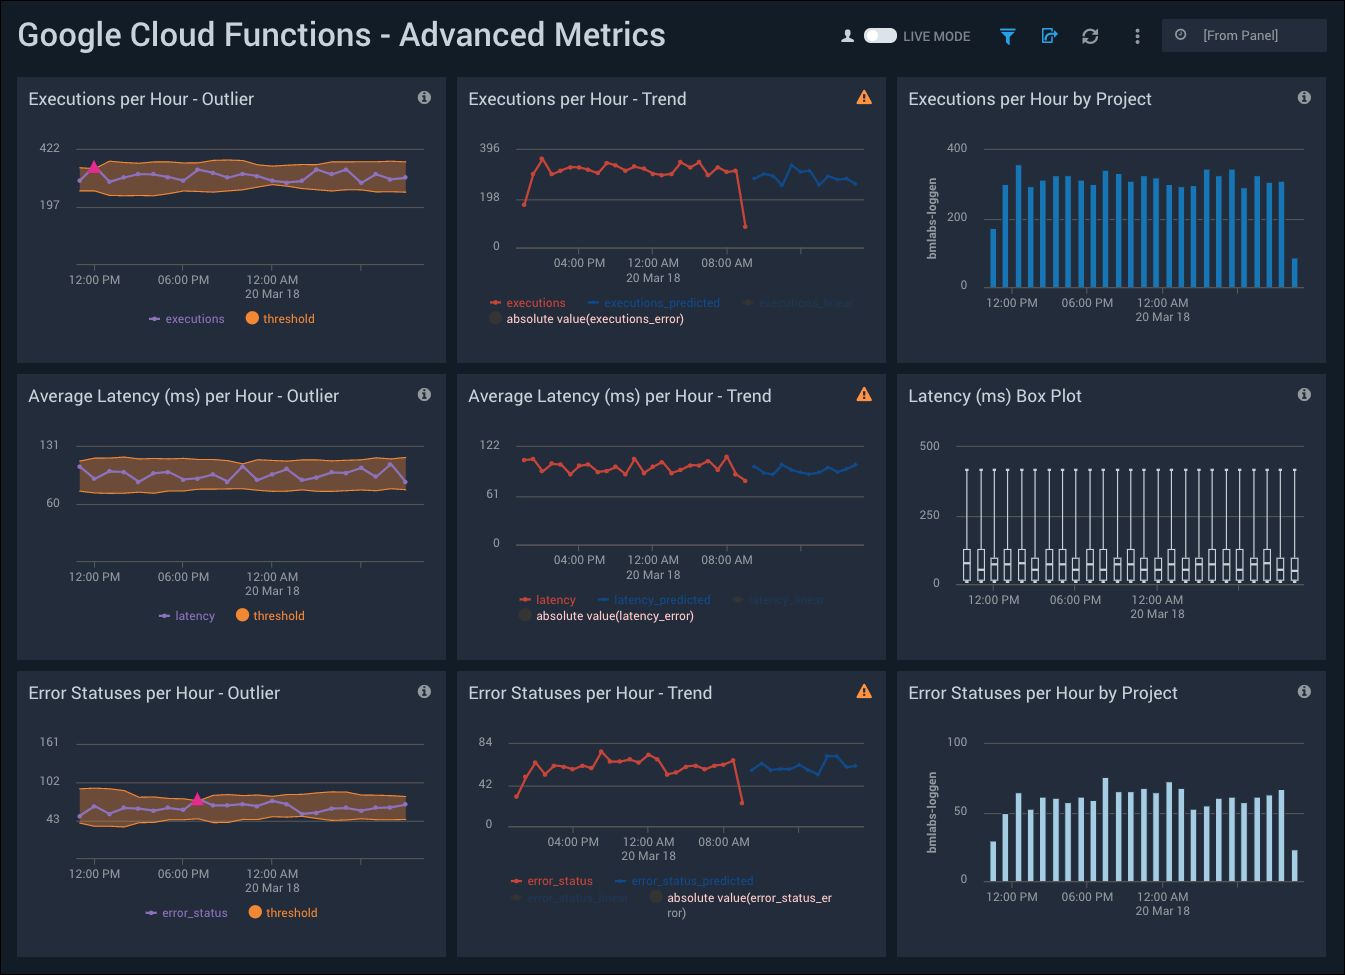
Executions per Hour - Outlier. A line chart that shows when the count of executions per hour varies by a statistically significant amount, three or more standard deviations, from the running average, over the last 24 hours.
Executions per Hour - Trend. A line chart that shows the count of executions per hour over the last 24 hours, along with a prediction in the trend of counts of executions.
Executions per Hour by Project. A column chart that shows the count of executions per hour by project, over the last 24 hours.
Average Latency (ms) per Hour - Outlier. A line chart that shows when the count of average latency per hour varies by a statistically significant amount, three or more standard deviations, from the running average, over the last 24 hours.
Average Latency (ms) per Hour - Trend. A line chart that shows the count of average latency per hour over the last 24 hours, along with a prediction in the trend of counts of average latency.
Latency (ms) Box Plot. A box plot chart with maximum, upper quartile, median, lower quartile, minimum count of latency in the last 24 hours.
Error Statuses per Hour - Outlier. A line chart that shows when the count of error statuses per hour varies by a statistically significant amount, three or more standard deviations, from the running average, over the last 24 hours.
Error Statuses per Hour - Trend. A line chart that shows the count of error statuses per hour over the last 24 hours, along with a prediction in the trend of counts of average latency.
Error Statuses per Hour by Project. A column chart that shows the count of error statuses per hour by project, over the last 24 hours.