Real User Monitoring (RUM)
Real User Monitoring (RUM) gives you the ability to understand how users interact with the digital interfaces of your business and if their experience is satisfactory or not. This open-source powered and flexible capability brings you full visibility into what’s happening in your user's browser while interacting with your web applications.
RUM provides you visibility into end-to-end individual user transactions to quickly understand the user experience. You'll get insights into delays that occurred on the client, overall end-to-end transaction times, network timings, rendering events, and can perform high-level monitoring, alerting, as well as troubleshooting any potential slow-downs. You have full details about the specific performance of top user cohorts, their geographical locations, browsers, and operating systems. You can also fully understand the overall experience of all users and transactions of your digital business, all the time.
How it works
The Sumo Logic OpenTelemetry auto-instrumentation for JavaScript library enables RUM data collection in the form of OpenTelemetry-compatible traces and logs directly from the browser. It gathers information about the load, execution, and rendering of your JavaScript applications and records information about browser-to-backend performance of every user transaction in real time, without sampling.
This data is gathered directly from your end-user devices and displayed as individual spans representing user-initiated actions (like clicks or document loads) at the beginning of each trace, reflecting its request journey from the client throughout the whole application and back. This includes any unhandled errors, exceptions, and console errors generated by the browser.
All data collected is compatible with OpenTelemetry and doesn't use proprietary vendor code. Real user monitoring supports document load actions as well as XHR communication and route changes for single-page app navigation. The full list of functionalities and configuration is available in the Sumo Logic OpenTelemetry auto-instrumentation for JavaScript README file.
See Real User Monitoring in action.
What You'll Need
| Account Type | Account Level |
|---|---|
| Credits | Enterprise Operations and Enterprise Suite. Essentials get up to 5 GB a day. |
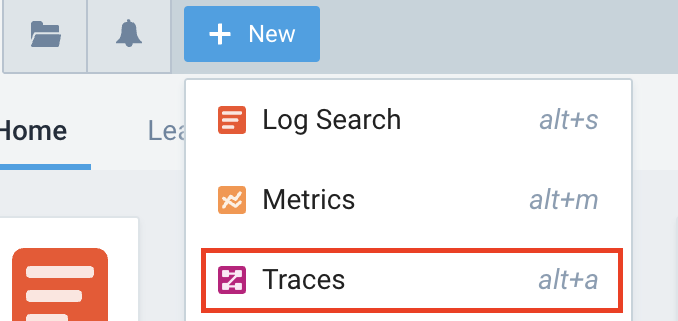
To confirm that your Sumo Logic service package has been upgraded to include Traces and Real User Monitoring, click the +New button and you'll see Traces in the dropdown.
Guides
📄️ Configuring RUM Data Collection
Learn how to collect Traces and RUM metrics from a browser using a RUM HTTP Traces Source.
📄️ RUM Browser Traces
To collect browser RUM traces, create a trace query that specifies traces starting with the value you gave to `` as a root service name. You can also include the following filters as an operation name:
📄️ RUM Metrics
RUM metrics are automatically generated for you from browser traces. They provide insight into your website's overall user experience as well as front-end services, operating systems, geographical locations, and top-loaded page groups and user cohorts categorized by their browsers.
📄️ RUM Dashboards
Learn how to use the Sumo Logic Real User Monitoring (RUM) Dashboards to gain visibility into application performance and end-user activity such as geographic location, browser type, operating systems used.