limit Search Operator
The limit operator reduces the number of raw messages or aggregate results returned. If you simply query for a particular term, for example "error" without using an aggregation operator such as group by, limit will reduce the number of raw messages returned. If you first use group-by or other aggregation operator, the limit operator will reduce the number of grouped results instead.
The limit operator is useful for creating lists of events for a Dashboard, which allows you to see at a glance, for example, the "Top 10" service operations, system operations, errors, or other system or user activities.
Sumo Logic Apps often use the limit operator in queries to display system data in Dashboards for various uses.
Syntax
limit #
Rules
- The limit operator supports requests for up to 10,000 results. You can't use "limit 10001" or more.
Examples
Top 10 errors
In this example, we simply query for the term "error" without using an aggregation operator, and limit will reduce the number of raw messages returned to 10.
error *
| limit 10
The message tab displays only the first 10 error messages for the time range you have queried.
Count Top 5 errors for a source
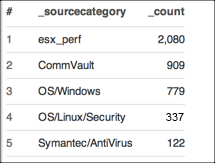
In this query, you can search for errors, count by the _sourceCategory, sort by the count, and limit the results to the top 5 errors.
error *
| count by _sourceCategory
| sort by _count | limit 5
which would provide results similar to:

Top 10 Service Operations:
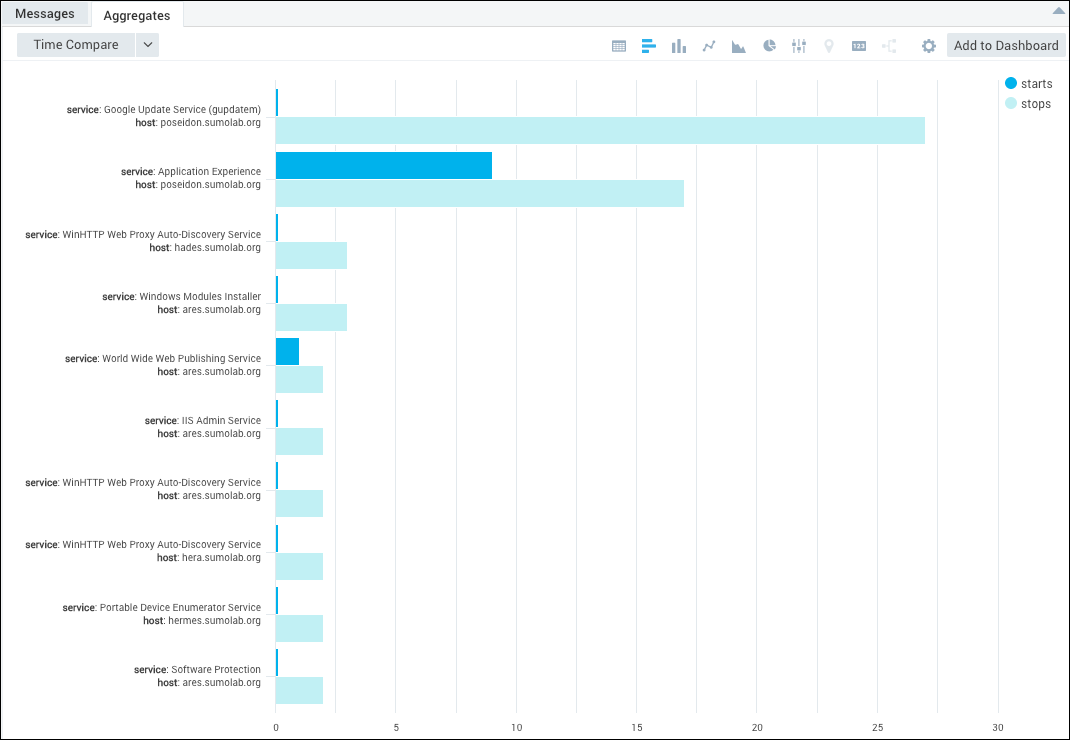
In this query, you can see the top 10 Windows services per host that have started and stopped over the last 10 hours.
_sourceCategory=OS/Windows Service Control Manager
| parse regex "Message = \"The (?<service>\w.+?) service entered the (?<state>\w+) state"
| parse regex "ComputerName = \"(?<host>[^\"]+)\";"
| if(state="running", 1, 0) as starts
| if(state="stopped",1,0) as stops
| sum(starts) as starts, sum(stops) as stops by service,host
| sort by stops, starts
| limit 10
which can be displayed in a bar chart like this:

See Sort operator for more information.