Navigate Messages in Search Results
When you run a search, the results are displayed in the Messages tab. If the search includes an aggregation, an Aggregates tab will also be displayed.

The Signatures tab is shown when using LogReduce.

Column adjustments
The table columns can be modified by the following:
- Move a Column. To move a column, click and hold down your mouse button on the column, then drag it to a new location.
- Change column width. To adjust the column width, click and hold the vertical line separating the columns, and drag it left or right.
- Change column height. Double click the vertical line to the right of a column name to automatically resize the width to fit the content.
- Pin columns: You can pin columns in the table, either in the Messages tab or the Aggregates tab. When a column is pinned, you can scroll to the right and still view it. To pin a column, hover over the column header, and click the pin icon that appears.
After you’ve pinned a column, the pin icon has a slash through it. You can click the icon to unpin the column.
Expand and Collapse
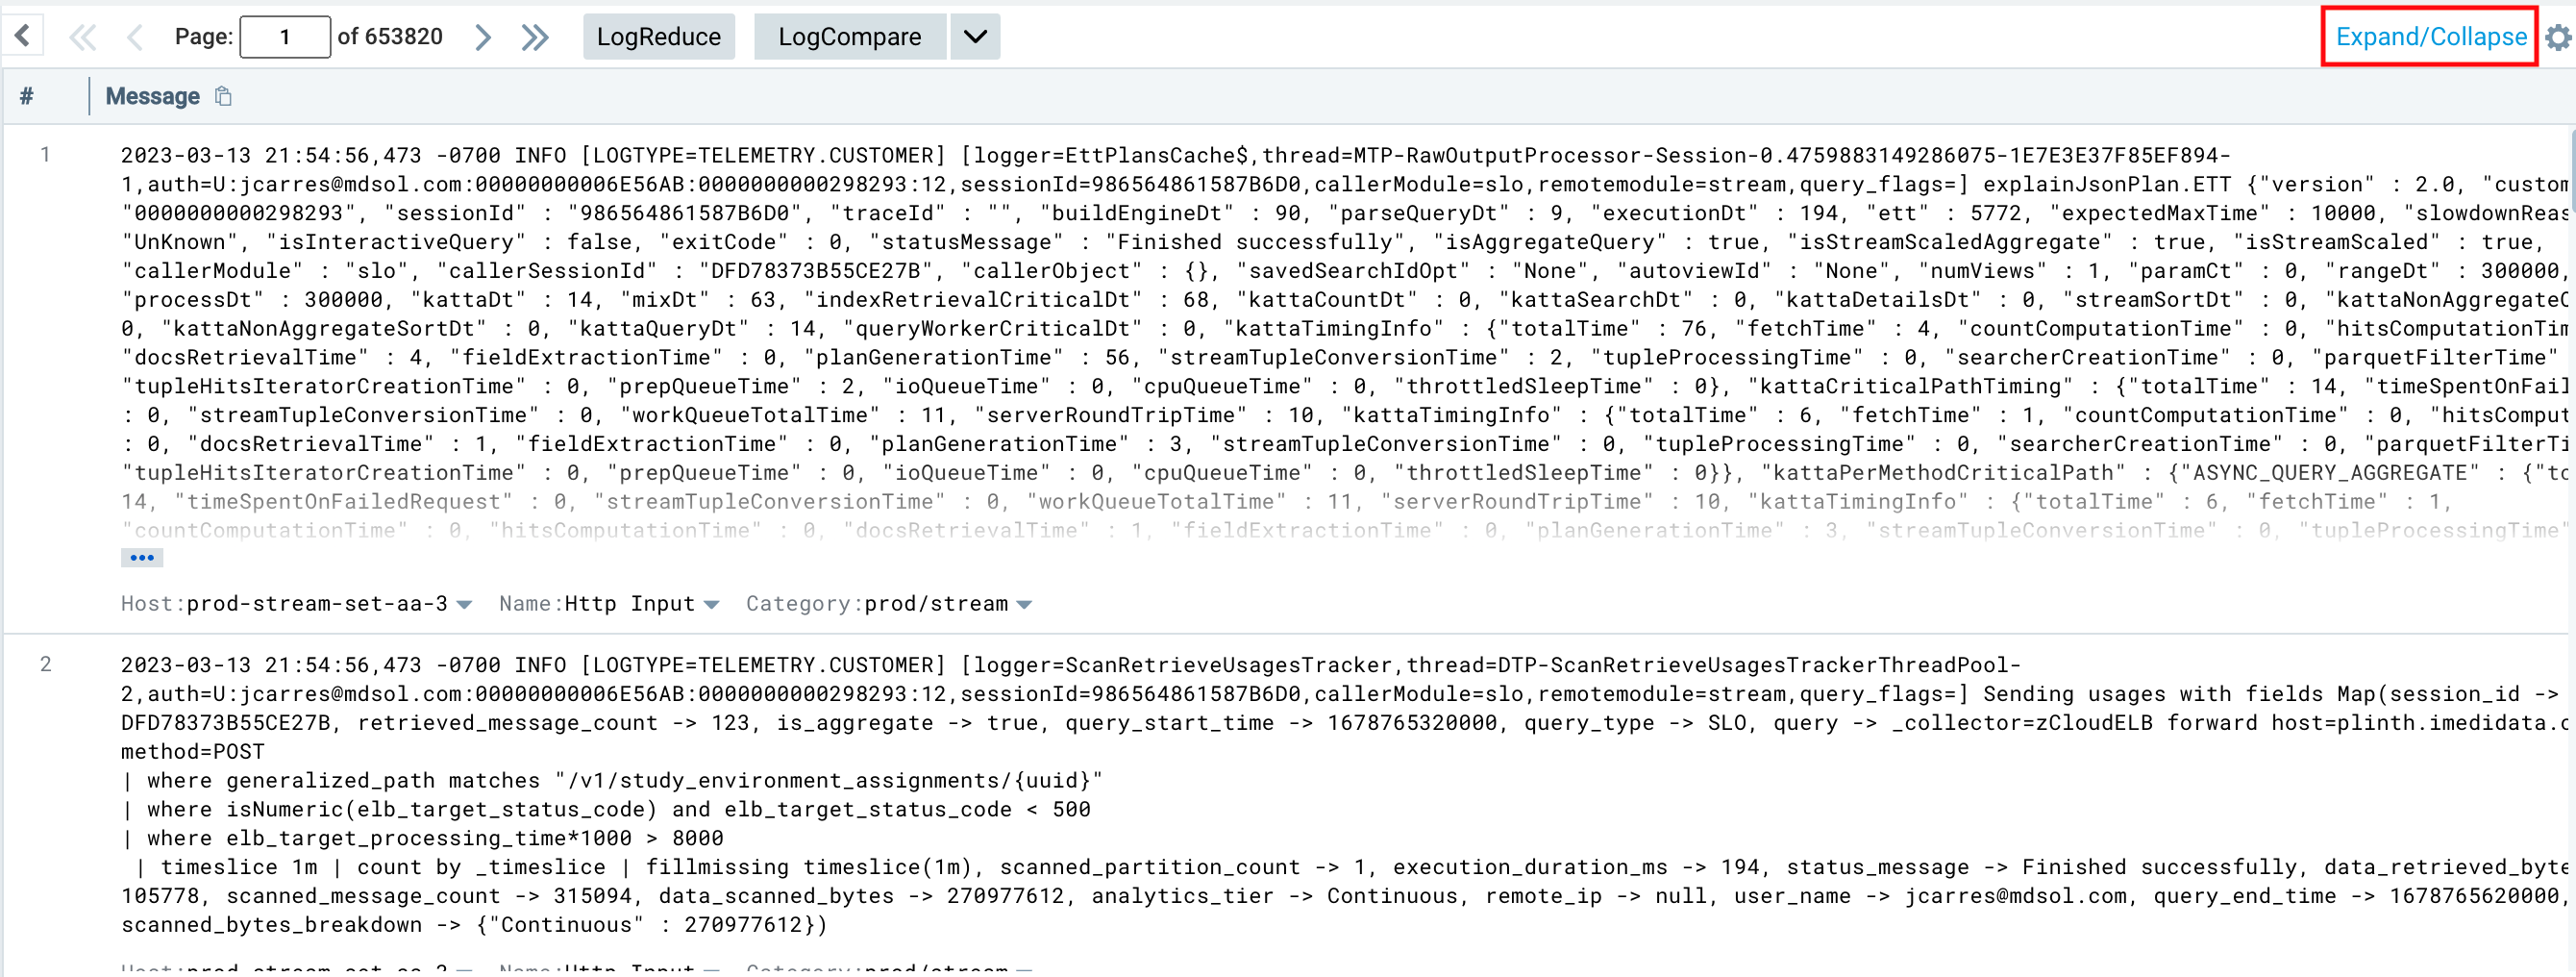
By default, the Messages tab shows the collapsed version of messages with each row showing up to 10 lines. To see the full contents of all log messages, including JSON logs, click the Expand/Collapse button on the upper right side of the Messages table and choose either Expand All Rows or Expand All Rows And JSON option.

Click Expand/Collapse on the upper right side of the Messages table, then select Collapse All Rows to switch back to the initial collapsed view.
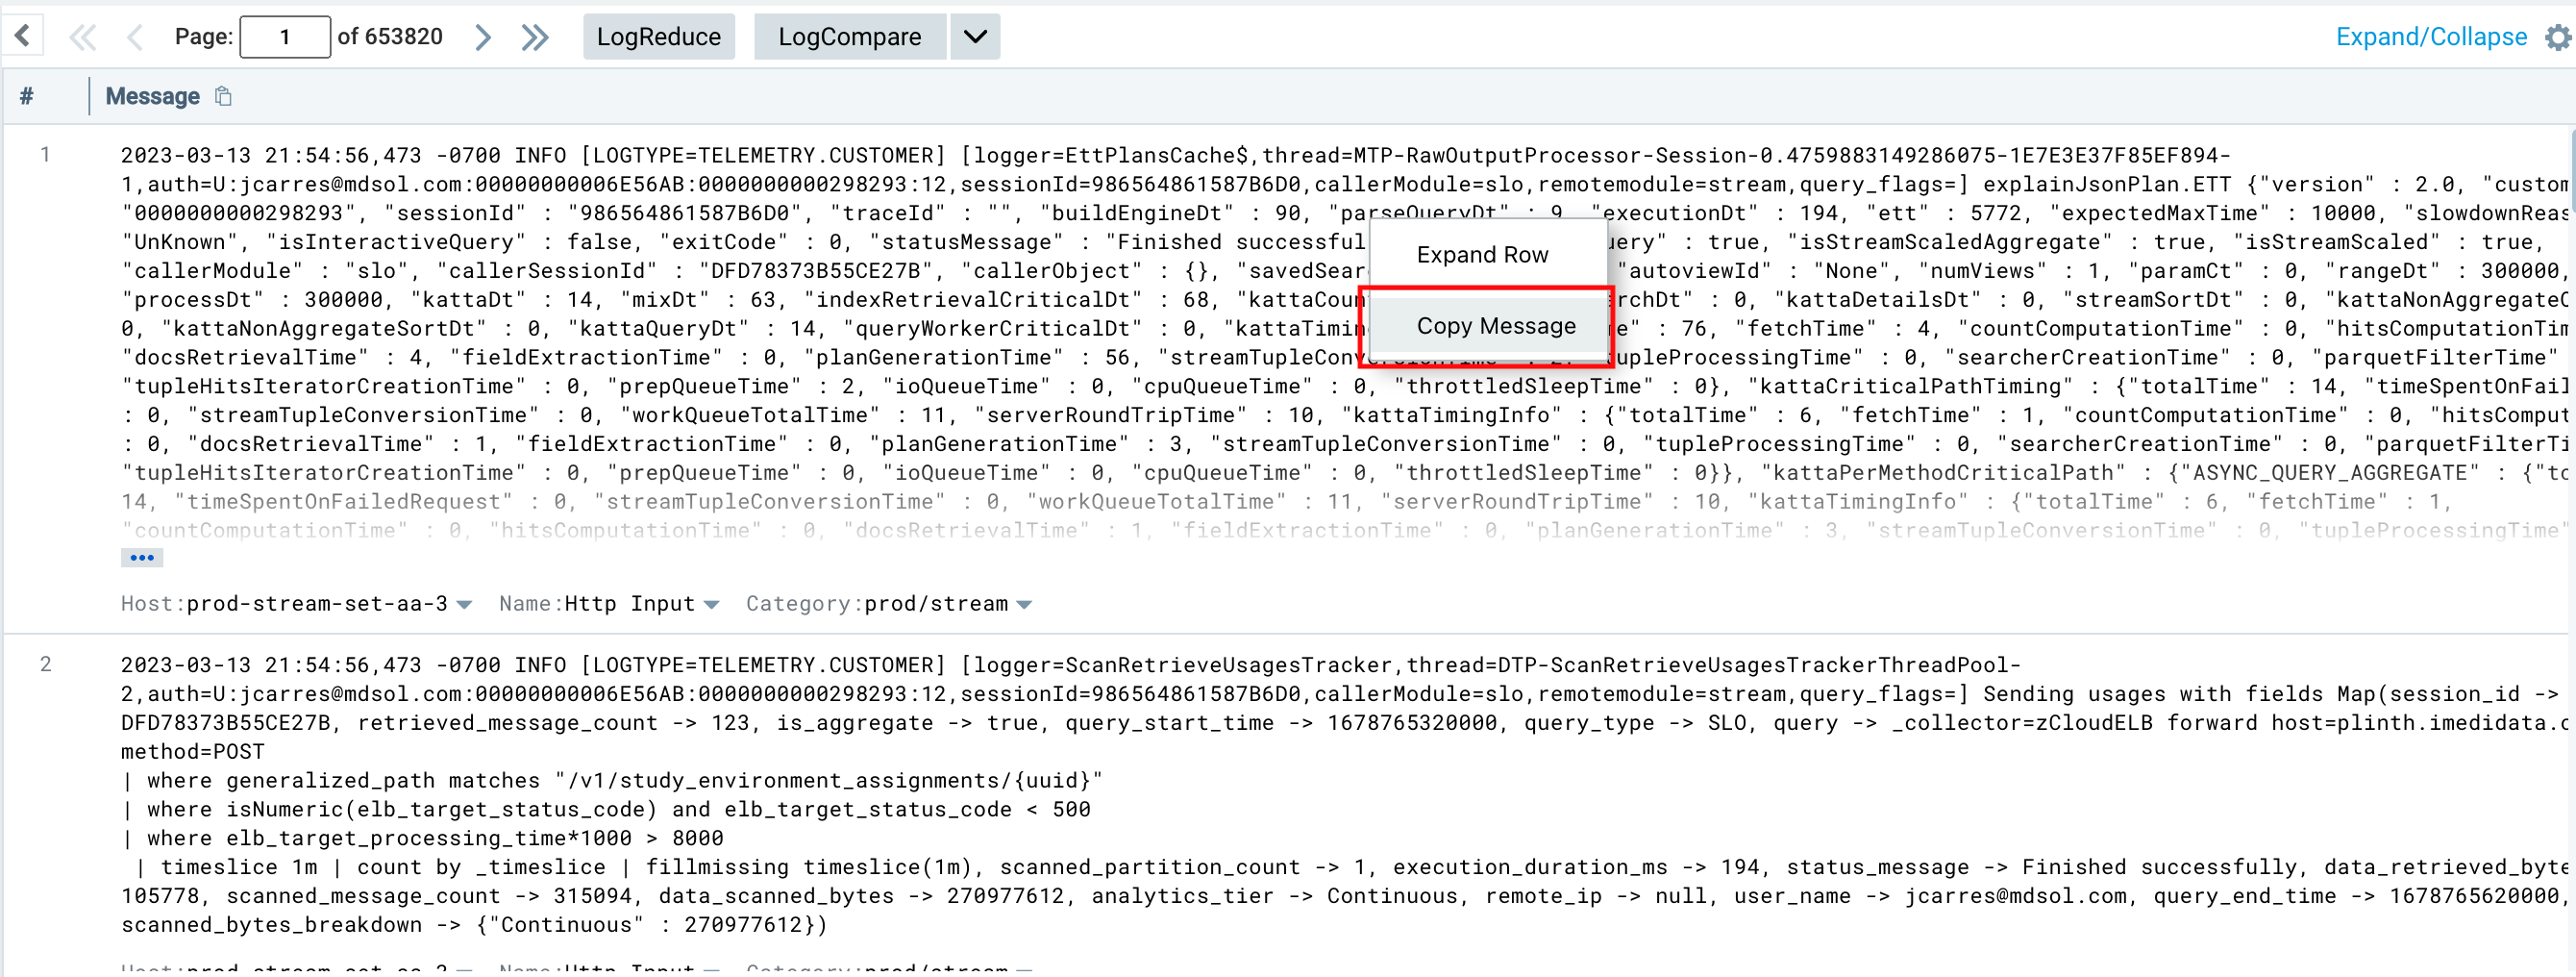
Copy message
The Messages tab allows you to right-click a table cell to copy the raw message to your clipboard.

Keyboard accessibility
Click anywhere on the table in the Messages or Aggregates tab and you can use the up and down keyboard keys to navigate your results.
Pages
If you have many pages of results, you have several options for navigation:
- Scroll down to see more results. The header is static.
- Type a page number into the page number field and hit enter.
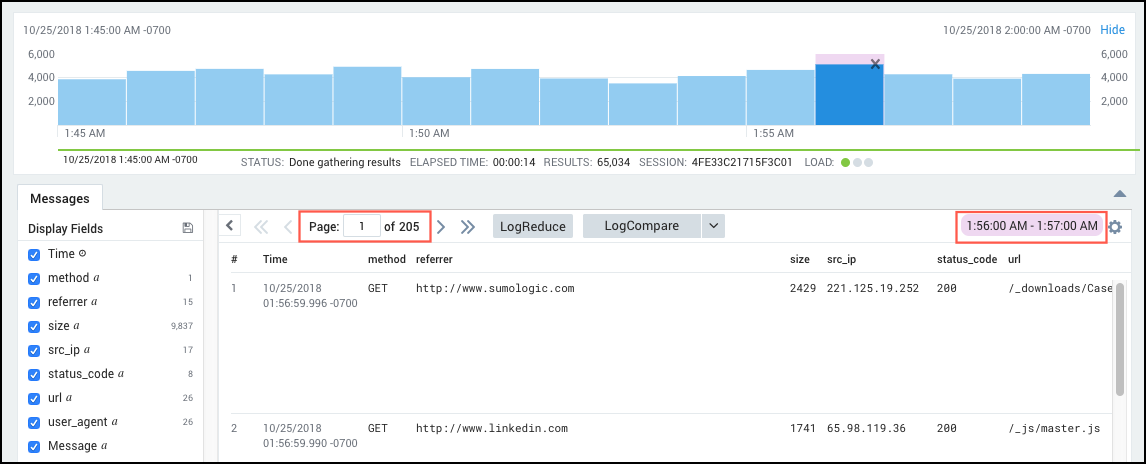
- For the Messages tab only, click into a block in the histogram to jump to the page containing the first message from that block. In the default sort order, the message is the most recent message from the block. In a reverse sort order, clicking into the histogram takes you to the page containing the oldest message from that block.

In this example, the largest number of events occurred between 1:56 and 1:57 am. Clicking into the tallest histogram block takes us to the page where logs related to the event can be viewed. This is the page that contains the most recent message from this message block. The note in pink shows the range in time that corresponds to the page you're viewing.