Root Cause Explorer

Root Cause Explorer (RCE) helps on-call staff, DevOps, and infrastructure engineers accelerate troubleshooting and root cause isolation for incidents in their apps and microservices running on AWS, public cloud hosts, and Kubernetes.
Root Cause Explorer helps you correlate unusual spikes, referred to as Events of Interest (EOIs), in AWS CloudWatch metrics, Open Telemetry trace metrics, host metrics, and Kubernetes metrics using the context associated with the incident. Such incident context includes timeline, stack (for example, AWS, Kubernetes, Application/Services), namespaces, resource identifiers, tags, metric type, metric name and more.
Given an alert, for instance, a microservice in AWS us-west-2 experiencing unusual user response times, an on-call user can use Root Cause Explorer to correlate EOIs on over 500 AWS CloudWatch metrics over 15 AWS service namespaces (such as EC2, RDS, and so on), Kubernetes metrics, and trace data, to isolate the probable cause to a specific set of EC2 instances, serving the given microservice in AWS us-west-2 that may be overloaded.
Root Cause Explorer supports the following AWS namespaces by processing CloudWatch metrics data and computing EOIs:
- AWS/EC2
- AWS/EBS
- AWS/ELB
- AWS/ApplicationELB
- AWS/NetworkELB
- AWS/Lambda
- AWS/RDS
- AWS/Dynamodb
- AWS/API Gateway
- AWS/ECS
- AWS/ElastiCache
- AWS/SQS
- AWS/SNS
- AWS X-ray (for service metrics and service topology)
- AWS Auto Scaling (for topology data)
Root Cause Explorer can also work with EC2 and EBS metrics collected by Host Metrics Sources configured on installed collectors that run on your hosts. In addition, Root Cause Explorer can leverage AWS X-Ray to correlate spikes in service metrics to AWS infrastructure metric spikes.
Root Cause Explorer also supports:
- Kubernetes metrics (from customer-managed Kubernetes, EKS, GKE, or Azure Kubernetes Engine) and associated Events of Interest. Given the ephemeral nature of container resources, Root Cause Explorer uses proprietary algorithms to aggregate Events of Interest to stable entities in a Kubernetes cluster.
- Metrics derived from Open Telemetry data from Sumo Logic Tracing for applications and services
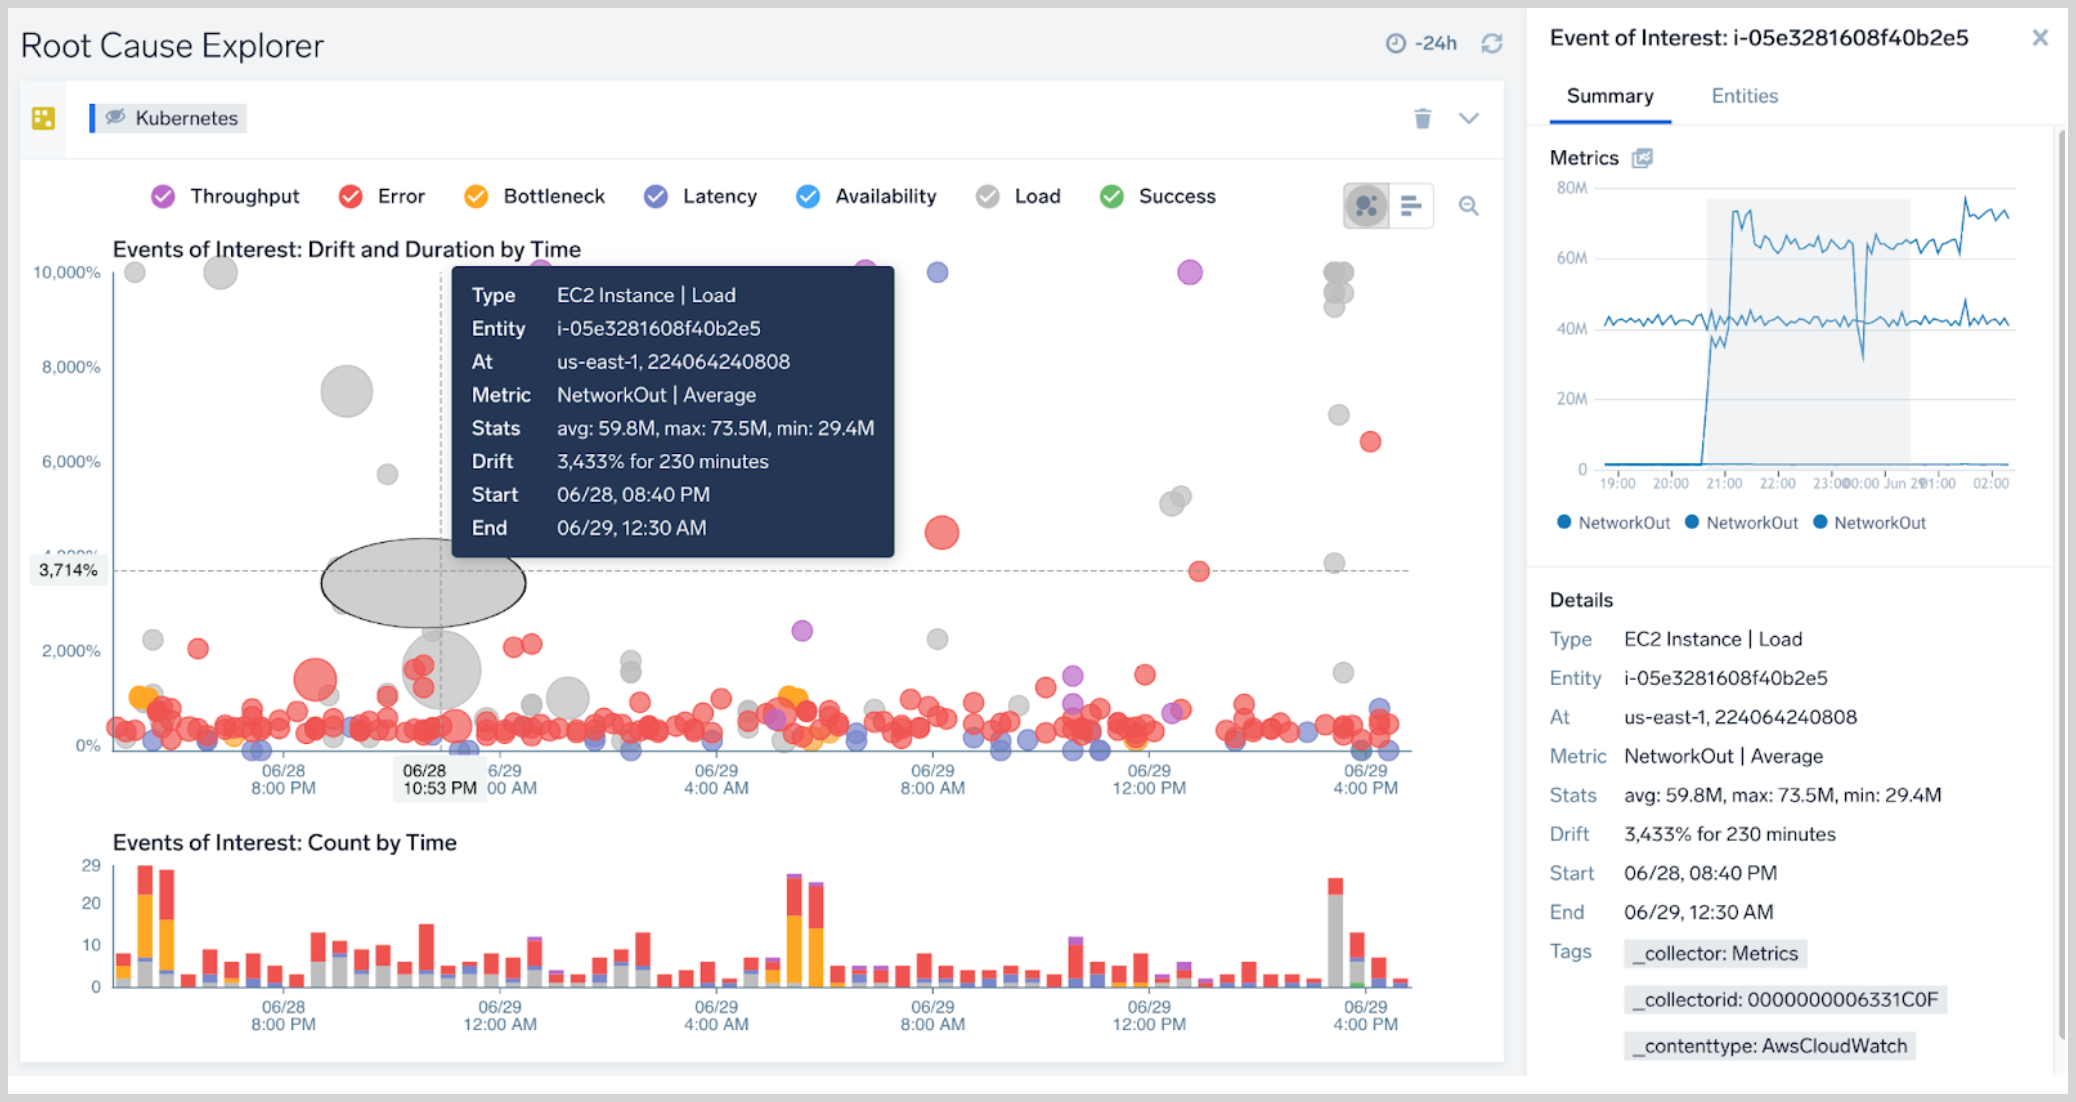
The screenshot below shows the Root Cause Explorer UI.

Availability
| Account Type | Account Level |
|---|---|
| Cloud Flex | Trial, Enterprise |
| Credits | Trial, Enterprise Operations, Enterprise Suite |
Troubleshooting concepts
Root Cause Explorer is built to enable six concepts that accelerate troubleshooting and issue resolution. These concepts should be familiar to on-call staff, DevOps, and infrastructure engineers.
Concept 1: Abnormal spikes are symptoms of an underlying problem
A spike in a metric on a resource is a sign of an underlying problem. Larger spikes compared to the expected baseline and longer-lasting spikes require closer attention than other spikes.
An abnormal spike in a metric is a statistical anomaly. Root Cause Explorer leverages spikes and adds additional context to them to compute Events of Interest (EOIs).
EOIs are constructed based on modeling the periodicity of the underlying AWS Cloudwatch, Kubernetes, or Tracing metrics on each resource in your account to create resource-specific baselines. The periodicity of a metric can be daily, weekly, or none.
EOIs also leverage proprietary noise reduction rules curated by subject matter experts. One example of a rule is how long the system watches an anomalous metric before detecting an EOI. Similarly, EOIs on metrics that have an upper bound (for example, CPU utilization cannot exceed 100%) are subject to additional curation rules.
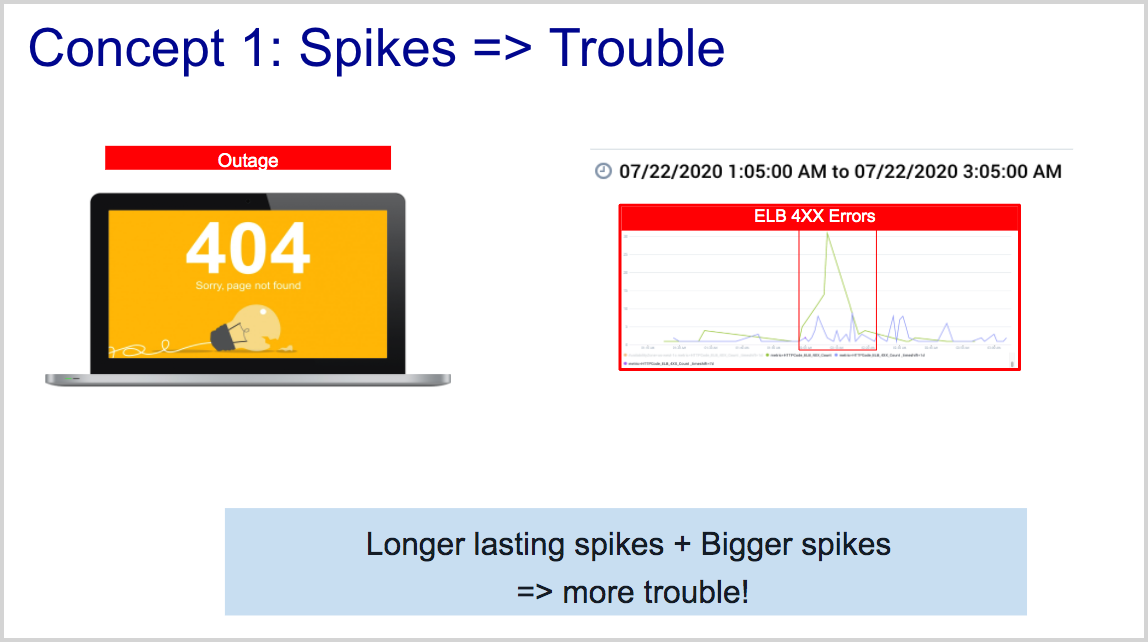
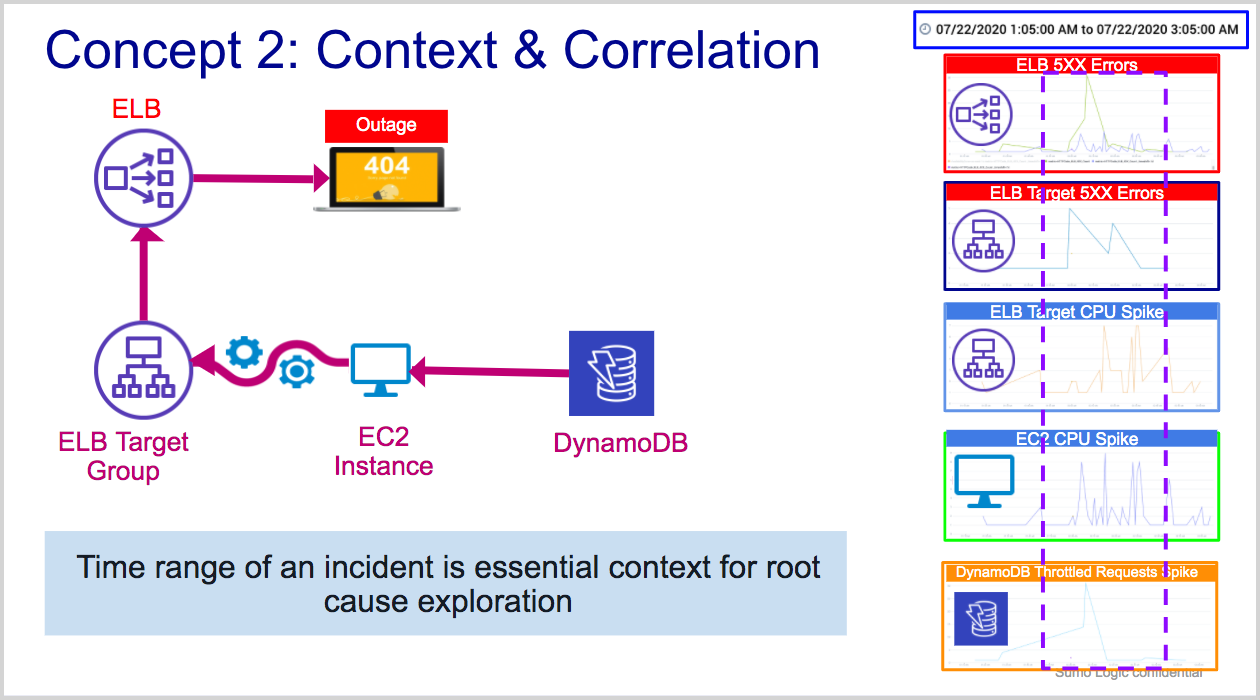
Concept 2: Context and correlation of spikes are essential strategies for root cause exploration
In a complex system, many resources may behave anomalously within the short time range of an incident. In the figure below, an application that is experiencing throttling at the DynamoDB level is likely to exhibit symptoms in the same time range at the EC2, ELB Target Group, and ELB levels. Root Cause Explorer leverages this insight to correlate EOIs based on the following dimensions:
- AWS account (account ID)
- Time range
- AWS region
- AWS Namespace
- Entity (resource identifier)note
If an AWS X-Ray source is configured, services show as entities in the entity dimension.
- AWS tags
- Golden signals: error, latency, throughput, bottleneck
- Metric name note
If an X-Ray source is configured, throughput, load, latency, and error metrics corresponding to service entities are shown in this dimension.
- Advanced filters
- Metric periodicity
- Metric stability
- Intensity—the extent of drift from baseline
- Duration of EOI
- Positive or negative drift. Negative drifts can lead to an incident. Positive drifts typically relate to metrics that have bounced back from an abnormal level, indicating recovery. However, not all positive drifts are good: for example, a down-spike in CPU utilization on an EC2 instance may be the result of a breakage in connected upstream resources.
In large deployments, thousands of AWS CloudWatch, Tracing, or Kubernetes metrics may be anomalous over the course of an outage or incident, making it impossible for an on-call user to deduce which resource(s) may be related to the root cause. With the ability to correlate EOIs based on context, Root Cause Explorer can significantly accelerate incident triage and root cause isolation.
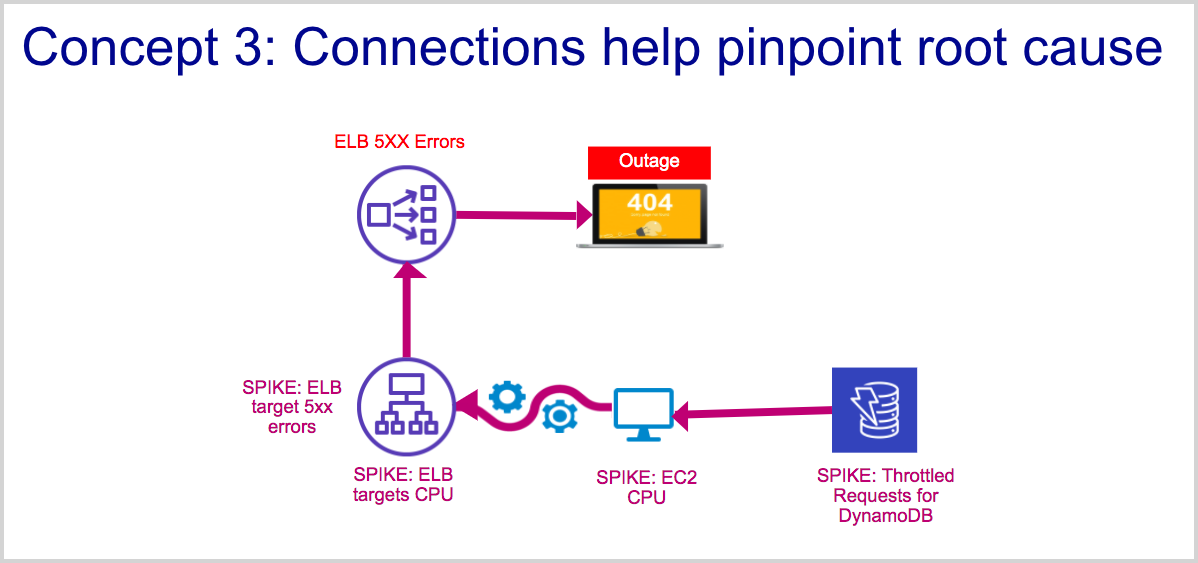
Concept 3: Connections between resources and services help pinpoint root cause
In a complex system, knowing the connections between resources and the services they serve can help a user trace problems from top-level symptoms to upstream root causes. Root Cause Explorer uses connectivity data from Sumo Logic Tracing Service Maps, AWS X-ray, AWS Inventory data and Kubernetes parent-child relationships, augmented by subject matter expertise, to construct cause-impact and topology-induced groupings of Events of Interest.
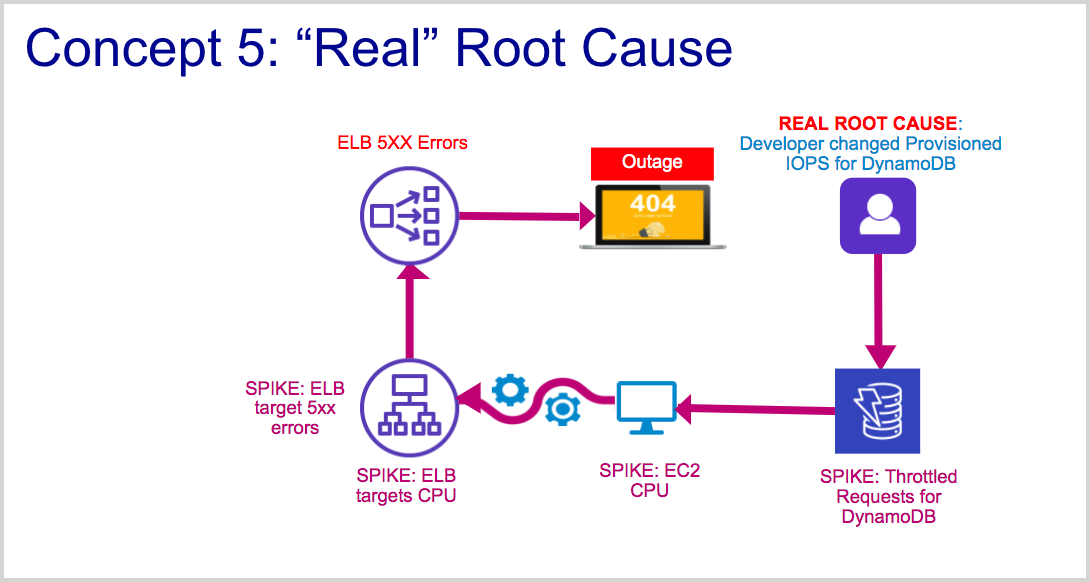
In the figure below, an application that is experiencing throttling at the DynamoDB level will likely exhibit symptoms, in the form of abnormal spikes, at connected EC2 instances, ELB Target Group, and ELB levels. Root Cause Explorer discovers the topology of your AWS infrastructure using its AWS inventory source. This topology helps Root Cause Explorer group anomalous metrics, for example:
- A single abnormal spike on a single resource, like an unusual CPU spike on an EC2 instance.
- A disparate group of abnormal spikes on a single resource, like an unusual "Network In" spike and an unusual "Network Out" traffic spike on a single EC2 instance.
- Spikes are also grouped based on statistics for a given metric on a single entity. For example, if there are anomalies for Average, Max and Sum on a certain metric (provided they occur in the same time range) on an EC2 instance, they are grouped together.
- A group of similar unusual spikes on a collection of resources that are members of an EC2 autoscaling group or ELB target group.
- Using Tracing’s Service Map and AWS X-ray, Root Cause Explorer groups Events of Interest on services observed by these systems because a spike in metrics of one service will likely result in a spike in a connected service.
For resources like API Gateway and Application Load Balancers, special notation and logic is used to drive grouping of EOIs, given that these are parent entities that enclose other layers in an AWS stack. For API Gateway, Events of Interest are computed for the following combinations:
API NameAPI NameandStageAPI Name,Stage,Resource, andAPI Method
So, an EOI grouped on an API Gateway entity might consist of EOIs on entities derived from any of the following entity hierarchies:
API Nameonly, for exampleOrderManagementAPI Name::stage, for exampleOrderManagement::ProdAPI Name::stage::resource::method, for example,OrderManagement::Prod::/::POST
In such a case, the three EOIs would be grouped together, in conjunction with the entity/topology derived grouping.
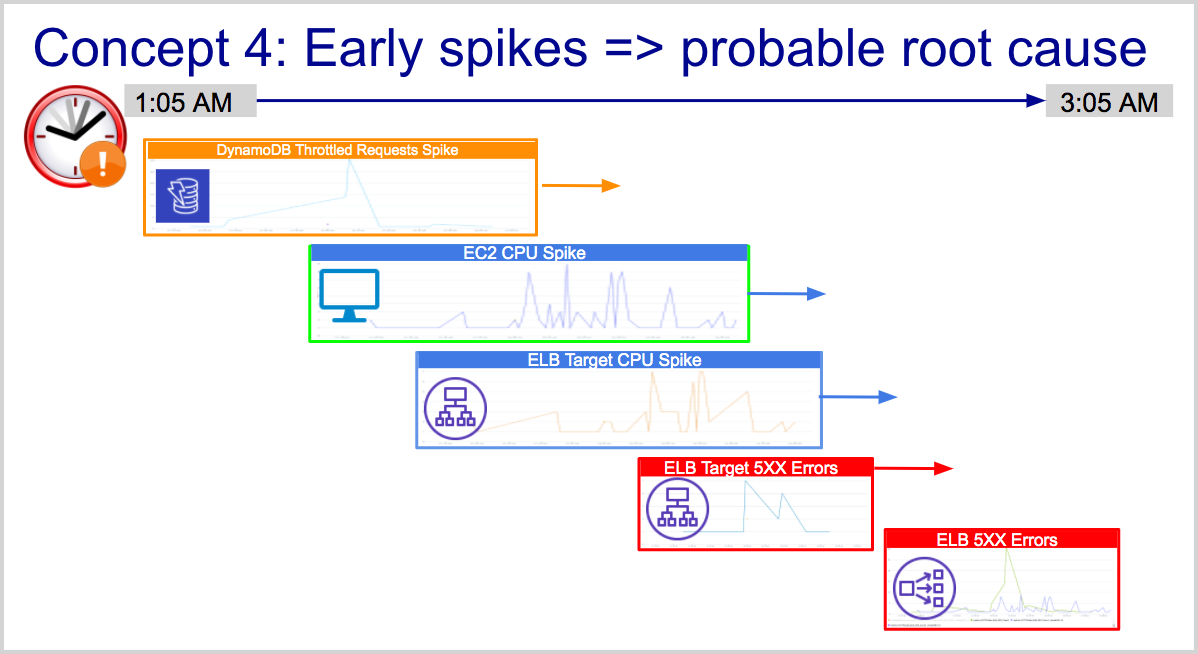
Concept 4: Earlier spikes are closer to root cause
In a complex system, resources or services that break at the early stages of an incident are closer to the probable cause than resources that experience spikes later. Root Cause Explorer exploits this insight to display spikes on a timeline.
Concept 5: Real root cause requires exploration of log and trace data
Root Cause Explorer helps triage the first level of root cause which can then drive quick recovery. However, it is also important to understand what caused the system to get into the state that caused an incident. This often requires exploring logs associated with an application or microservice. In the example in the figure below, the real root cause for DynamoDB throttling spikes is a change in the Provisioned IOPS setting on a table. Lowering this setting, while lowering AWS costs, can also lead to throttling. Such a configuration change might be evident in AWS CloudTrail logs associated with DynamoDB. Likewise, services experiencing spikes may require the user to explore Traces associated with them to diagnose and troubleshoot further.
Concept 6: Golden signals help organize root cause exploration
If you've read the Google SRE handbook, you'll be familiar with the golden signals of load, latency, bottleneck and errors. In a nutshell, errors and latency are signals that most affect users because your service is either inaccessible or slow. Bottleneck and load signals are likely early symptoms (and probable root causes) that may lead to latency and errors. Root Cause Explorer classifies each AWS CloudWatch and Kubernetes metric into one of the golden signals to help users navigate spikes using golden signals and arrive at the root cause.
Set up Root Cause Explorer
Before you begin, ensure that your organization is entitled to the appropriate features. The account types and levels that support Root Cause Explorer are listed in Availability, above. The AWS Observability Solution is a prerequisite for AWS customers. If you have Kubernetes and tracing metrics, collection should be configured. For information about collecting Kubernetes and and Tracing metrics, see Set up collection for Kubernetes and Getting Started with Transaction Tracing.
You set up Root Cause Explorer using an AWS CloudFormation template. The template installs the AWS Inventory Source and optionally, the AWS X-Ray source, in your Sumo Logic account. The AWS Inventory Source collects metadata and topology relationships for resources belonging to the namespaces listed below:
- AWS/EC2
- AWS/EBS
- AWS/ELB
- AWS/ApplicationELB
- AWS/NetworkELB
- AWS/Lambda
- AWS/RDS
- AWS/Dynamodb
- AWS/API Gateway
- AWS/ECS
- AWS/ElastiCache
- AWS/Autoscaling. Auto Scaling data is used only for topology inference. CloudWatch metrics related to Auto Scaling groups are not supported at this time.
If you don’t already have the Sumo Logic CloudWatch Source for Metrics configured, the template will install the source to collect AWS CloudWatch metrics from the account permissioned by the credential provided in the template. The CloudFormation template gives you the option to configure an AWS X-Ray source, if required.
The CloudFormation template relies on the IAM role policies listed in the Appendix below.
Root Cause Explorer features
Root Cause Explorer provides filters that you can use to narrow your EOIs. For more information, see Search Filters for AWS and hosts.
You can also adjust the timeline to match the context—for example, if you know that an incident happened in the last 60 minutes, pick that duration in the duration picker. If you are concerned about errors, pick the Error legend in the EOI panel to filter EOIs by metric type. Click an error EOI to view its details.
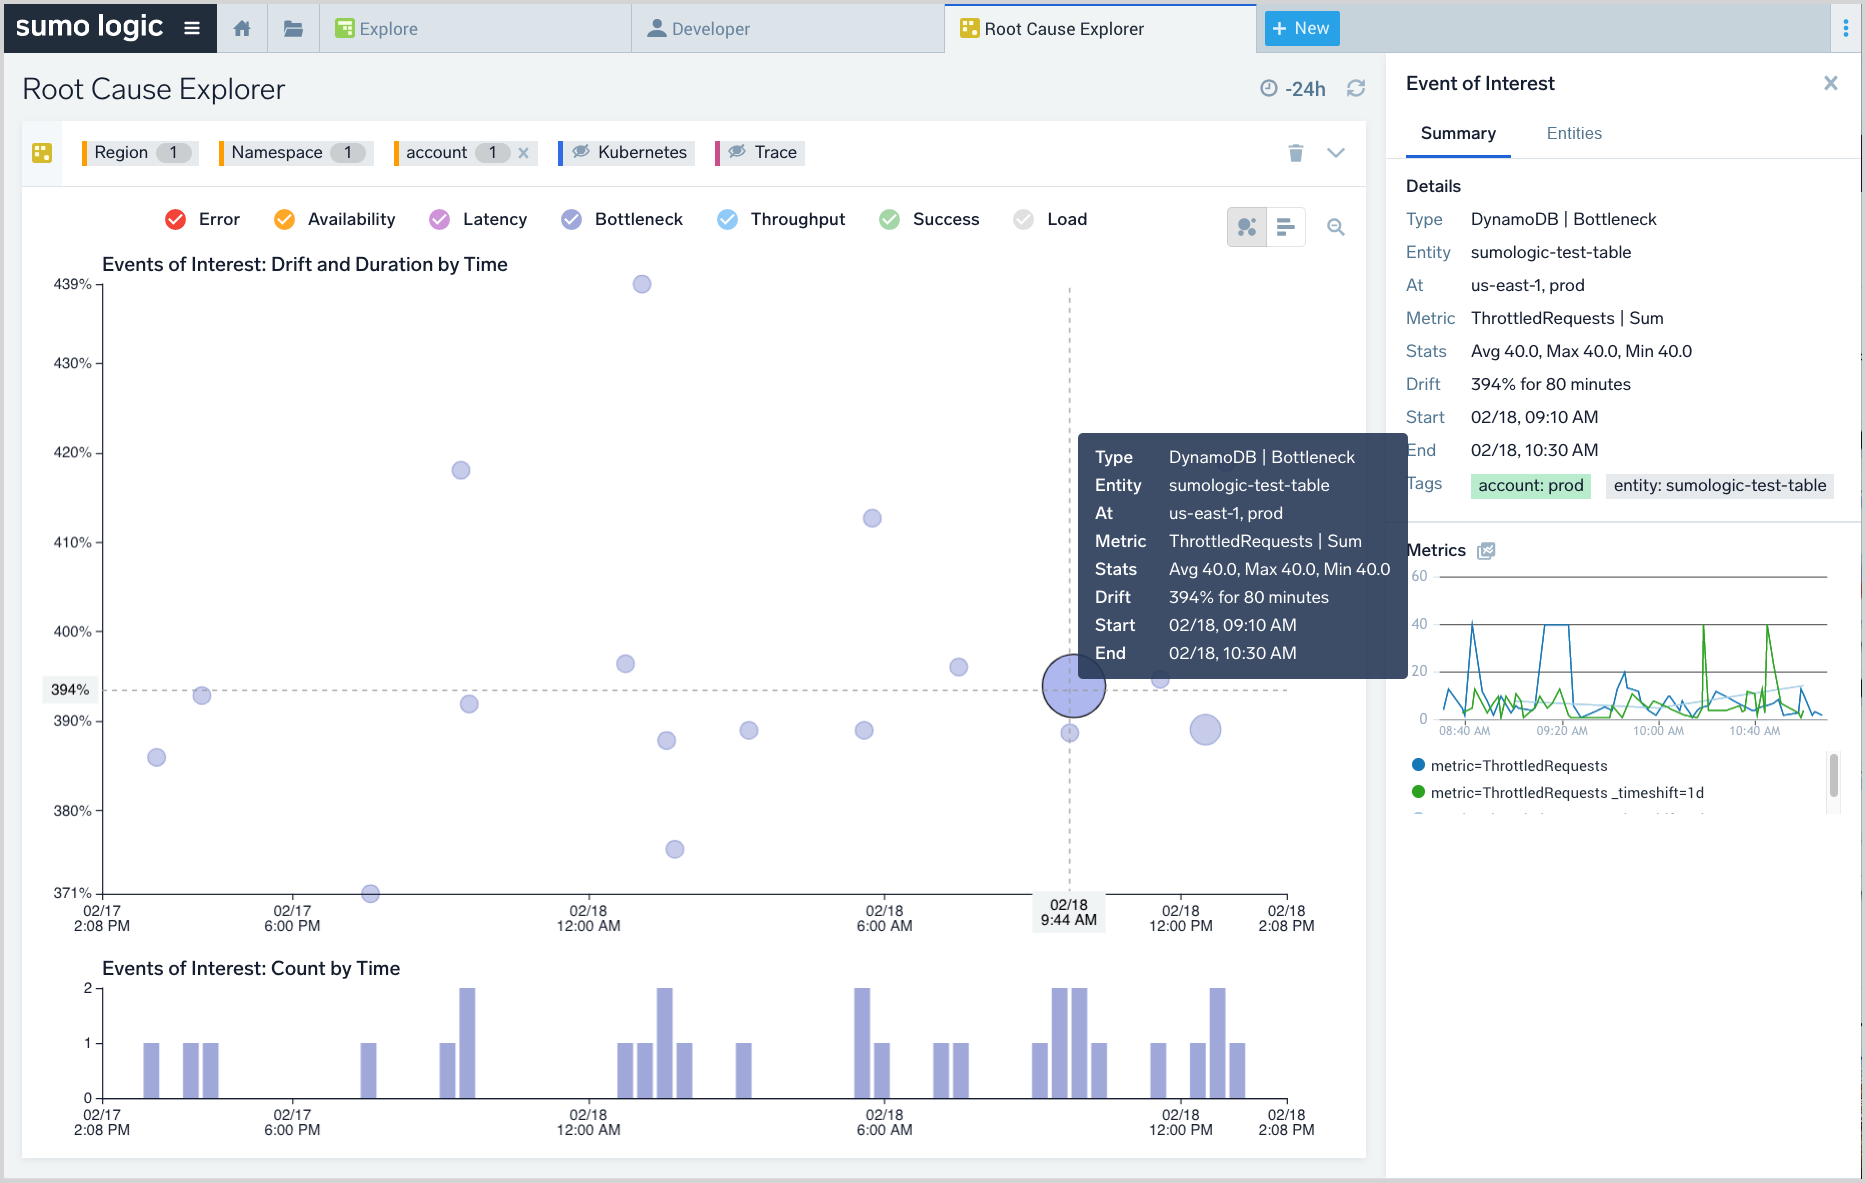
In the screenshot below, an EOI on a DynamoDB is shown. Click an EOI bubble to view its details and the details of the underlying time series in the right-hand panel. Next, click the namespace filter and view the list of impacted namespaces with their count of EOIs. Pick the top namespaces based on EOI count—these represent the prime suspects with respect to the incident.
Among the search filters in Root Cause Explorer, the Advanced Filters provide five dimensions you can use to narrow down EOIs, as shown below. Each dimension indicates the number of associated EOIs. The dimensions are:
- Impact. The EOI is positive (for example, a decrease in latency, errors, bottleneck metrics) or negative (for example, an increase in latency, errors, bottleneck metrics). Note that a positive impact is not necessarily a good thing: a CPU metric that has dropped significantly may imply problems in microservices that are upstream of the node experiencing the drop in CPU utilization.
- Intensity. The extent of drift from the expected value of a metric—classified as High, Medium or Low. Other things being equal, high intensity EOIs require more attention than others.
- Duration. How long a metric has been anomalous.
- Seasonality. Seasonality of the metric, on a 0 (low) to 100 (high) scale. This adds context and eliminates false positives in time series data that may otherwise look anomalous due to the presence of periodicity.
- Stability. Stability of the metric, based on a proprietary algorithm, on a 0 (low) to 100 (high) scale. EOIs on metrics that are usually stable are probably more indicative of a root cause than other metrics.
About the Root Cause Explorer UI
This section describes the Root Cause Explorer UI and how to interact with it.
Accessing Root Cause Explorer
You can open the Root Cause Explorer by clicking + New in the Sumo Logic UI, and by selecting Root Cause Explorer in the AWS Observability Explore UI from an Events of Interest dashboard panel as shown below.
To open the Root Cause Explorer from the Explore UI:
- Click + New and select Root Cause.
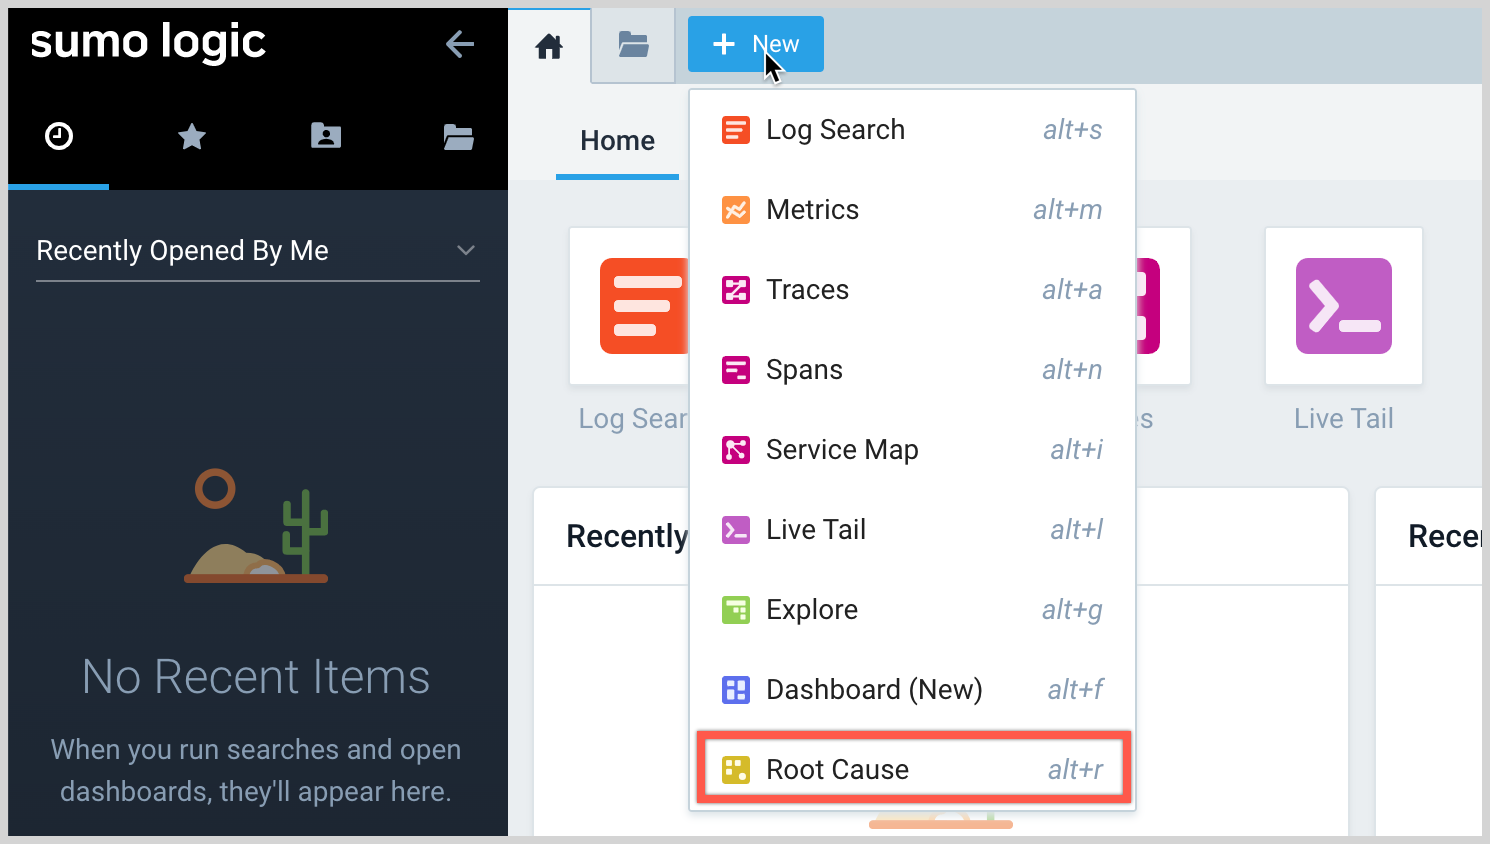
- Root Cause Explorer opens, displaying EOIs for the currently selected filters and time range.
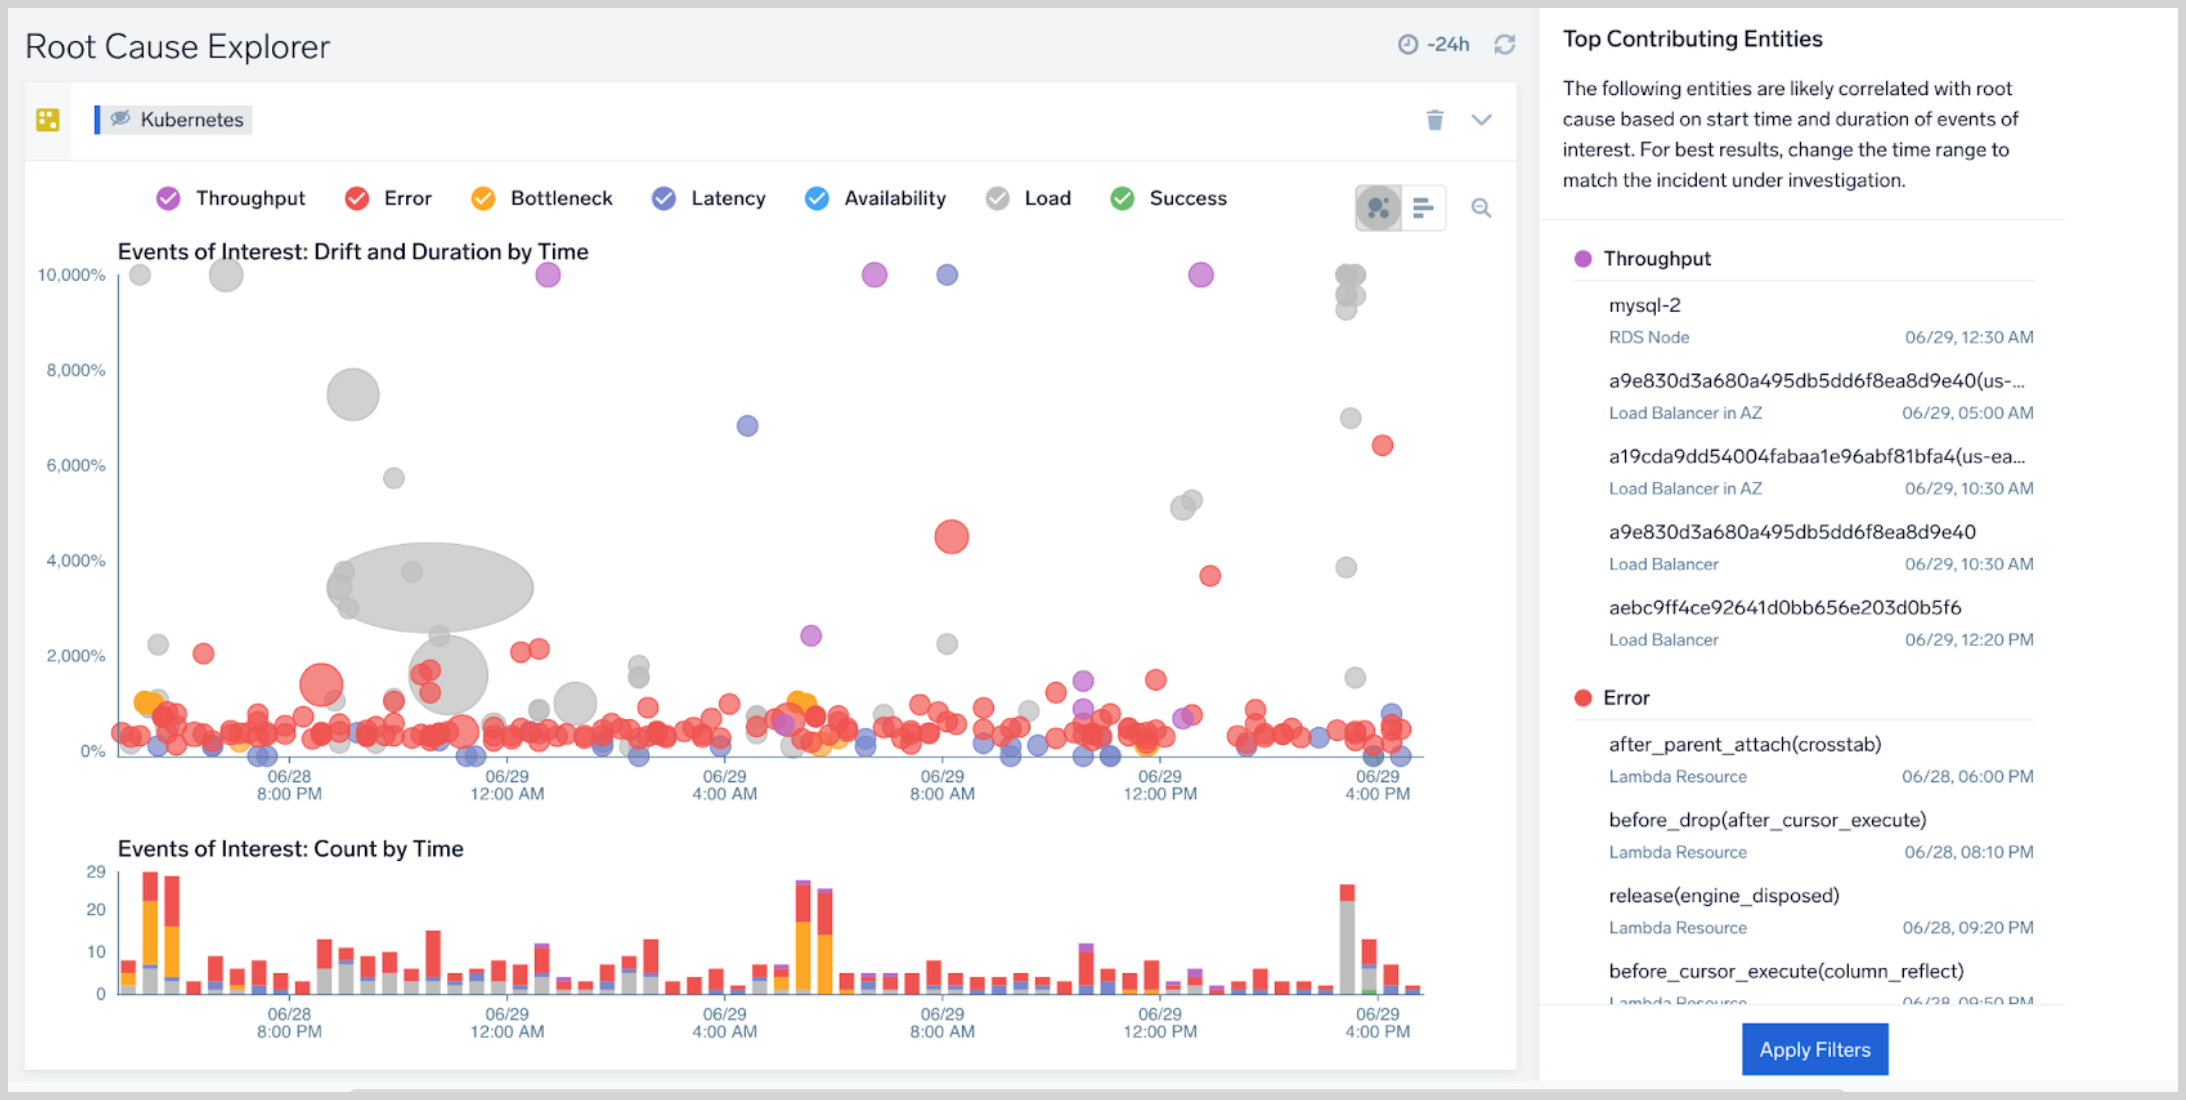
If resources are connected based on the infrastructure topology or Service Map linkages, Root Cause Explorer may group multiple EOI into a single EOI on the scatter plot. For example, CPU spikes on 10 EC2 instances in the same autoscaling group would appear as a EOI in the scatter plot. In this case, the composite EOI is considered the parent EOI, and the 10 others, its children.
Until you click on an EOI, the right pane will list the Top Contributing Entities—the entities that are likely to be related to the root cause based on timeline, duration and other factors.
Click an EOI. Note that a popup, described below in EOI stats, displays key information about the event. The right pane now contains a Summary tab and an Entities tab, described below in Summary tab and Entities tab.
Search Filters for AWS and hosts
The filters at the top of the Root Cause Explorer page allow you to filter the EOIs that appear. Correlation of Events of Interest at the application/service, Kubernetes, AWS and host layers of the stack is a key strategy for root cause analysis. Search filters allow users to analyze such correlations.

The filters with an orange border on the left side, which refer to AWS infrastructure and hosts, are automatically set, based on the currently selected resource in the Explore hierarchy. The screenshot above has filters for Region, Namespace, and Account. If the currently selected resource in Explore is deeper in the hierarchy, one or more additional resource filters, for instance Tablename, would be visible. Kubernetes and Trace filters appear to the right of the resource type filters. An eye icon with a strikethrough indicates that the associated data is currently filtered, so that it not visualized. To toggle an individual filter on and off, you can use the eye icon in a chip. You can toggle all AWS, all K8S, or all Trace on or off using the controls in the expanded filter area, shown in the screenshot in Search filters for traces and Kubernetes, below.
The numeric value to the right of a filter indicates how many Events of Interest are associated with a particular search filter. When you click on a filter, a popup lists the available resources of that resource type. A checkmark indicates that a resource is selected. You can add or remove a resource by clicking on the resource in the popup.

The values shown for each resource in the popup are EOI counts. Filter counts behave as follows:
- For account and region filters, the parent EOI count is shown.
- For namespace (EC2) and metric filters, the child plus parent EOI counts are shown
- For the entity filter, the parent EOI count is shown on the parent entity while the child EOI counts are shown on each child entity.
Search filters for traces and Kubernetes
To display additional filters, click the icon at the right end of the basic filters area.
![]()
In the expanded filter area, additional filters appear.
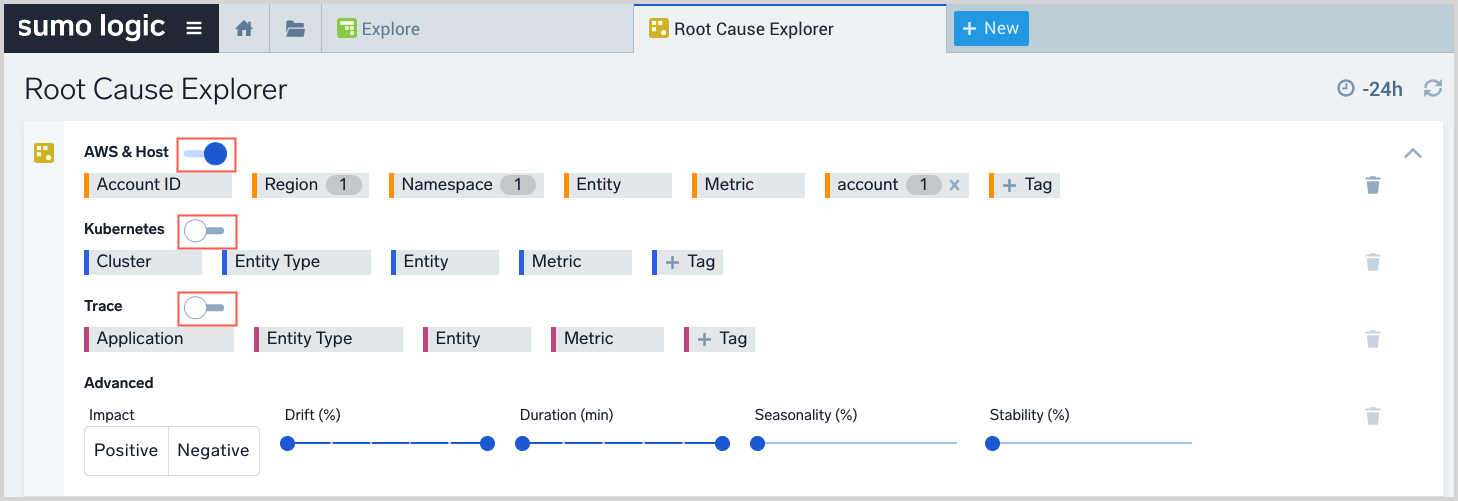
They include:
- In the top row, Entity, Metric, and Tag filters. You can use toggle all of the filters in the row on and off using the control to the right of AWS & Host.
- Kubernetes filters. You can use toggle all of the filters in the row on and off using the control to the right of Kubernetes.
- Trace filters. You can use toggle all of the filters in the row on and off using the control to the right of Trace.
- Advanced filters--These are five dimensions you can use to narrow down EOIs:
- Impact. The EOI is positive (for example, a decrease in latency, errors, bottleneck metrics) or negative (for example, an increase in latency, errors, bottleneck metrics). Note that a positive impact is not necessarily a good thing: a CPU metric that has dropped significantly may imply problems in microservices that are upstream of the node experiencing the drop in CPU utilization.
- Intensity. The extent of drift from the expected value of a metric—classified as High, Medium or Low. Other things being equal, high intensity EOIs require more attention than others.
- Duration. How long a metric has been anomalous.
- Seasonality. Seasonality of the metric, on a 0 (low) to 100 (high) scale. This adds context and eliminates false positives in time series data that may otherwise look anomalous due to the presence of periodicity.
- Stability. Stability of the metric, based on a proprietary algorithm, on a 0 (low) to 100 (high) scale. EOIs on metrics that are usually stable are probably more indicative of a root cause than other metrics.
Zoom in
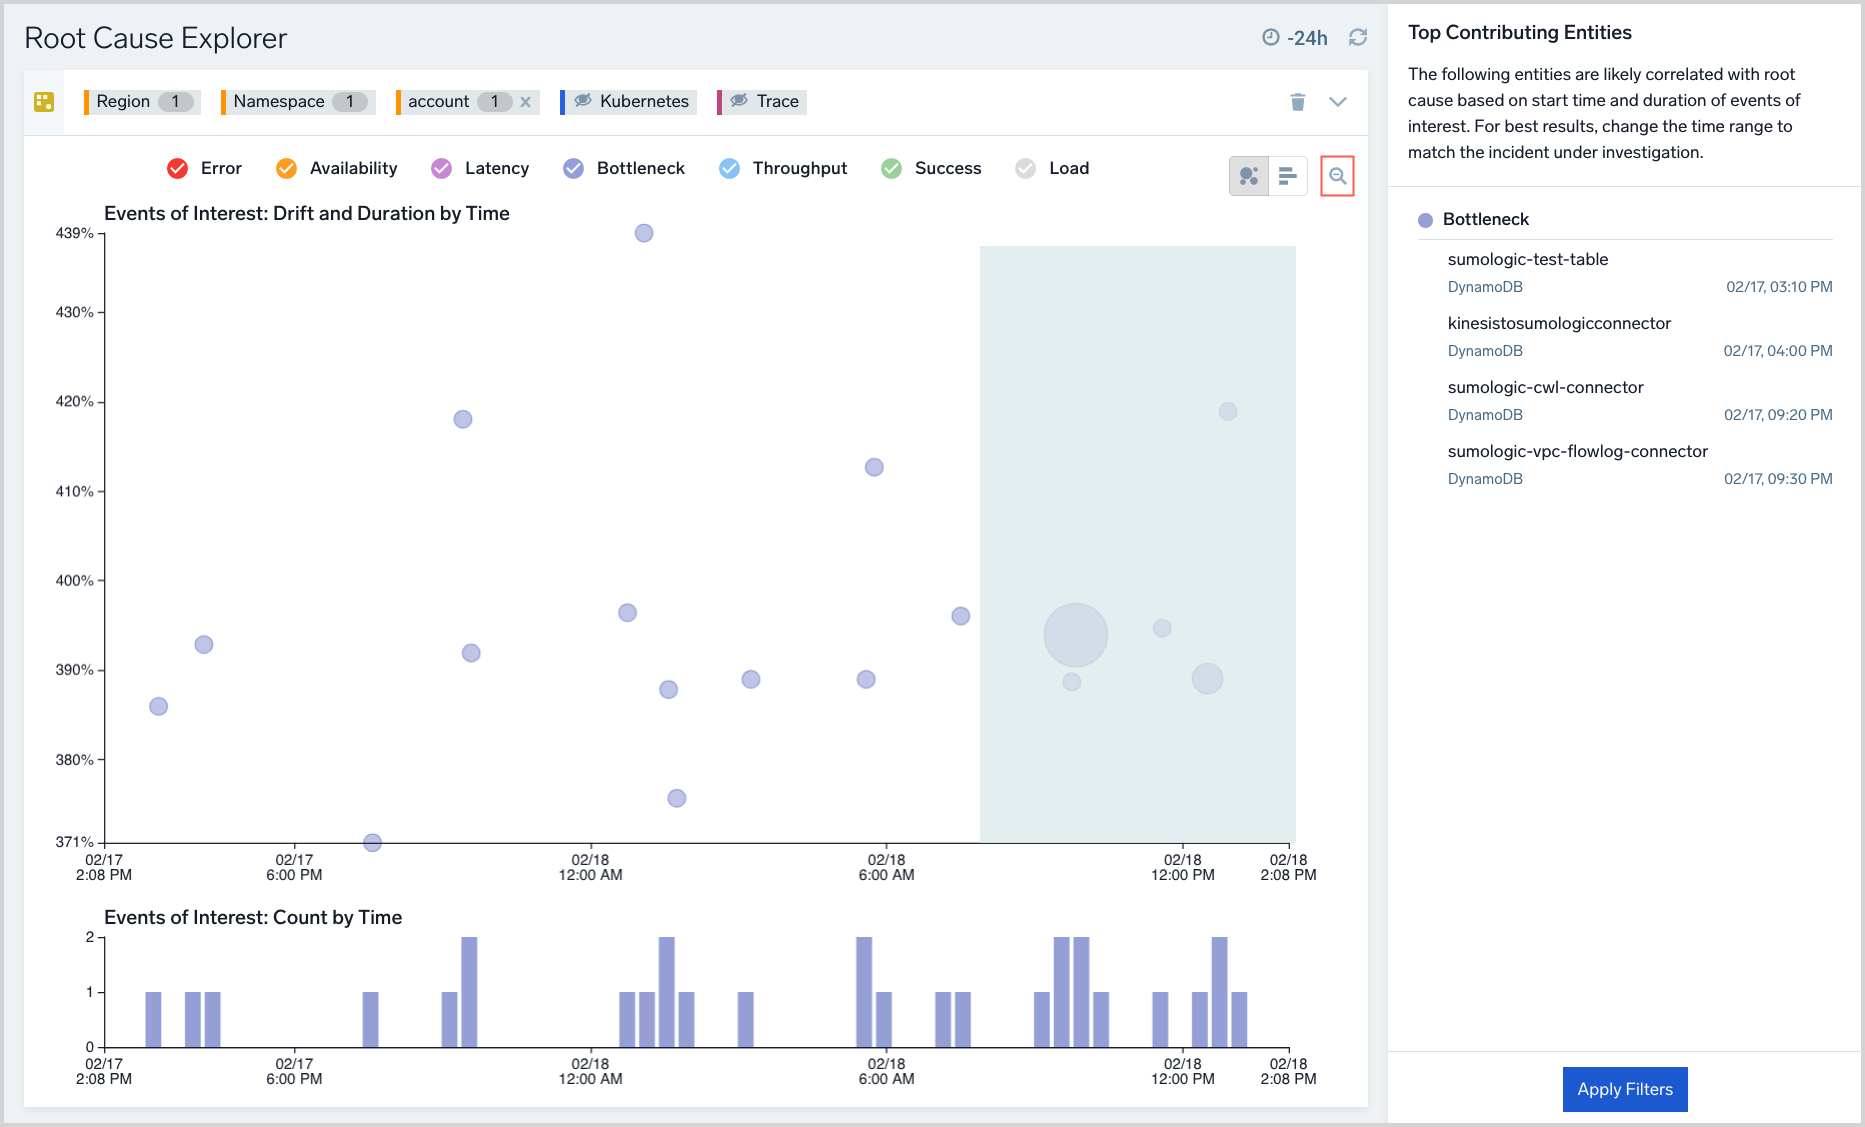
You can zoom in on a particular time range by dragging to select that range. To zoom out, click the magnifying glass icon in the upper right corner of the visualization.
EOI stats
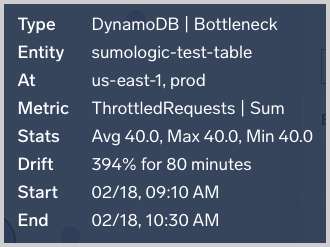
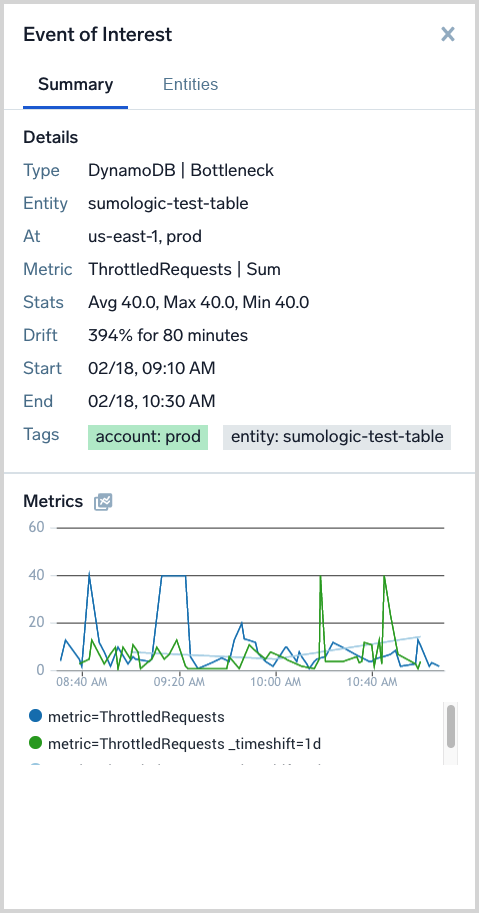
When you click an EOI, a popup appears that displays key information about the event. The Stats line shows the latest average, maximum, and minimum values of the median of the metric over each 10m segment during the Event of Interest. For example, suppose an EOI lasts 30 minutes. In each 10 minute segment, the median value of the metric underlying the EOI is 6, 8, 4. The stats maximum is 8, the minimum is 4 and the average is 6.
The suffix for a stat indicates units of measure:
mindicates a thousandth, or 10⁻³kindicates thousands, or 10³Mindicates millions, or 10⁶
Summary tab
The Summary tab is available when an EOI is selected in the Events of Interest: Drift and Duration by Time pane. It displays a variety of facts about the EOI and visualizes key metrics for it. The metrics panel shows 1d and 7d timeshifted visualizations helping you visualize drift for metrics with daily or weekly periodicity.
Entities tab
The Entities tab is available when an EOI is selected in the Events of Interest: Drift and Duration by Time page. It is essential for users to pivot to logs, metrics, traces and related dashboards for the next step in troubleshooting.
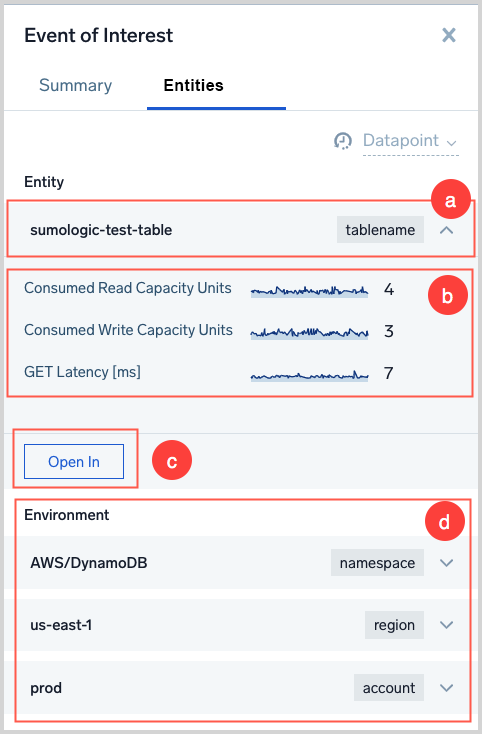
Things to note about the Entities tab:
It displays the Entity name and type
Key metrics for the Entity are visualized
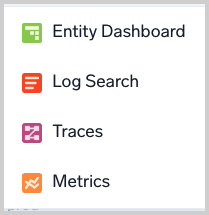
When you click Open in you can choose among options to:
- View the Entity in a related dashboard.
- Run a log search on the Entity.
- View traces that match the Entity.
- Run a metrics query on the Entity.
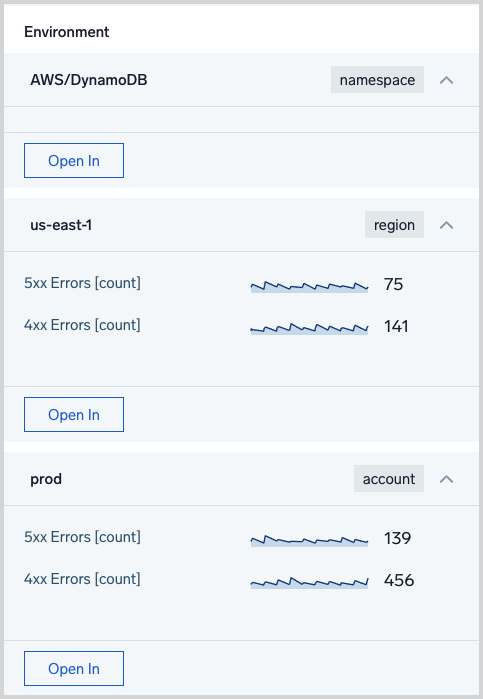
The Environment section shows resources in the Entity’s resource hierarchy. You can click the control in the row for each resource to display key metrics for the resource, and use the Open In button to display the options described above.
Four-step troubleshooting methodology with example
There are four steps to root cause exploration:
- STEP 1: Find a time range of interest based on the incident timeline.
- STEP 2: For a given AWS region, view root cause guidance, using the Top Contributing Entities panel.
- STEP 3: Toggle context filters (for example, metrics, golden signals, AWS tags, Advanced Filters) to further isolate the root cause.
- STEP 4: View time series and logs to analyze the true root cause.
In the figure below, imagine an on-call user supporting a mission-critical application on AWS. The application uses three AWS services:
- ELB (Application Load Balancer)
- EC2
- DynamoDB
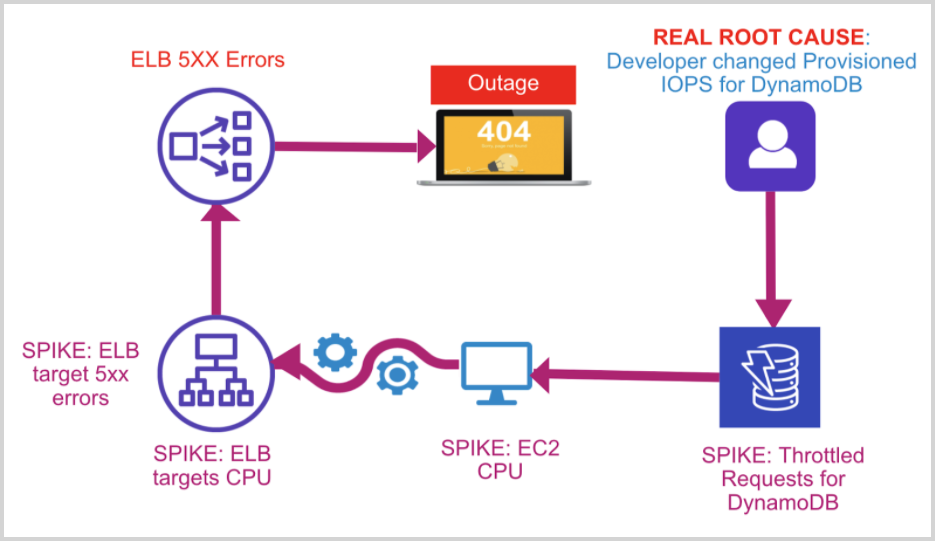
In this scenario, a developer has reconfigured DynamoDB to use lower-provisioned IOPS (Input/Output Operations Per Second). As AWS charges for DynamoDB based on provisioned Read/Write Capacity Units, cost optimization could be a motivation for the developer to make the change. As load on the application increases, this change could result in spikes in the following CloudWatch metrics:
- ELB errors: HTTP 5xx Count
- ELB errors: HTTP 4xx Count
- ELB: UnHealthyHostCount
- EC2: CPU Utilization, Network
- DynamoDB: ThrottledRequests, ReadThrottleEvents, WriteThrottleEvents
Of course, in a real situation, only the top level symptom, in this case, either the HTTP 5xx Count or HTTP 4xx Count might be apparent to the on-call user. The troubleshooting challenge is to rapidly isolate the causal chain as illustrated in the flow using Root Cause Explorer. To set the stage for root cause exploration, we assume you perform the following steps before launching Root Cause Explorer:
- View an alert indicating that "ELB 5xx (unhealthy targets) has spiked in AWS account = 1234". This could be an alert on CloudWatch metrics triggered by a Sumo Logic monitor.
- In AWS Observability, navigate to the AWS account = 1234.
In Root Cause Explorer, perform the following steps:
- Narrow the time range and region based on the alert context or the AWS Observability dashboards. Use the zoom in feature on the x-axis of either the scatter plot or the histogram.
- Review the root cause guidance under the Top Contributing Entities panel. This panel incorporates the start time of spikes, duration, and the number of spikes and golden signals to compute a list of entities that are most related to the root cause. Click Apply to filter EOIs based on this guidance. Often, this might be adequate to diagnose the first-level root cause—if so, skip to step 4. Otherwise, proceed to step 3.
- If required, toggle the metric name filter and Advanced Filters or AWS tags filter count to further analyze EOIs that coincide with the incident timeline.
- Use related Dashboards in Root Cause Explorer to go to the“AWS-DynamoDB events” Dashboard to view the dashboard for DynamoDB table = 1234.
Then, in AWS Observability (AWS DynamoDB - Events dashboard, All Table Events panel), look for the Update Table event, note that user = Joe has updated the table’s provisioned throughput. This is the root cause.
Analyzing Events of Interest Using Log Queries
Root Cause Explorer streams Events of Interest data as log messages into the Continuous Intelligence Platform. This allows you to correlate problems that appear in Events of Interest data with signals evident from your organization-specific application or infrastructure logs or metrics data. Beside ad hoc searches, you can build dashboards that provide these correlations.
The availability of Events of Interest (EOI) data as log messages allows you to:
- Correlate EOIs detected on metrics with custom log or metrics data.
- Use Behavior Insights operators like logReduce and logExplain on EOIs
- Create monitors on EOI data.
- Visualize EOI data in dashboards.
EOI logs schema
The logs created from EOIs reside in a view called sumologic_signals_anomalies.
The attributes in the view are defined in the table below.
| Attribute | Description |
|---|---|
anomalyValues | Statistics about the time series in the EOI window - min, max, avg. |
autoCorrelation | A measure of the periodicity of the underlying time series. |
domain | Identifies the source of the time series data:
|
drift | The percentage deviation of the time series from the expected value. |
endTime | The end time of the EOI, in epoch milliseconds. |
eventType | The golden signal class for the EOI: Latency, Load, Bottleneck, Error, Throughput, Success, or Availability. For more information about golden signals, see the Google SRE handbook. |
id | The identifier of the EOI. Note that multiple EOIs might have the same id, but different updateTime fields. In this case, the EOI with the highest updateTime value should be chosen. |
impactPositive | Whether the EOI represents a positive impact on the overall system. |
isCause | Whether the EOI is causally related to another EOI. |
metric | Time series name. |
parentId | For grouped Events of Interest, this is the ID of the parent EOI. |
size | The number of EOIs grouped with this Event of Interest. |
stability | Stability of the underlying time series. |
startTime | Start time of the EOI, in epoch milliseconds. |
tags | All metadata and dimensions associated with the underlying time series. |
updateTime | Timestamp at which the EOI was updated. |
Sample queries
This section contains examples of queries against EOI data.
Explore EOIs and view fields breakdown
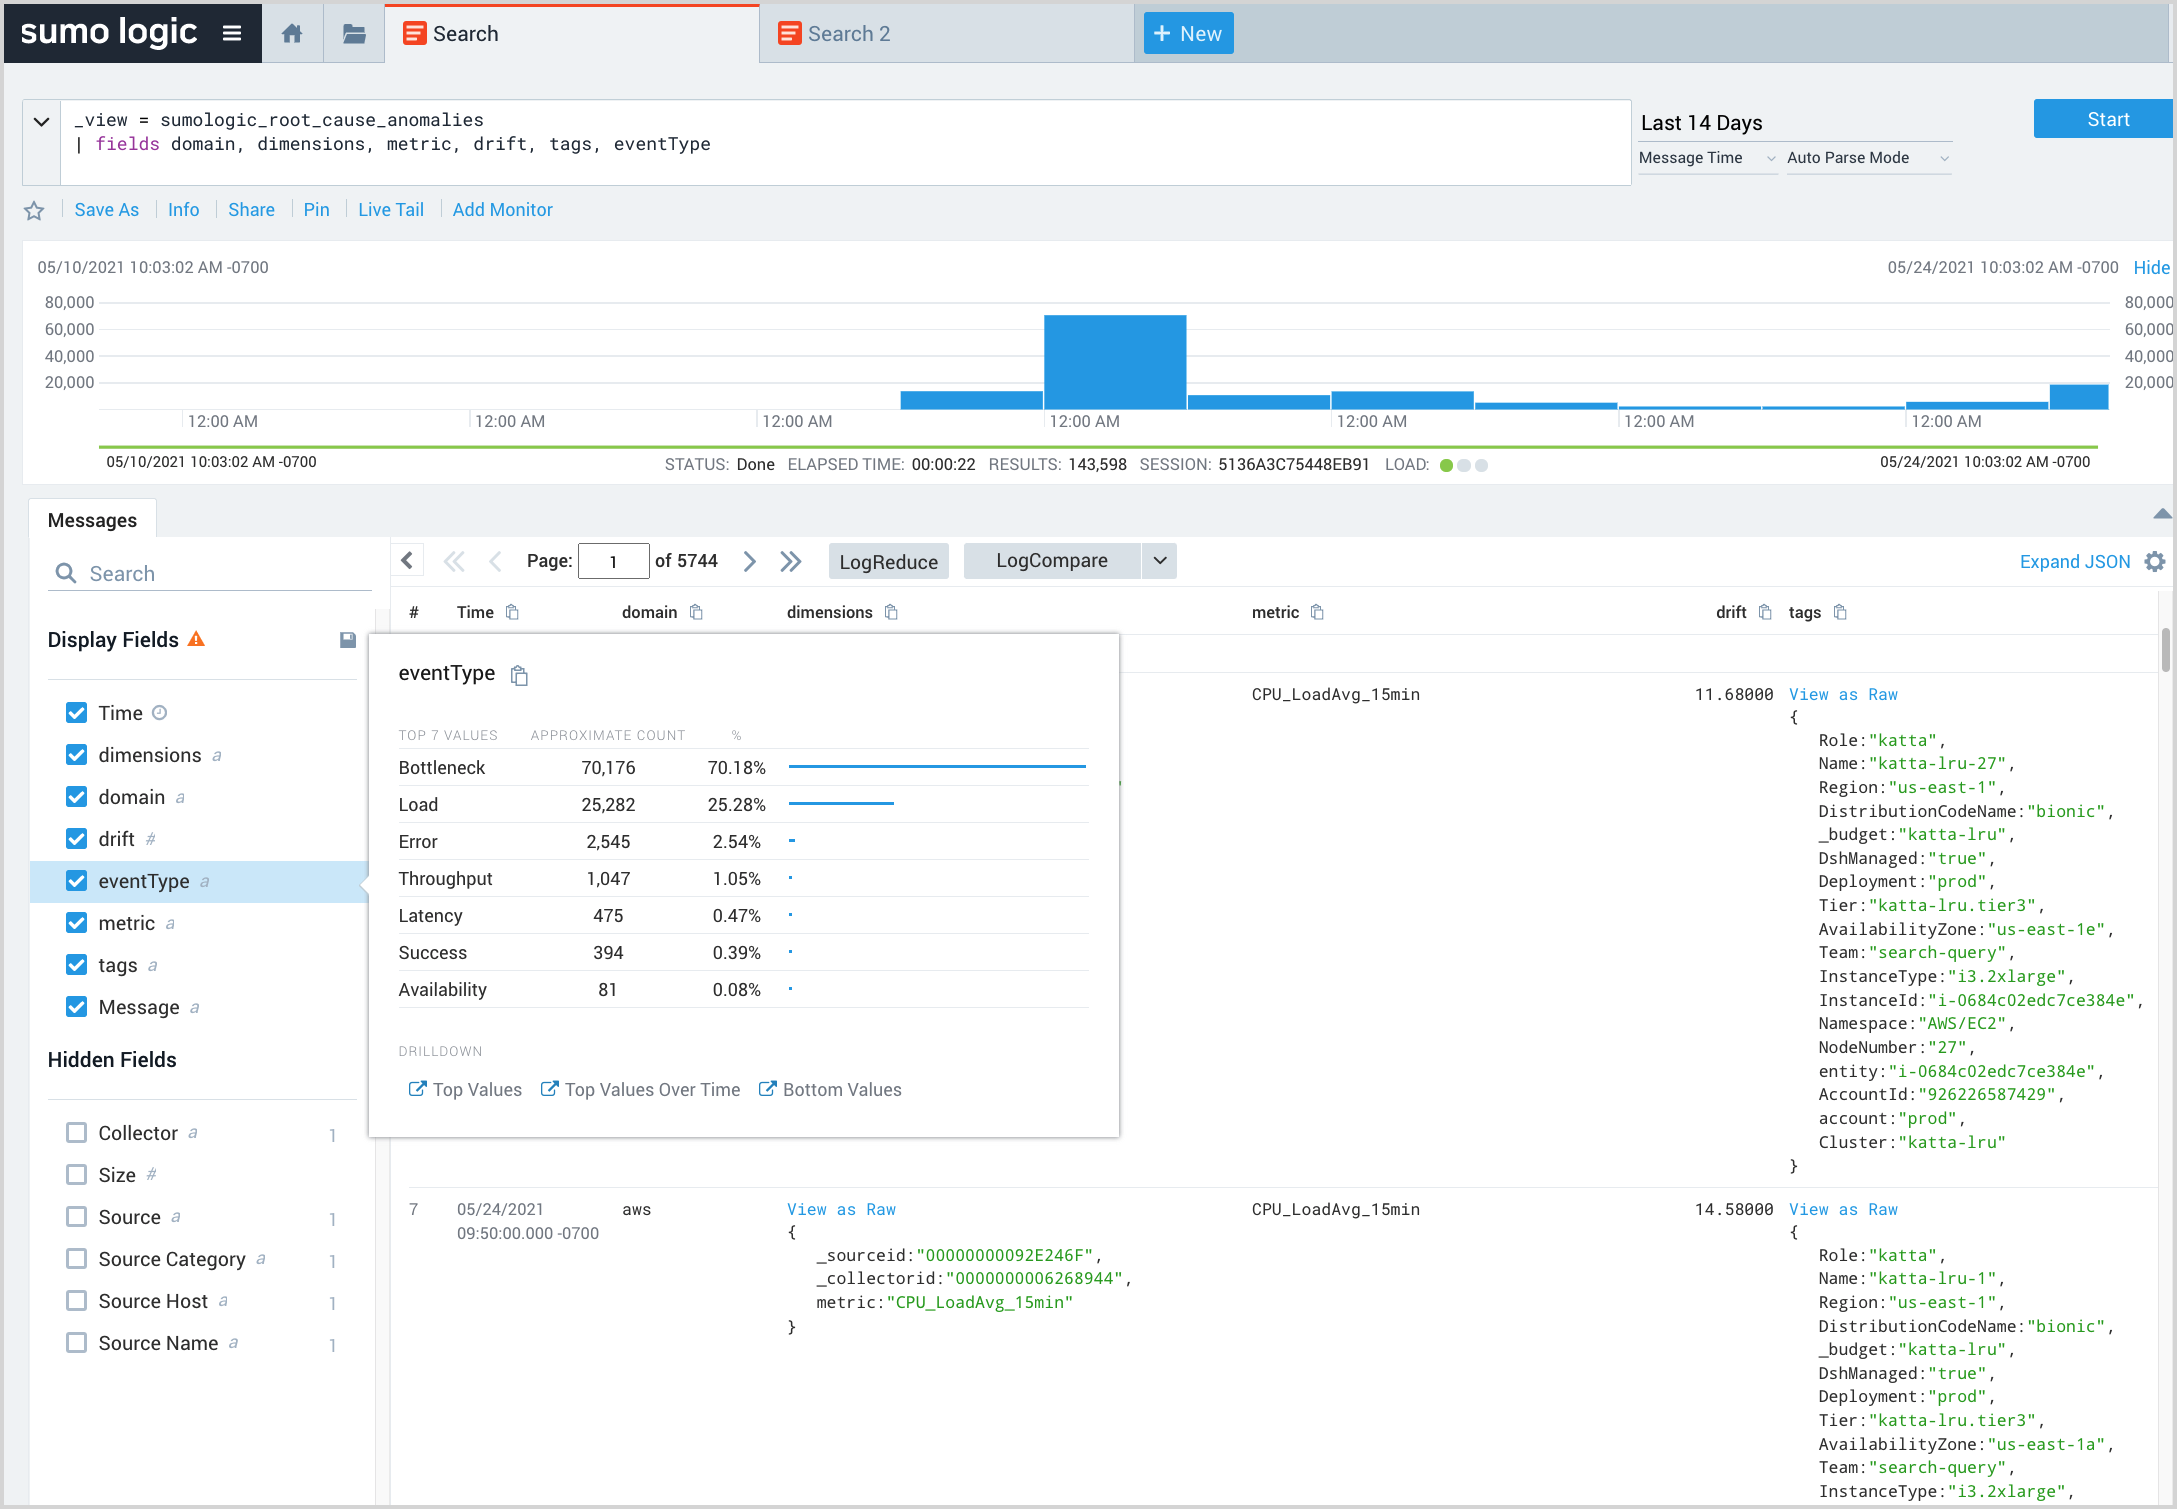
The query below returns all EOIs within the selected time range and displays selected fields of interest. In the Display Fields area, you can click a field to see a breakdown of values. This enables a snapshot of EOIs your systems might be experiencing.
_view = sumologic_signals_anomalies
| fields domain, metric, drift, tags, eventType
Filter EOIs
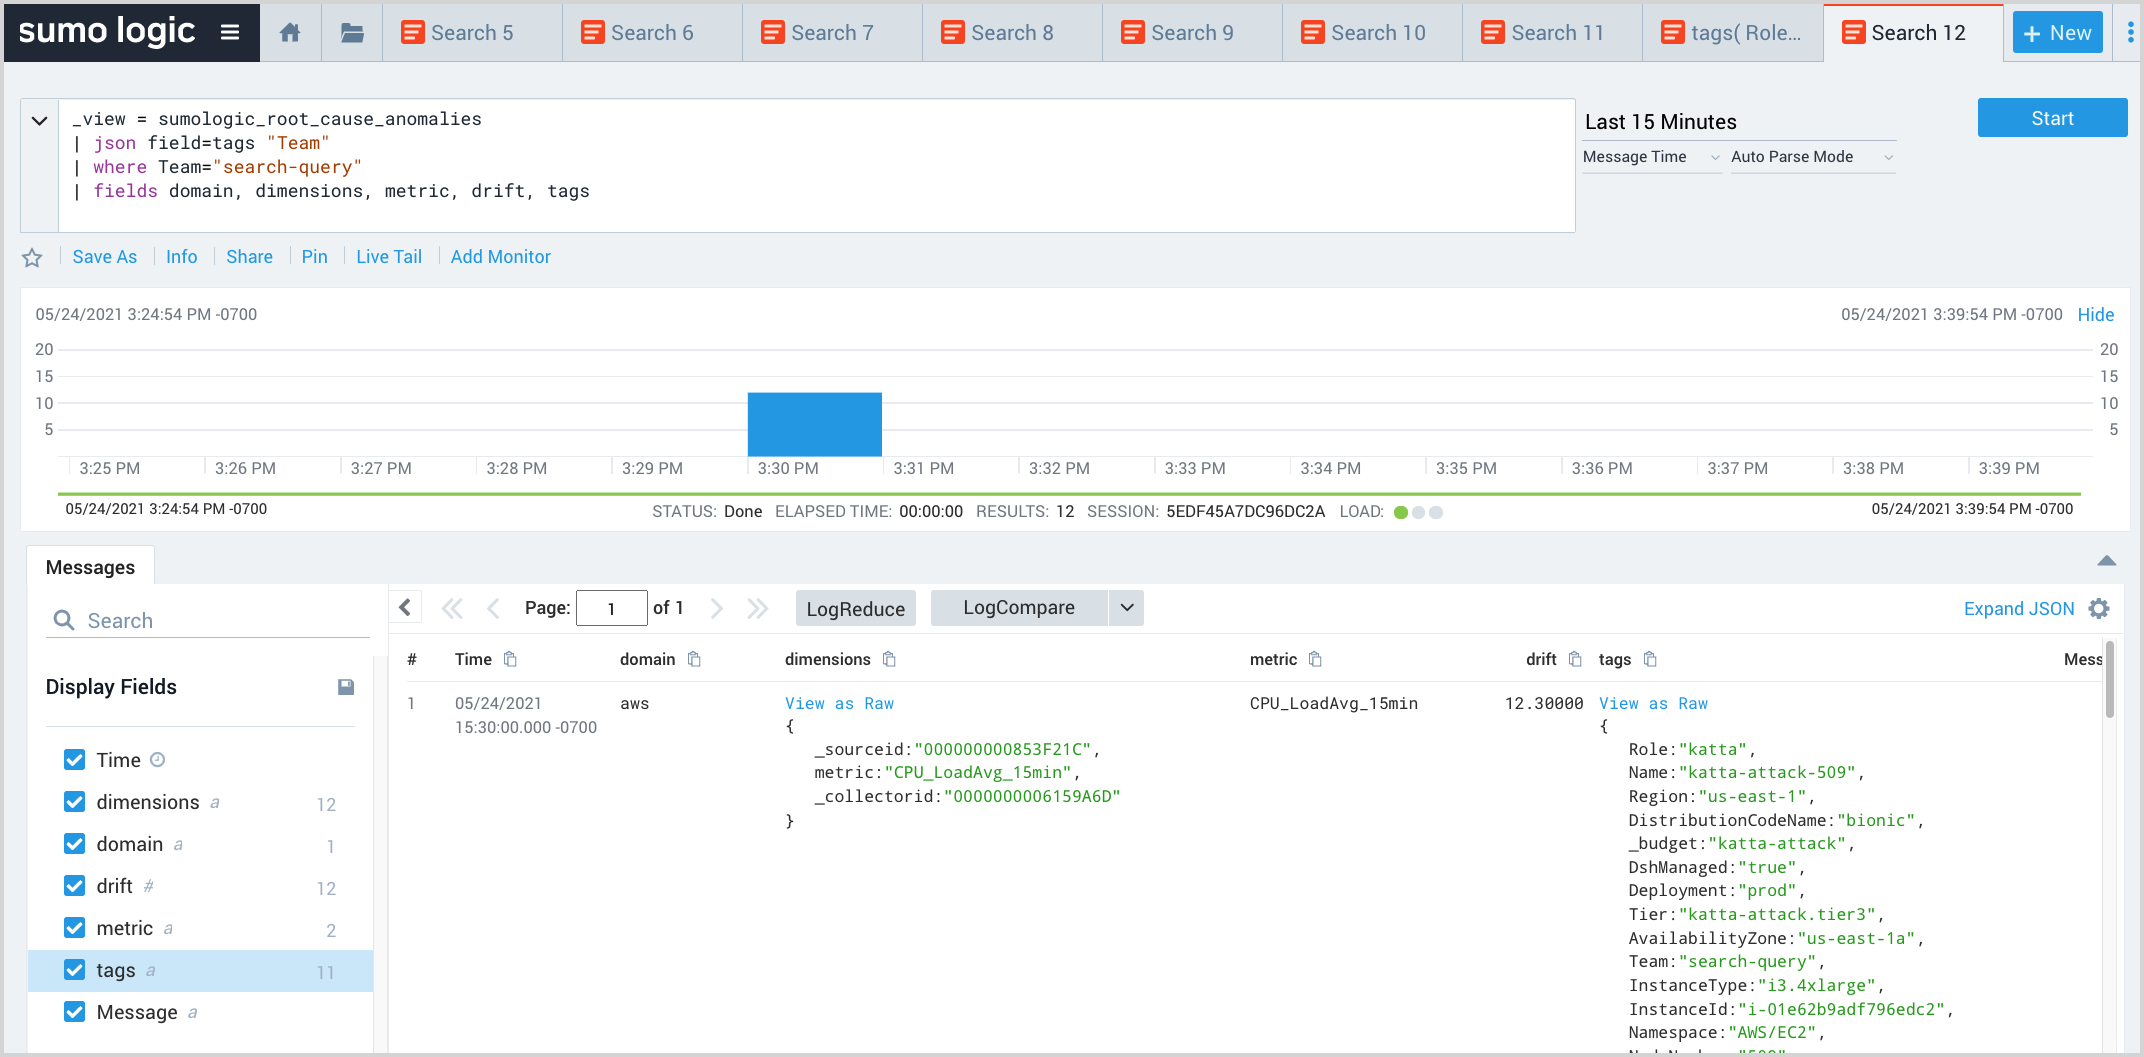
This query extracts the Team field from the tags field of the log message, and uses the where operator to filter EOIs in which Team is “search-query”. This helps filter EOIs by facets of interest.
_view = sumologic_signals_anomalies
| json field=tags "Team"
| where Team="search-query"
| fields domain, metric, drift, tags
Count EOIs by golden signals
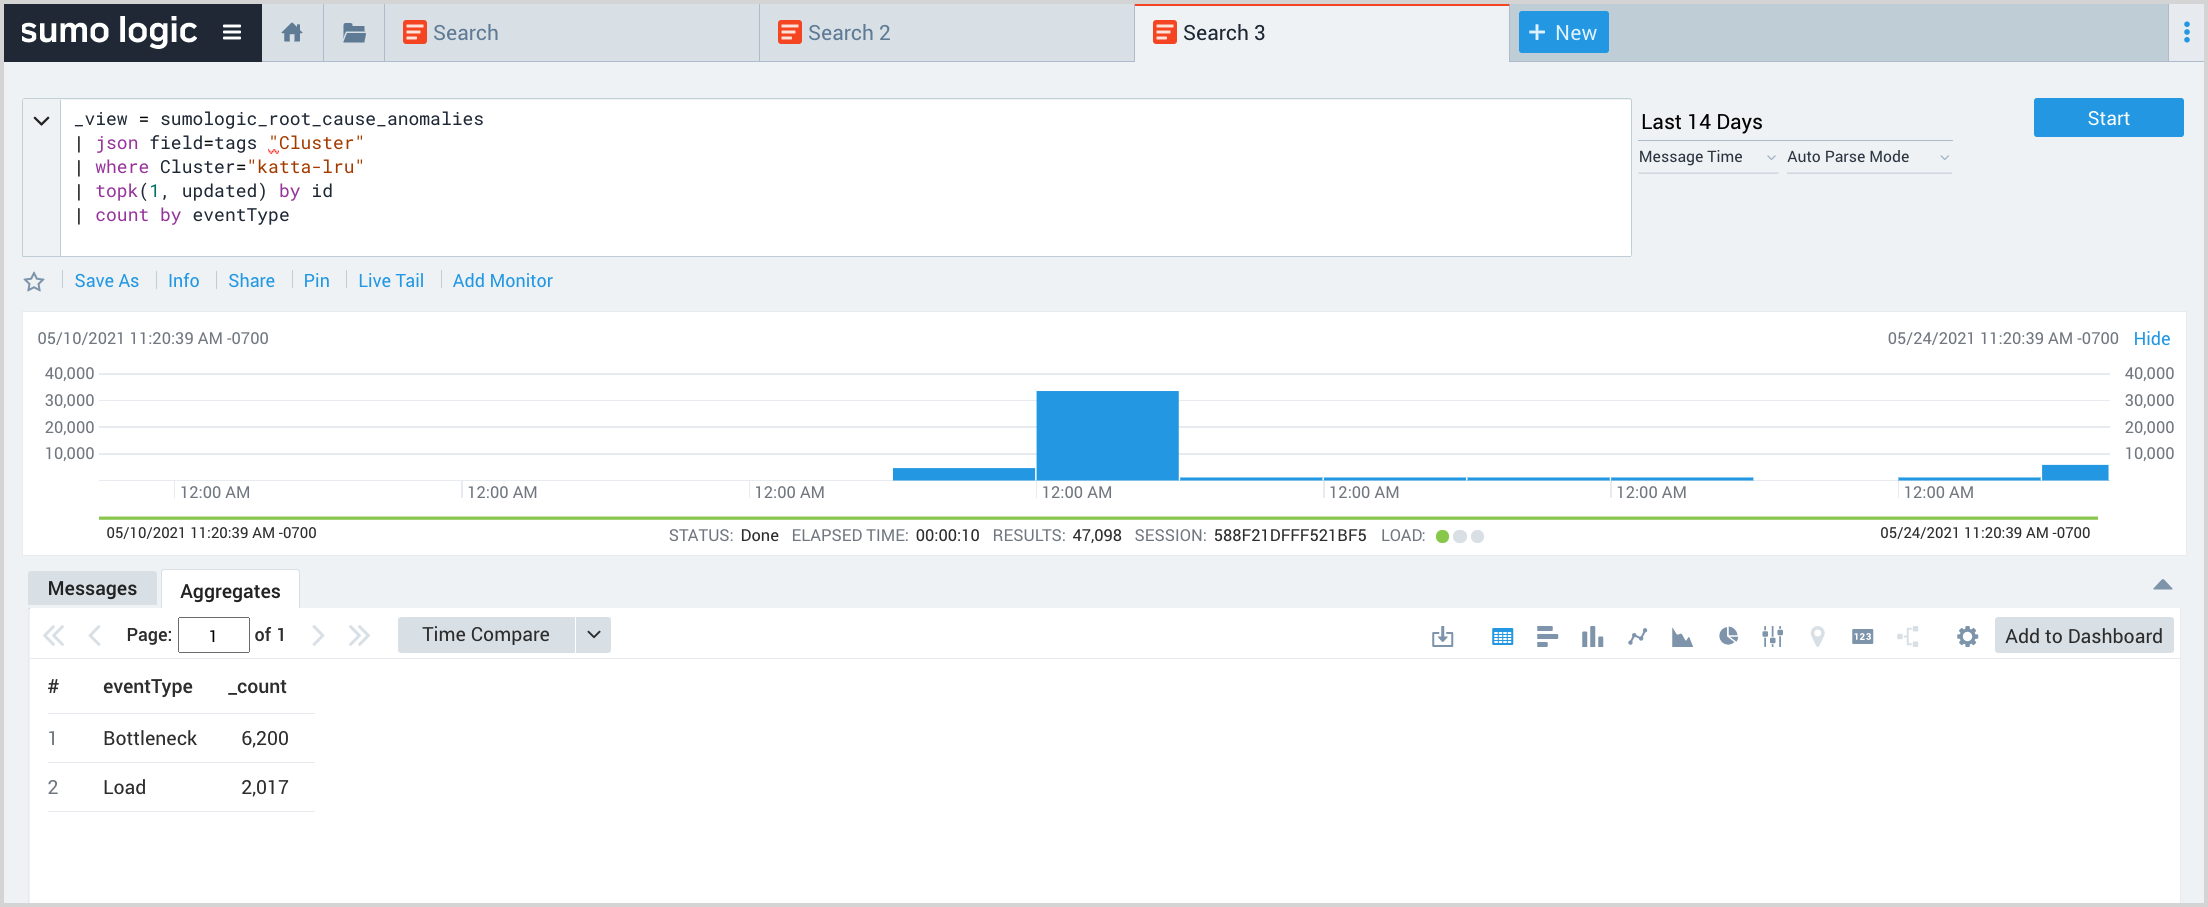
This query returns a count of EIOs by golden signal.
_view = sumologic_signals_anomalies
| json field=tags "Cluster"
| where Cluster="katta-lru"
| topk(1, updateTime) by id
| count by eventType
See affected metrics
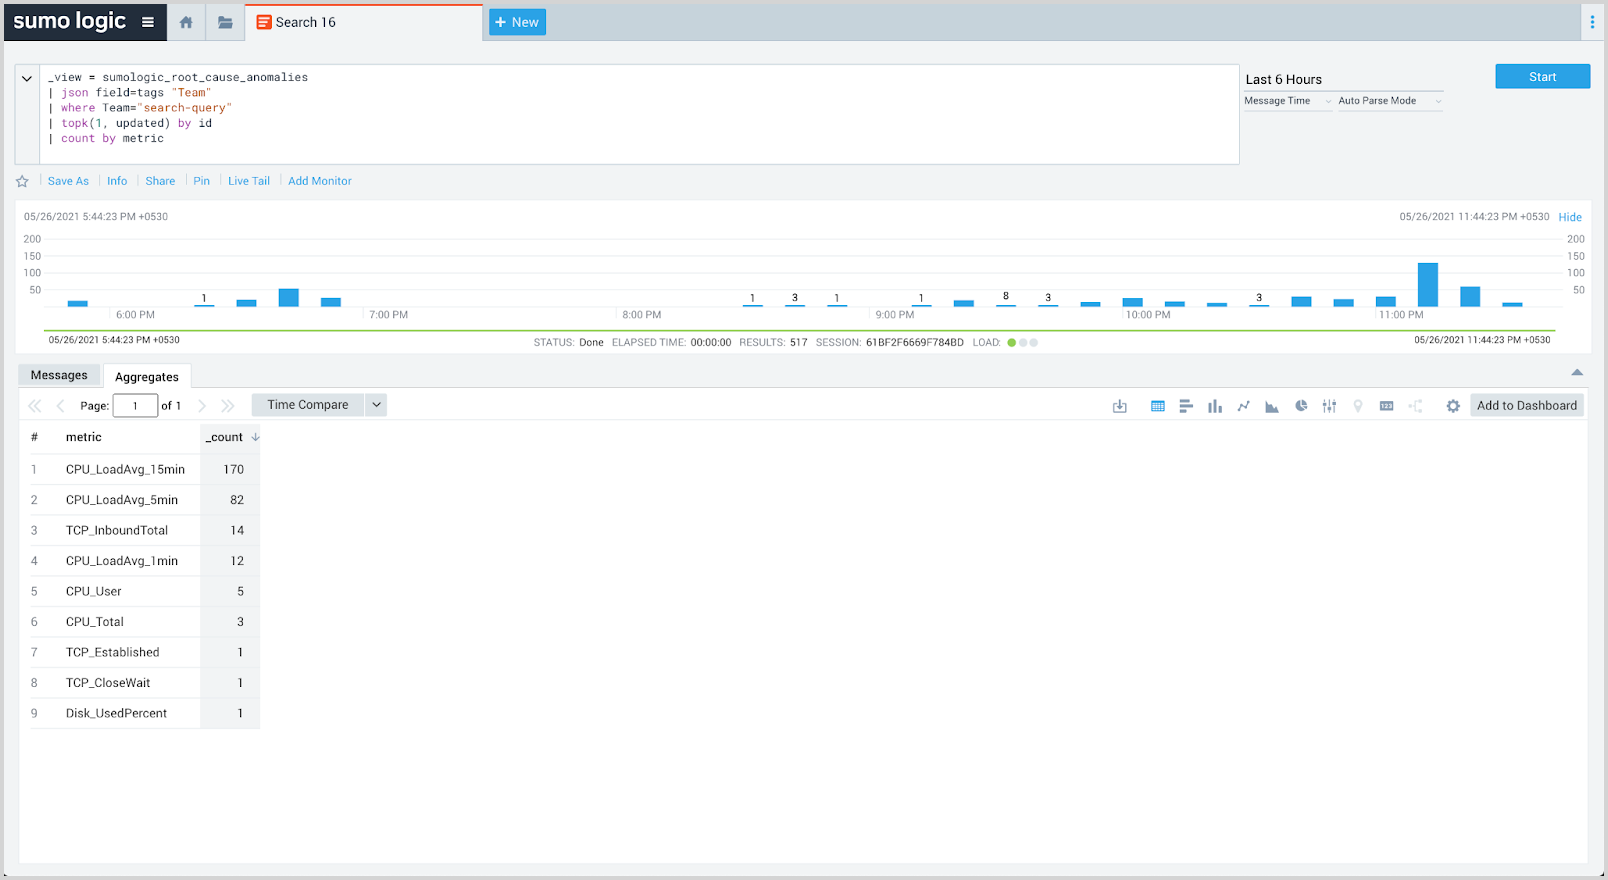
This query returns counts of the metrics that are most found in the EOIs over the selected time range.
_view = sumologic_signals_anomalies
| json field=tags "Team"
| where Team="search-query"
| topk(1, updateTime) by id
| count by metric
Count bottleneck events
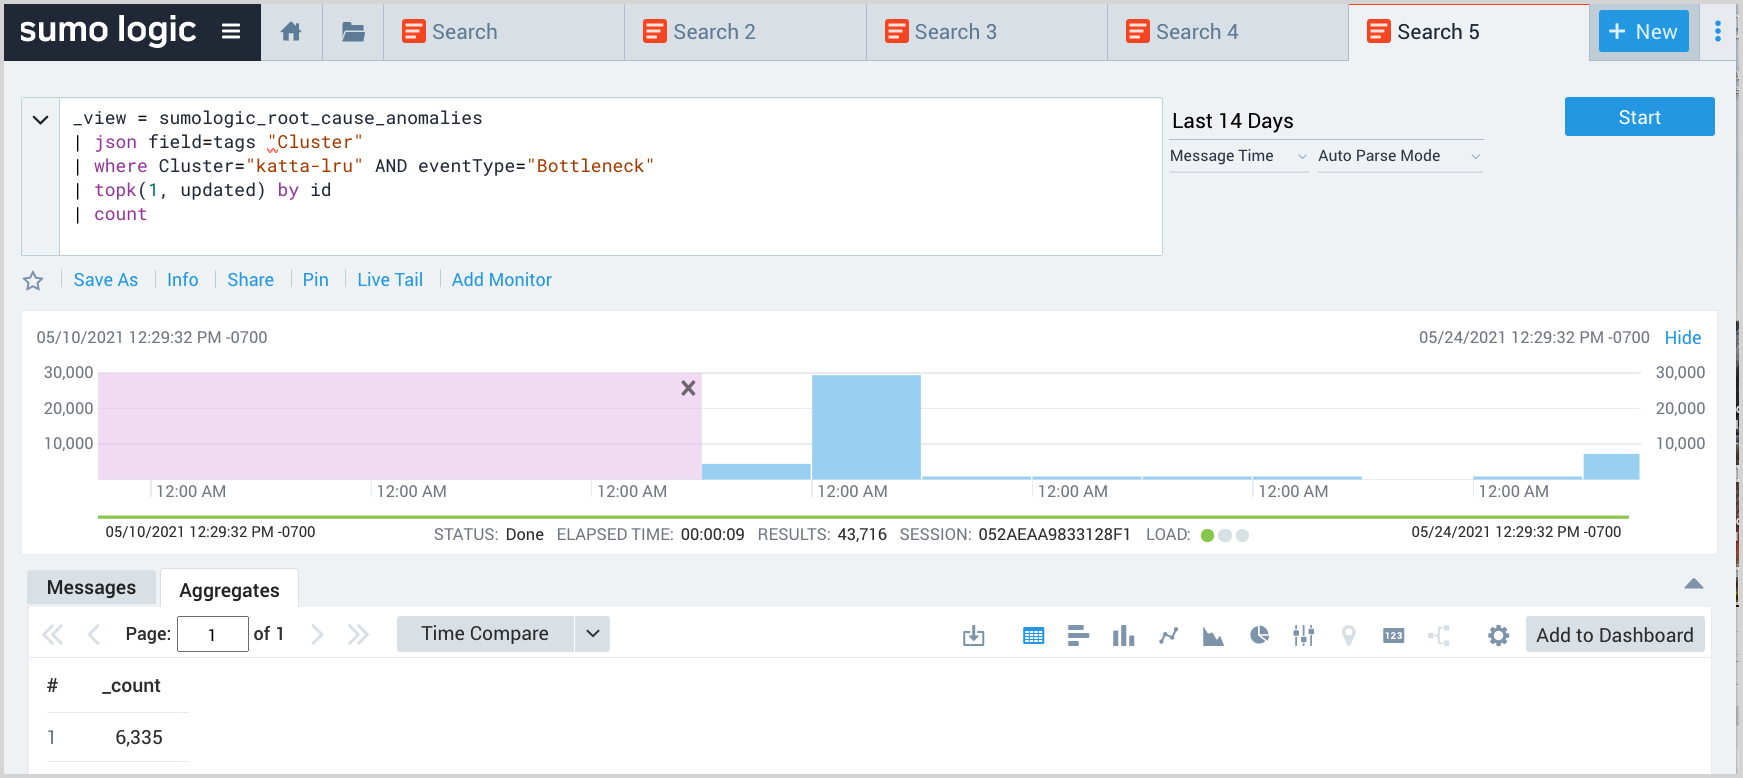
The query returns the count of Bottleneck-related EOIs in the katta-lru cluster.
_view = sumologic_signals_anomalies
| json field=tags "Cluster"
| where Cluster="payments-cluster" AND eventType="Bottleneck"
| topk(1, updateTime) by id
| count
Explain recent EOIs based using available context
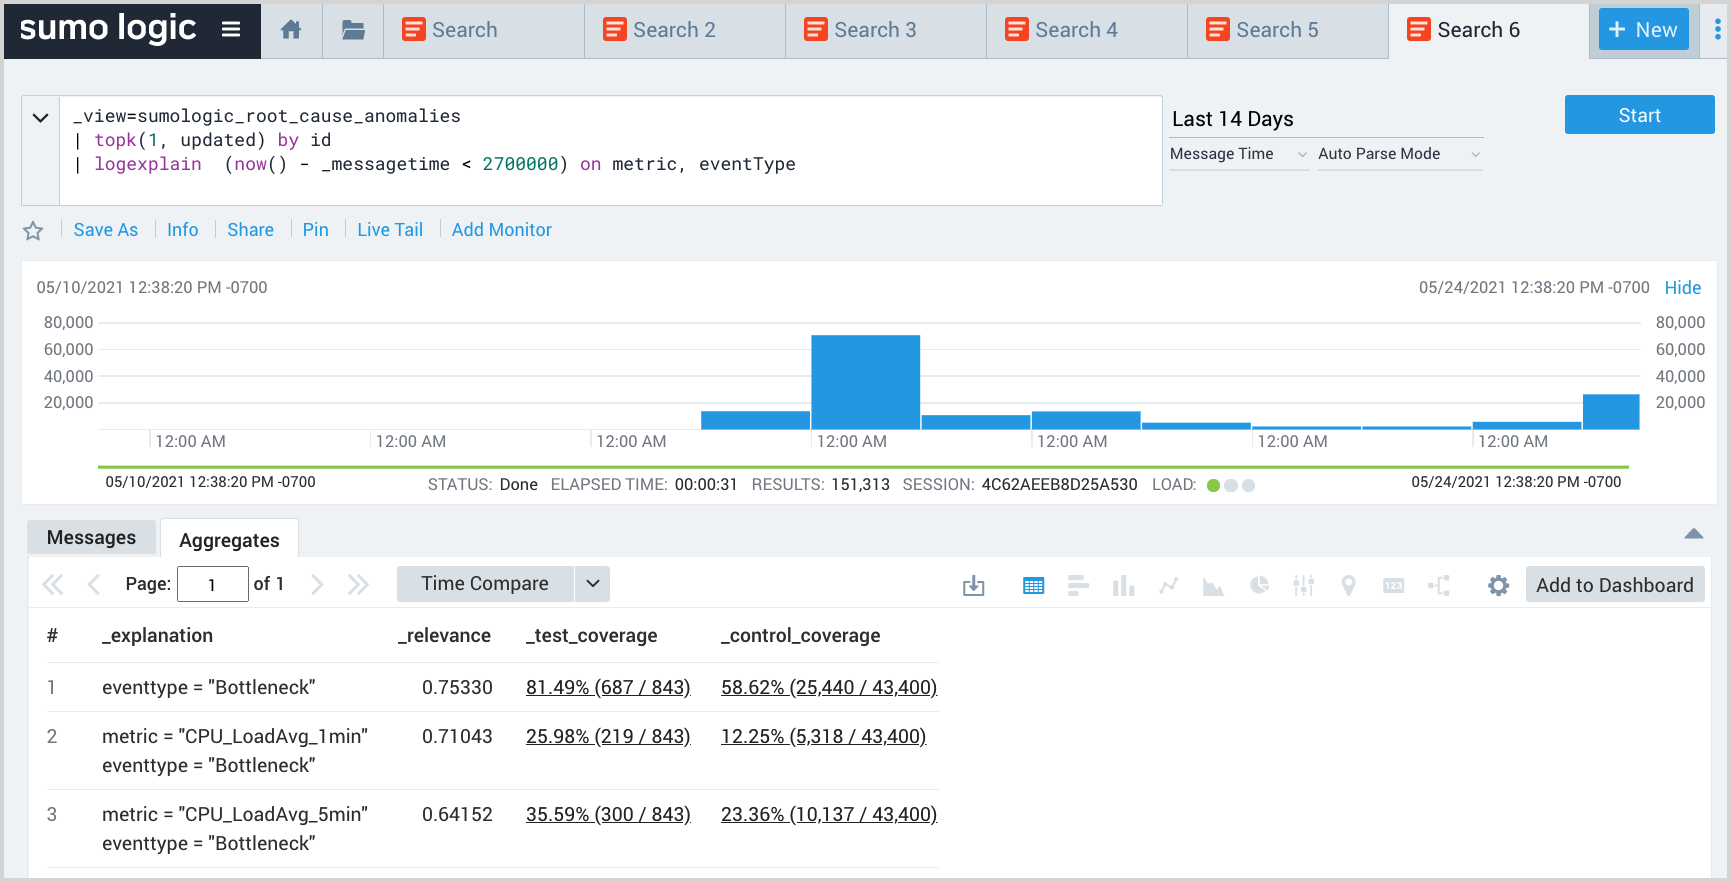
This query uses the logexplain operator to explain which metric and eventType most explain the anomaly patterns in the last 45 minutes compared to the immediately prior time period. Expand the context by adding additional fields to the on condition.
_view=sumologic_signals_anomalies
| topk(1, updateTime) by id
| logexplain  (now() - _messagetime < 2700000) on metric, eventType
Return all EOIs by time slice
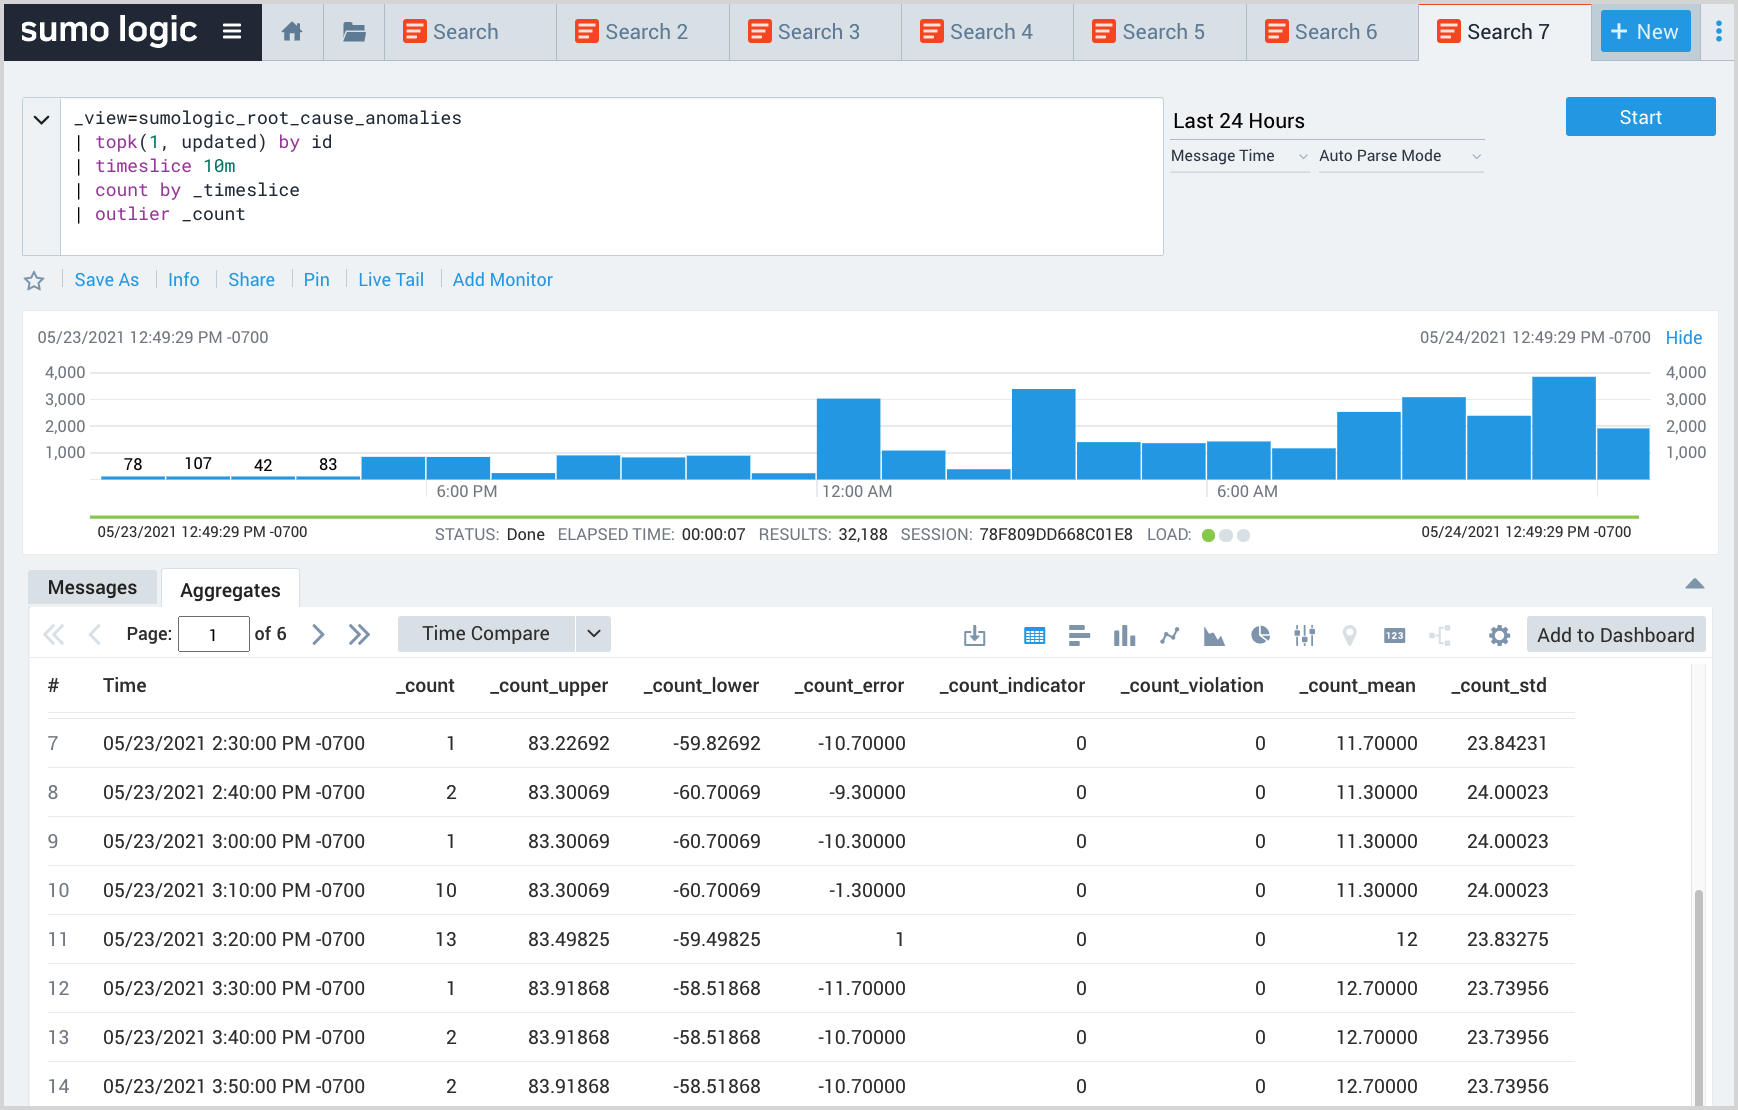
This query analyzes the volume of EOIs to detect sudden changes in the volume using the outlier operator. Such sudden changes may represent outages.
_view=sumologic_signals_anomalies
| topk(1, updatetime) by id
| timeslice 10m
| count by _timeslice
| outlier _count
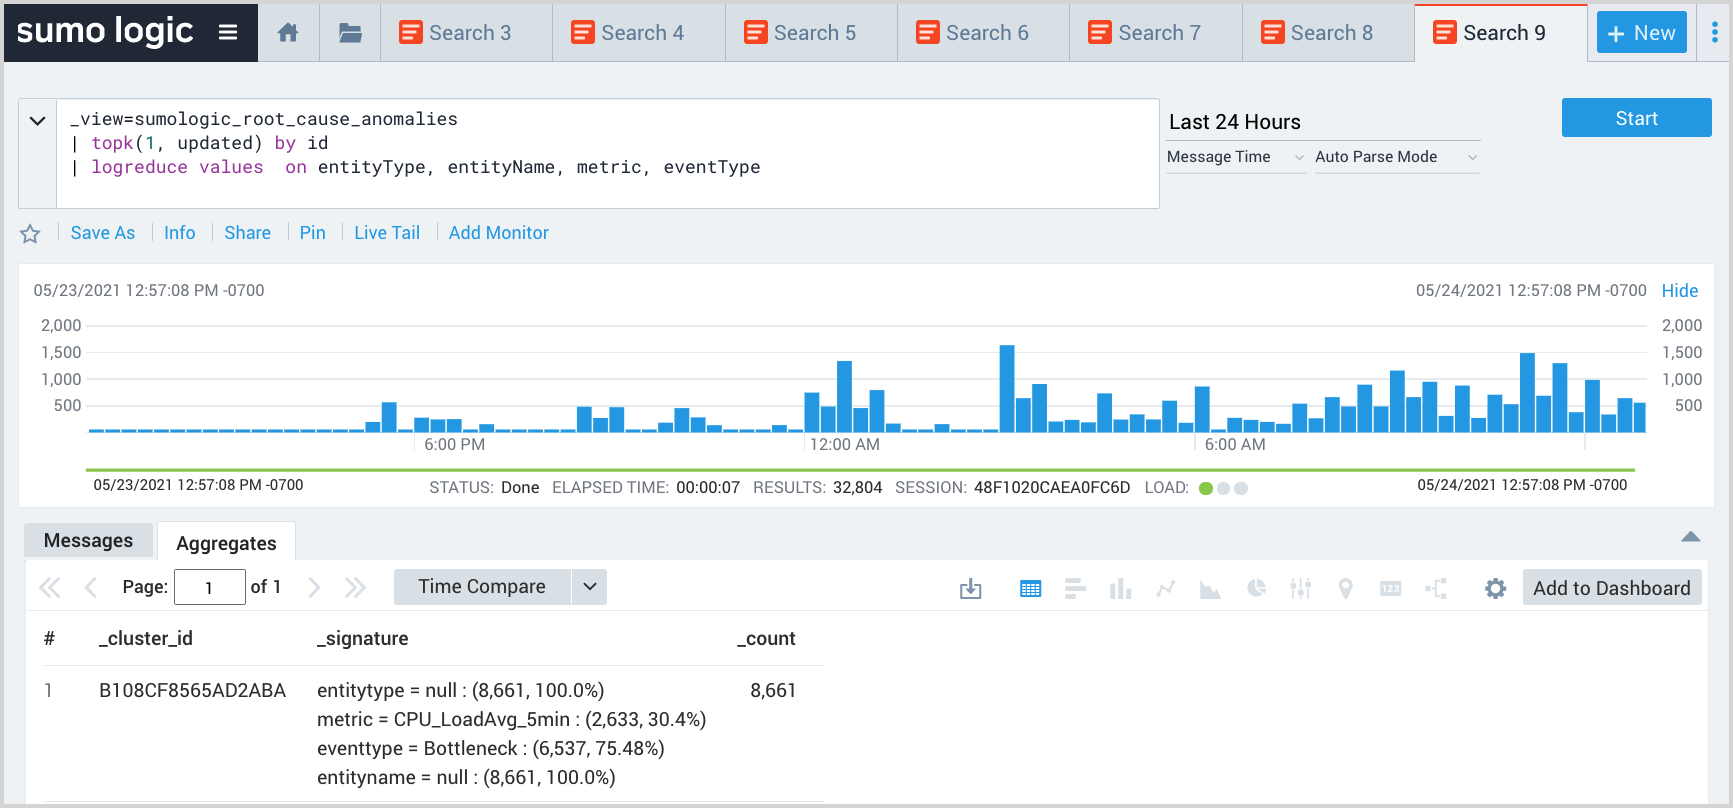
Return entities with the most problems
This query uses the logreduce operator to look for groups of anomalies to assess if some combination of metrics, clusters and so on, account for a large share of overall EOI volume.
_view=sumologic_signals_anomalies
| topk(1, updateTime) by id
| json field=tags "Cluster"
| logreduce values on metric, eventType, Cluster
Explain what changed within a time window
This query uses the logexplain operator to explain which metric and cluster of a particular team most explain the anomaly patterns in the second half of the time window as compared to the first half.
_view=sumologic_signals_anomalies
| json field=Tags "Team", "Cluster"
| where Team = "search-query"
| (queryEndTime() + queryStartTime()) / 2 as midpoint
| logexplain _messageTime > midpoint on metric, Cluster
Dealing with grouped events
Root Cause Explorer groups EOIs in two ways:
- Similarity-based clustering across similar resources and metrics
- Causal clustering leveraging horizontal topology
For more information about how Root Cause Explorer groups EOIs, see Concept 3: Connections between resources and services help pinpoint root cause.
Adding the following line to your query will cause only the topmost event in groups to be returned.
| where isBlank(parentId) and size\> 1
Appendix
Amazon CloudWatch Source Metrics Source
For information about Sumo Logic's CloudWatch source, see Amazon CloudWatch Source for Metrics.
AWS Inventory Source
The AWS Inventory Source collects the inventory of AWS resources in your AWS account, such as EC2 and RDS instances, including all metadata and tags applied to those resources. We use this data to construct a topology of resources, such as which resource talks to or depends upon which other resources, and so on. The CloudFormation template configures the source with the read permissions listed below. However, data is only collected for the namespace provided to the CloudFormation template.
AWS Inventory Source is usable only by the Root Cause Explorer and is not exposed anywhere else in Continuous Intelligence Platform (CIP).
Permissions
{
   "Statement": [{
           "Action": [
"apigateway:GET",
"autoscaling:Describe*",
"cloudfront:GetDistributionConfig",
"cloudfront:ListDistributions",
"cloudtrail:DescribeTrails",
"cloudtrail:GetTrailStatus",
"cloudwatch:Describe*",
"cloudwatch:Get*",
"cloudwatch:List*",
"codedeploy:List*",
"codedeploy:BatchGet*",
"dynamodb:Describe*",
"dynamodb:List*",
"ec2:Describe*",
"ecs:Describe*",
"ecs:List*",
"elasticache:Describe*",
"elasticache:List*",
"elasticfilesystem:Describe*",
"elasticloadbalancing:Describe*",
"elasticmapreduce:Describe*",
"elasticmapreduce:List*",
"es:Describe*",
"es:List*",
"health:Describe*",
"kinesis:Describe*",
"kinesis:List*",
"lambda:List*",
"mq:Describe*",
"mq:List*",
"rds:Describe*",
"rds:List*",
"redshift:Describe*",
"route53:List*",
"sqs:ListQueues",
"ses:GetSendStatistics",
"ses:GetSendQuota",
"sns:List*",
"tag:GetResources",
"tag:GetTagKeys",
"tag:GetTagValues",
"xray:BatchGetTraces",
"xray:Get*",
"pi:DescribeDimensionKeys",
"pi:GetResourceMetrics"
           ],
           "Effect"  : "Allow",
           "Resource": "*"
       }
   ],
   "Version": "2012-10-17"
}
AWS X-Ray Source
The AWS X-Ray source collects the AWS X-Ray service graph, as well as service-level metrics such as latency, throughput, and error rate. The service graph allows us to figure out which service depends on which other service(s).