Metrics Explorer
This page describes the Metrics Explorer UI and how to use it.
If you prefer to use the Classic metrics UI, see Switch to the Classic metrics UI.
About the UI
The Metrics Explorer appears when you open a new metrics tab. The page has two modes:
- Basic. Basic Mode provides a query builder UI: you can construct metric queries by selecting metadata fields, dimensions, metrics, and operators from pull-down lists. This makes it easier to create your search scope and to apply operators to the metrics that are returned. You’ll still want to understand the functionality of metric operators, but the Metrics Explorer helps you by prompting you with a list of available operators, and after you choose an operator, the options or qualifiers that the operator supports. For more information about the Basic UI, see About Basic Mode UI.
- Advanced. In Advanced Mode, you can enter free-form metric queries. You can enter your entire query manually, but Advanced Mode will also prompt you with pull-down lists of metadata fields, dimensions, metrics, and operators. For more information, see About the Advanced Mode UI.
If your query supports basic mode, you can freely move between basic and advanced mode to build and run your query.
Switch between Basic and Advanced Mode
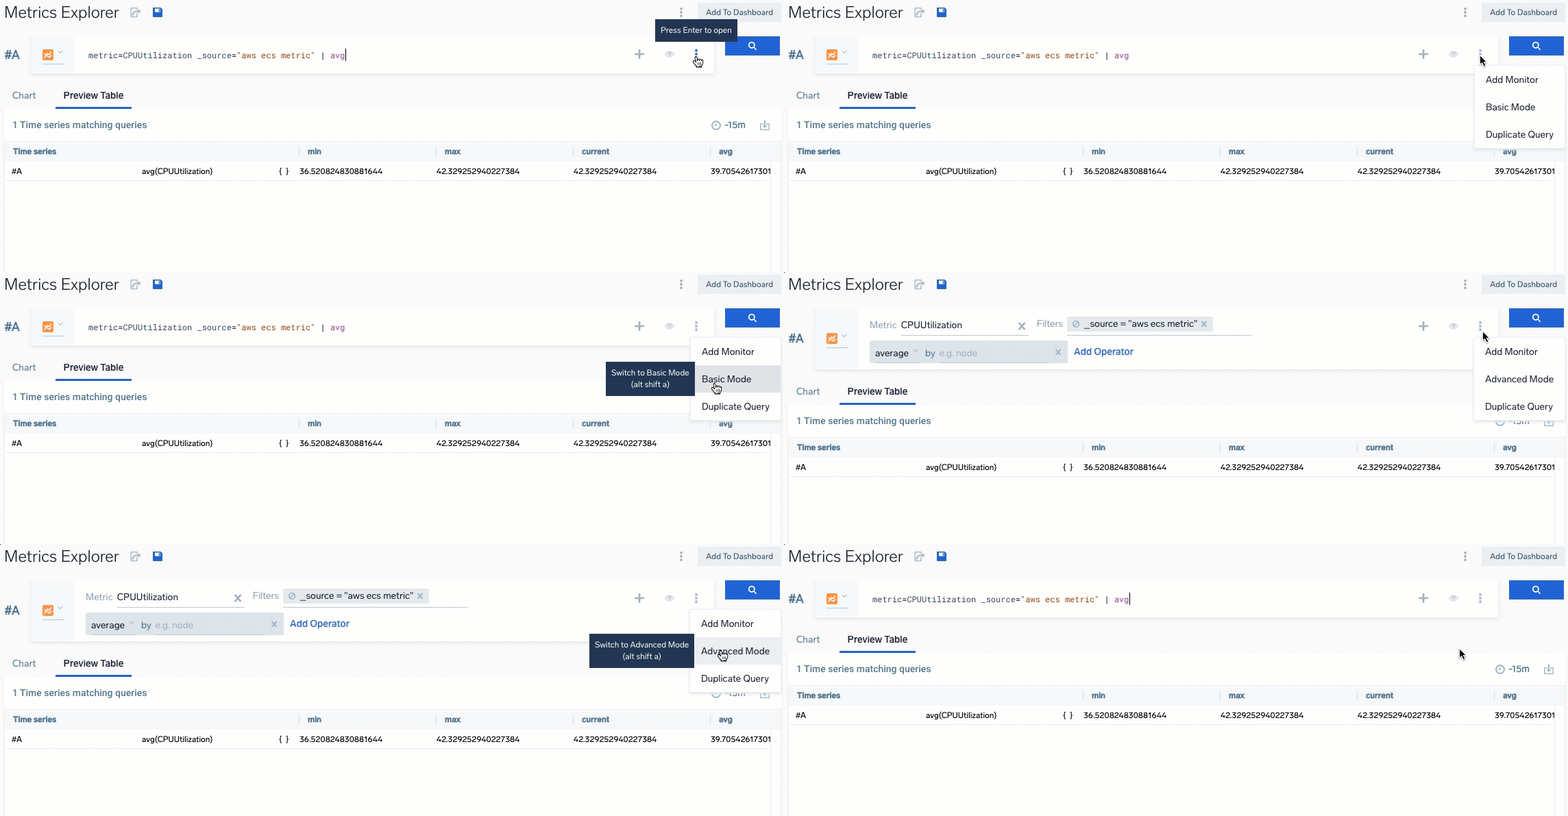
When you open a new Metrics tab, it is displayed in Basic Mode. You can switch to Advanced Mode by clicking the three-dot icon, and selecting Advanced Mode. When you are in Advanced Mode, you can switch back to Basic Mode from the same options menu.
If you use the Advanced Mode to build complex metrics, you can convert it to Basic Mode by selecting the option. If the query cannot support basic mode, you receive a message informing you "Your query cannot be switched to Basic Mode."
Example of queries that will not convert:
metric=CPU_Sys _sourcecategory=autocomplete | bottomk (5, avg + 3 * stddev)This query is not supported becausebottomkin basic mode only supports simple aggregators such asavgorcount. It does not support arbitrary formulas.(metric=CPU_Sys OR metric=CPU_Idle) _sourcecategory=autocompleteThis query is not supported because basic mode does not support logicalORfor the selector part of the query.
When converted, the filters convert allowing you to select and modify, make different selections, remove filters, and add operators as you would normally in Basic Mode.

Switch to the Classic metrics UI
If you prefer to use the Classic metrics UI, you can switch to it, and switch back the Metrics Explorer interface at any point. To switch to Classic metrics, click the three-dot icon near the upper right corner of the page and click Switch to Classic Metrics.
Not all of the features available in the Metrics Explorer are found in the Classic UI.
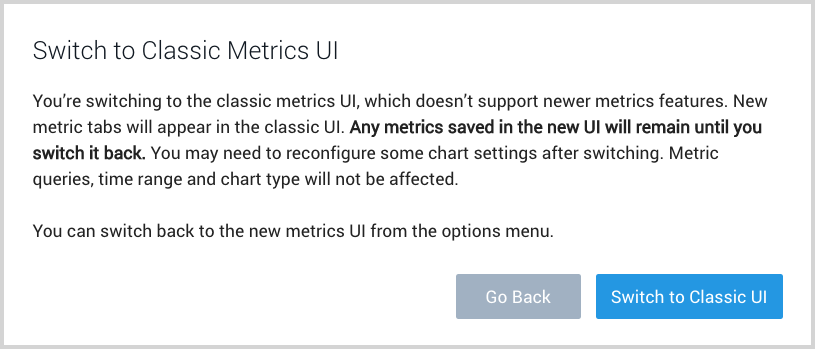
You'll be asked to confirm your choice. Click Switch to Classic UI to proceed. After you switch to the Classic UI, you can return to the Metrics Explorer UI by clicking the three-dot icon again, and selecting Switch to New Metrics. While you are in the Classic UI, new metric tabs you open will display the Classic UI.
About Basic Mode UI
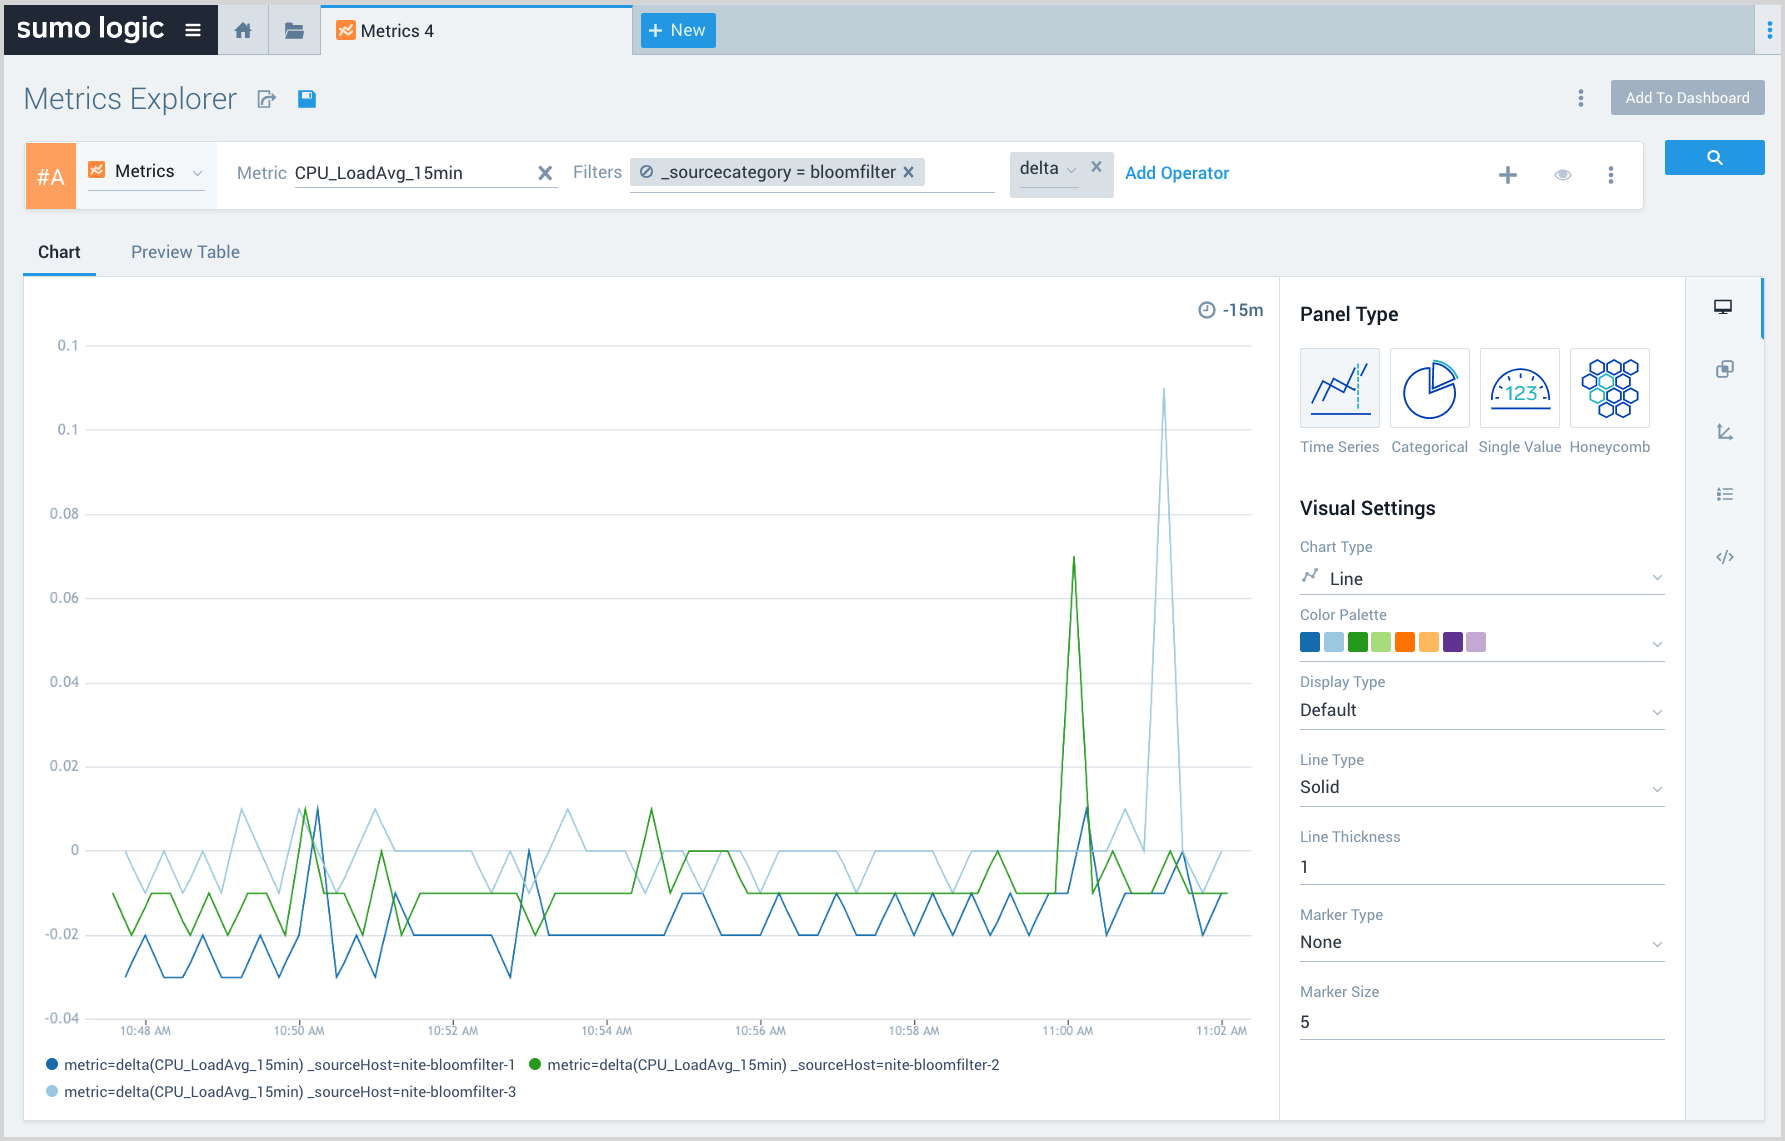
This section is a brief introduction to the Basic Mode of the Metrics Explorer. This screenshot shows the UI with a query already built.
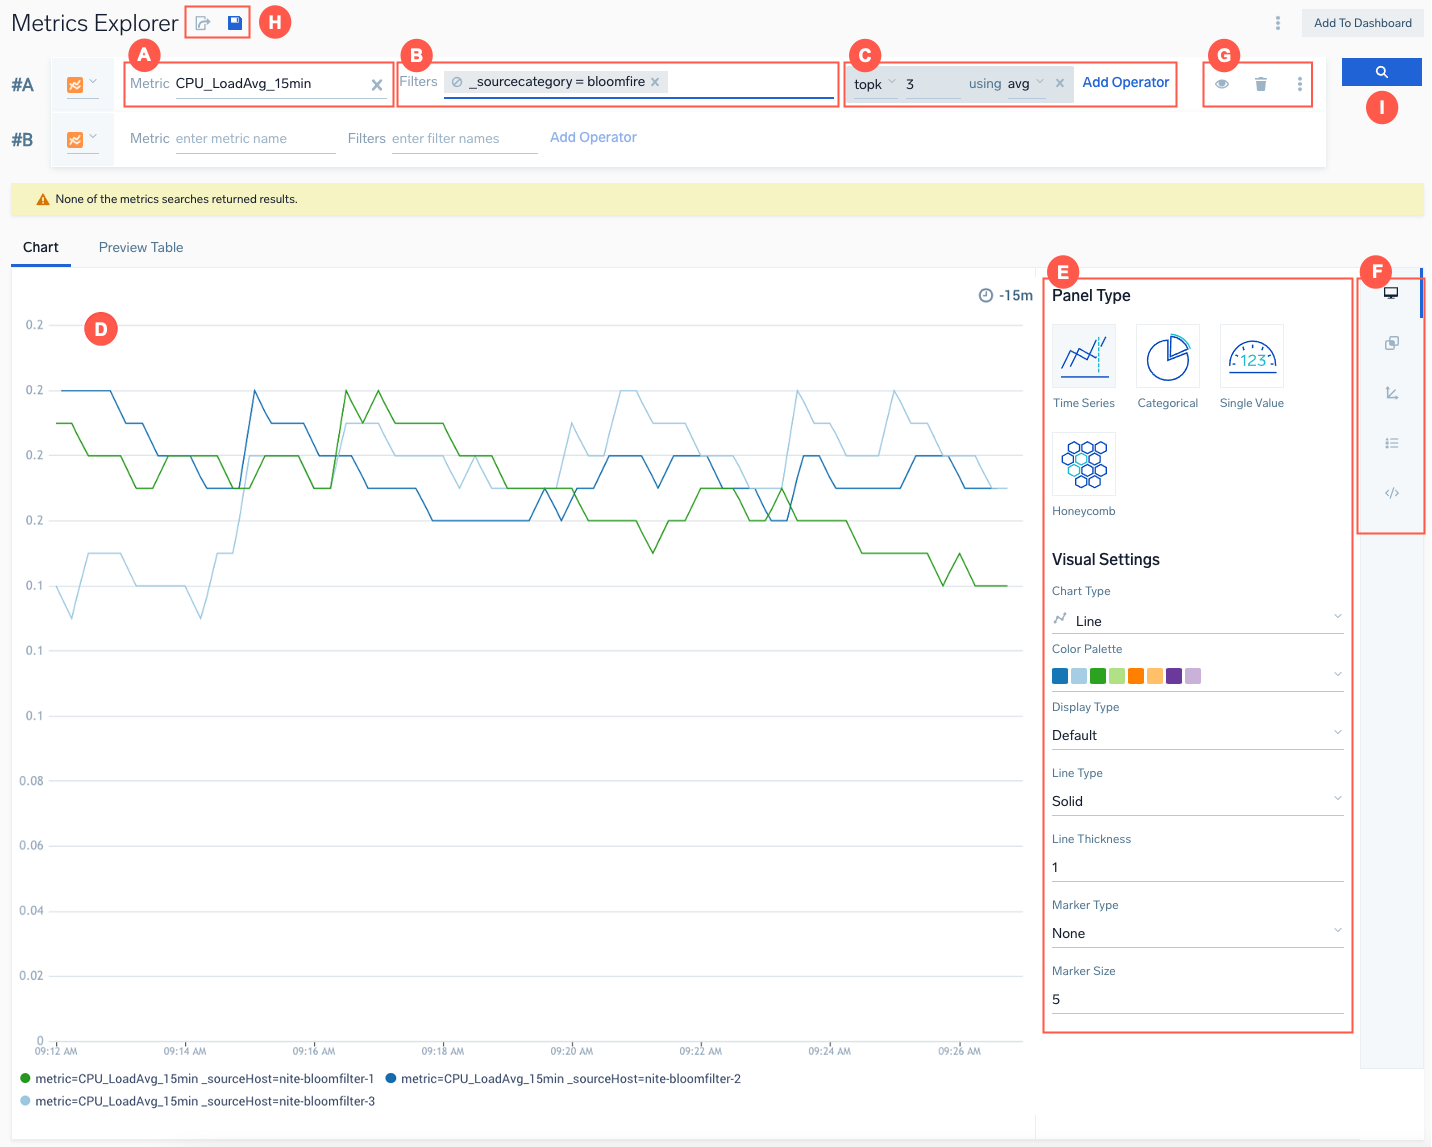
The key components of the UI are:
| Element | Description |
|---|---|
| A | In the Metric area, you select the metric you want to return. When you click in this area, you’re presented with a list of metrics. In our example query, we selected the CPU_LoadAvg_15min metric. As you enter changes to your query, a message displays indicating if you need to execute the query to see updated results. |
| B | In the Filters area, you can narrow down the scope of your query, using metadata and metric dimensions. When you click in this area, you’re presented with a dropdown list of the metadata fields and dimensions associated with the metric you selected. When you select a metadata field or dimension, you’re presented with a list of values for the selected field or dimension. In our example query, we selected one metadata field, _sourceCategory=bloomfilter. The more metadata fields and dimensions you select, the narrower your query will be. After you've selected a filter and filter value, you can click the chip for the filter setting to edit it. |
| C | In this area, you can apply one or more metric operators to metric query results. When you click Add Operator, you’re presented with a list of metric operators. In our example query, we selected the topk operator. |
| D | By default, the left pane below the query builder section presents Time Series Table of the time series returned by your query. You can click Chart to view a visualization instead. When you switch to the chart view, by default, a time series plot is presented. You can select a different visualization method, although not all visualizations make sense for every query. |
| E | In the Panel Type area, you can select a different chart type: Categorical, Single Value, Map, and Honeycomb. The Visual Settings options allow you to customize your chart. For more information about the Chart Customization, see Modify a Chart. |
| F | The icons on the right of the Panel Type area allow you to add a query, hide a query, clear a query, enter advanced mode, and duplicate a query. |
| G | The icons in this area allow you to add another query row, hide a query, and open the more options menu. |
| H | The icons in this area allow you to save and share metric queries. |
| I | The magnifying glass icon is the run button you click to run a metric query. You can also run a query by pressing Enter on your keyboard, or pressing Alt-Enter, depending on how your Query Editing Preference is set. |
About Advanced Mode UI
In Advanced Mode, you can enter a free-form metric query. You'll also be prompted with selectors for choosing metrics, metadata, and operators.

Keyboard shortcuts
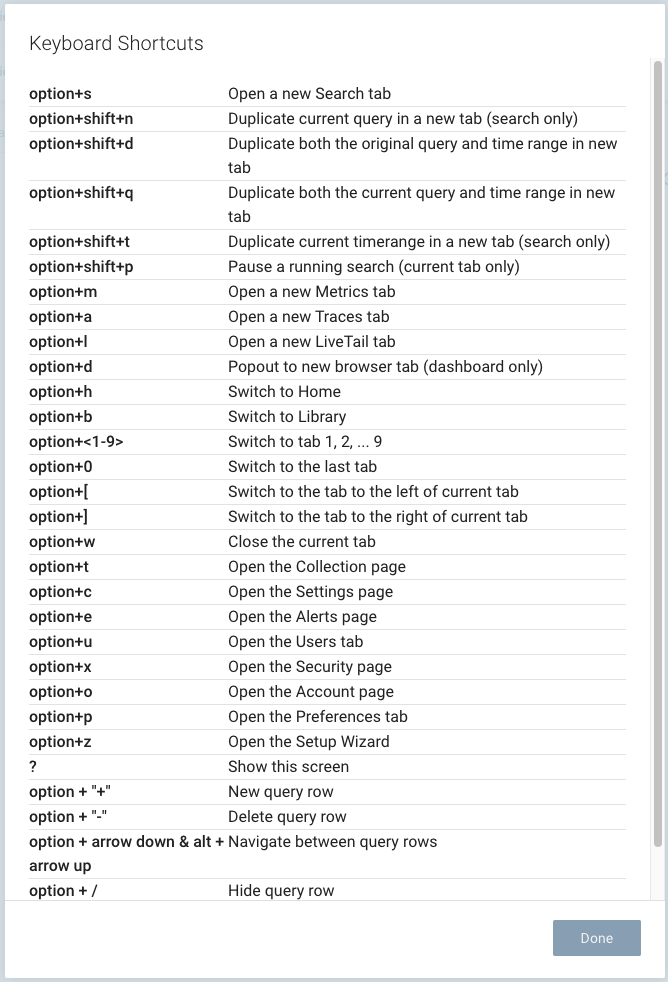
You can use keyboard shortcuts in the Metrics Explorer to navigate quickly among multiple metric queries, hide or show queries, switch to advanced mode, and so on. Use Shift ? display a list of keyboard shortcuts.
The listed shortcuts display for your Operating System. The following list displays for MacOS.
What's in the Time Series Table?
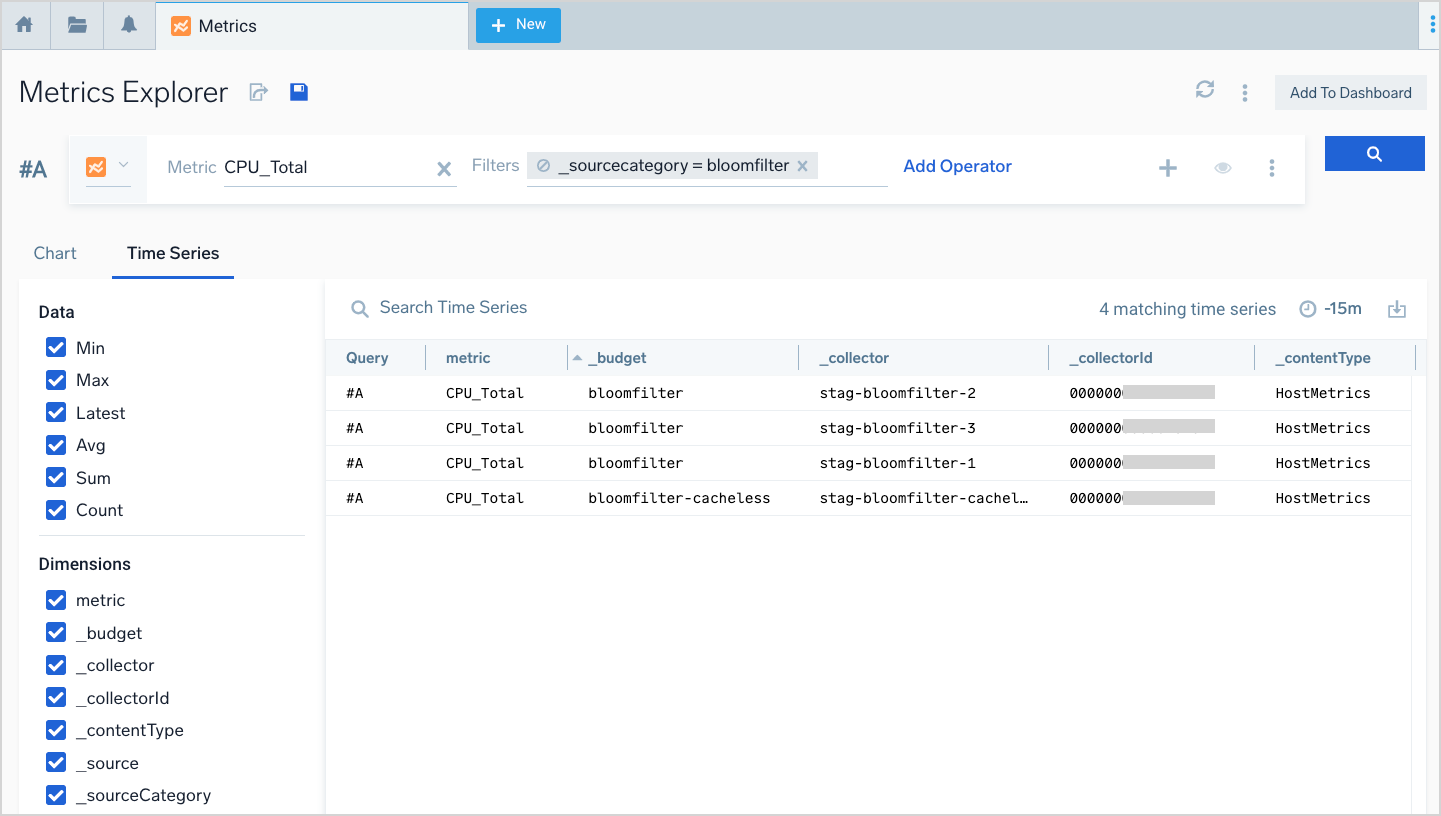
The screenshot below shows a portion of the Time Series Table for a metric query. (There are too many columns to show in a screenshot.)
Contents of the Time Series Table
The Time Series Table contains a row for each time series returned by a query. A row contains the following information:
- Query. Indicates which query returned the time series, for example
#Aor#B. - Metric. The name of the metric returned, for example
CPU_LoadAvg_15min. - dimensions. A column appears for each dimension associated with the metric. Dimensions include standard Sumo Logic metadata fields, such as
_sourceCategory,_collectorId,_sourceHost, and any other dimensions added to the metric by other means, for instance, using the Metric Rules Editor. - Data. The columns furthest to the right of the Time Series table present the current value of the metric, and minimum, maximum, average, current, count, and sum of the metric value over the query time range.
You can search the query results by entering a string in the search area above the Time Series table and clicking the magnifying glass icon.
You can add or remove a column from the Time Series table using the checkbox next to the column name in the pane to the left of the table.
Context menu
When you mouse over a cell in the Time SeriesEC2 table, a three-dot icon appears. Click it to display a context menu.
The context menu is available in both Basic and Advanced mode.
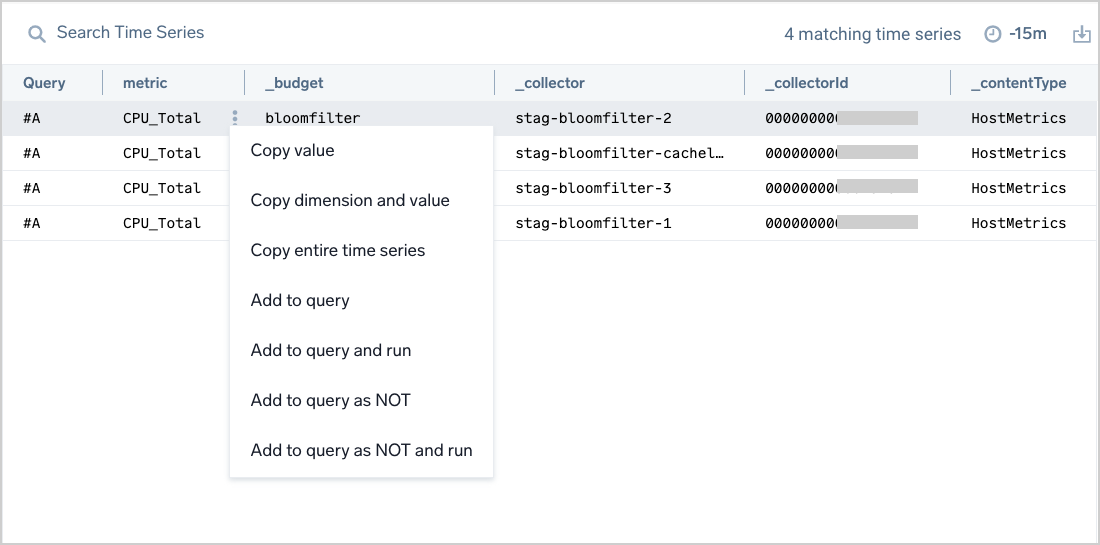
The menu options are:
- Copy value. Copies the value in the cell to the clipboard.
- Copy dimension and value. Copies the dimension and the value in the cell to the clipboard as a key:value pair.
- Copy entire time series. Copies the complete time series to the clipboard as an array of key:value pairs.
- Add to query. Adds the dimension to the query.
- Add to query and run. Adds the dimension to the query and runs the query.
- Add to query as NOT. Adds the dimension to the query with a NOT.
- Add to query as NOT and run. Adds the dimension to the query with a NOT and runs the query.
Export query results
You can export the results of a query to a .cvs file by clicking the download icon at the right end of the search bar.
![]()
You’ll be prompted with the options to:
- Include data points. If you select this option, the export will include the individual data points collected during the currently selected time range.
- Export only selected fields. You can use this option to export a subset of the data and dimensions returned by your query. In the left pane, deselect the items you don’t want to export, and then choose Export only selected fields.
View Metrics Query History
Every query run by a user is saved in query history (both incorrect and correct queries). You can use the Metrics query history to find your previous metric queries. Both those run in the Metric Tab and the Dashboard panels. Queries as saved and stored in user settings, just like information on hidden columns for Preview Table and open tabs.
When you select a query from the list, it is updated for a query row where you opened query history dropdown. Selected queries from list are adjusted to current query editor mode selected by the user. For example, if you are in Basic mode and the query was run before in advanced mode, the Metrics interface will adjust to Basic mode.
If the query editor mode can't be adjusted, it is changed to advanced mode so that it can handle query from history. It is possible to run queries which were used with parameters/template variables.
Create a metric query
In the Sumo Logic UI, click + New and choose Metrics from the dropdown list.
The Metrics Explorer opens. Click the Metric field. A list of metrics appears. You can scroll through the list, or begin typing to dynamically narrow the list. Click the desired metric.

Click the Filters field. A list of metadata fields and metric dimensions appears. Scroll through the list, or begin typing to dynamically narrow the list. Click a field or dimension. In the screenshot below, we clicked the
_sourcecategorymetadata field. A dropdown list of values for the selected item appears.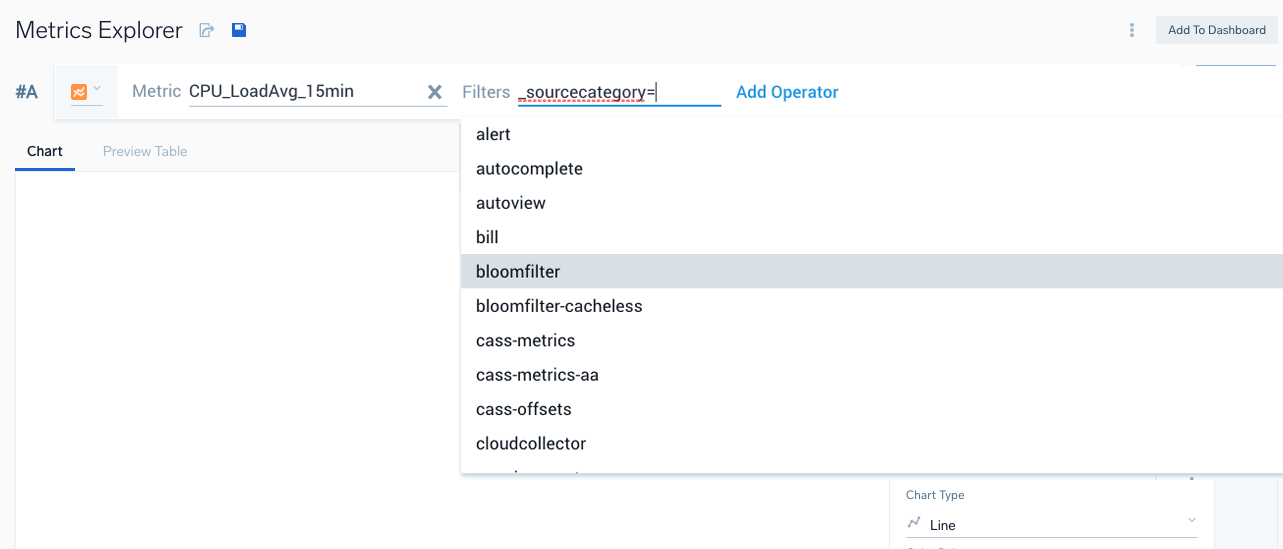
Scroll through the list, or begin typing to dynamically narrow the list. Click the desired value. The Filter field now contains the key-value pair you selected. You can click a filter setting to edit it. You can preface a filter value with and exclamation point (!) to NOT the value.
As desired, repeat the previous steps to add additional filters to the query.
When you are ready to run your query, click the run button:
The metrics returned by your query appear in the Time Series Table.

At any time, you can click Chart to see a visualization of the metrics. The chart area now displays a visualization of the selected metric.
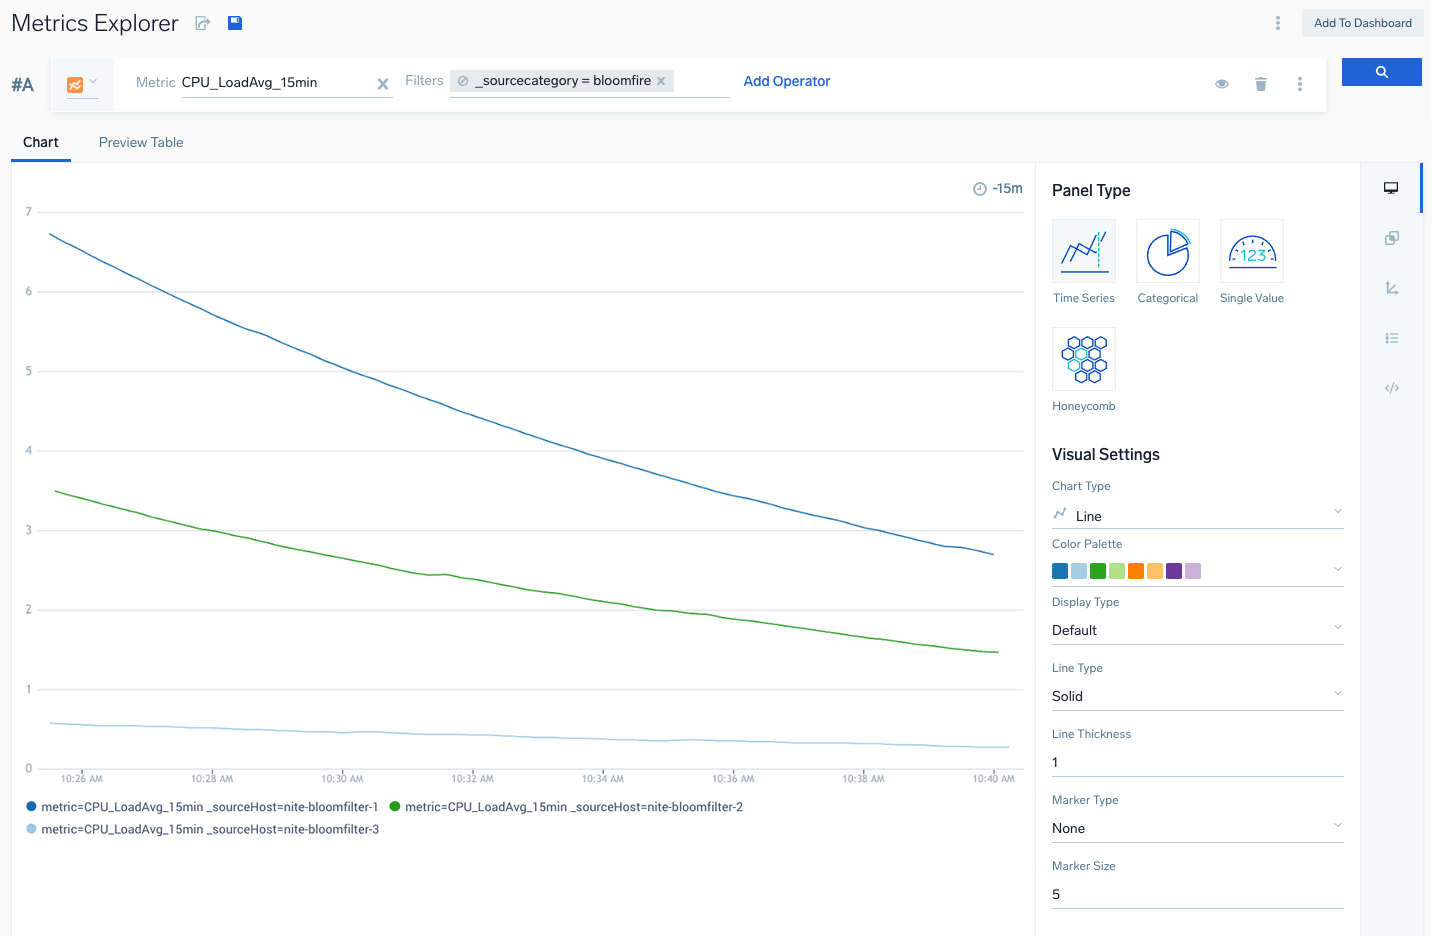
If you want to apply an operator, click Add Operator to the right of the Filters field. A list of metric operators appears. Note that when you hover over an operator, a tool tip displays the Advanced Mode syntax and a description of the operator.
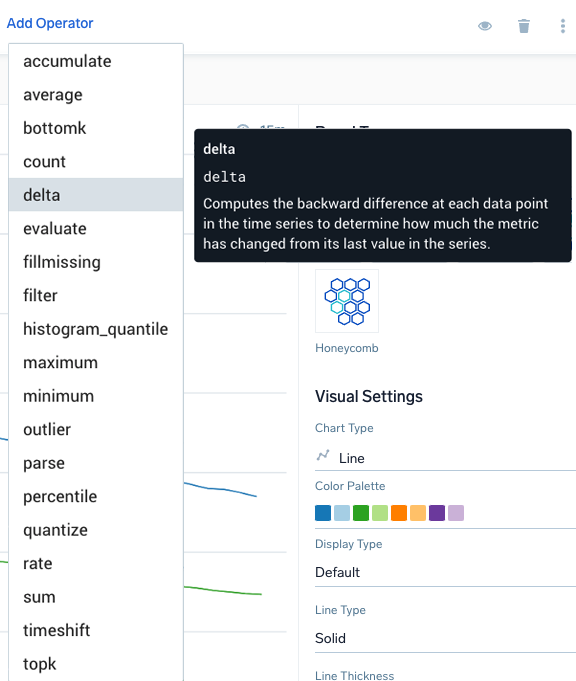
Choose an operator from the list. If you choose an operator that supports or requires arguments, you are prompted to supply them. Click the run button to run the updated query. The chart area updates to show your query results with the operator applied.
Apply additional operators to the query, as desired.
Set Warning and Critical Thresholds
For some chart types, you can use the Thresholds tab in the Display Settings panel to define warning and critical thresholds. The Thresholds tab is available in the Chart view for a Time Series panel, and for these chart types for Categorical panels: Line, Area, Bar, Column, and Table.
To set threshold values
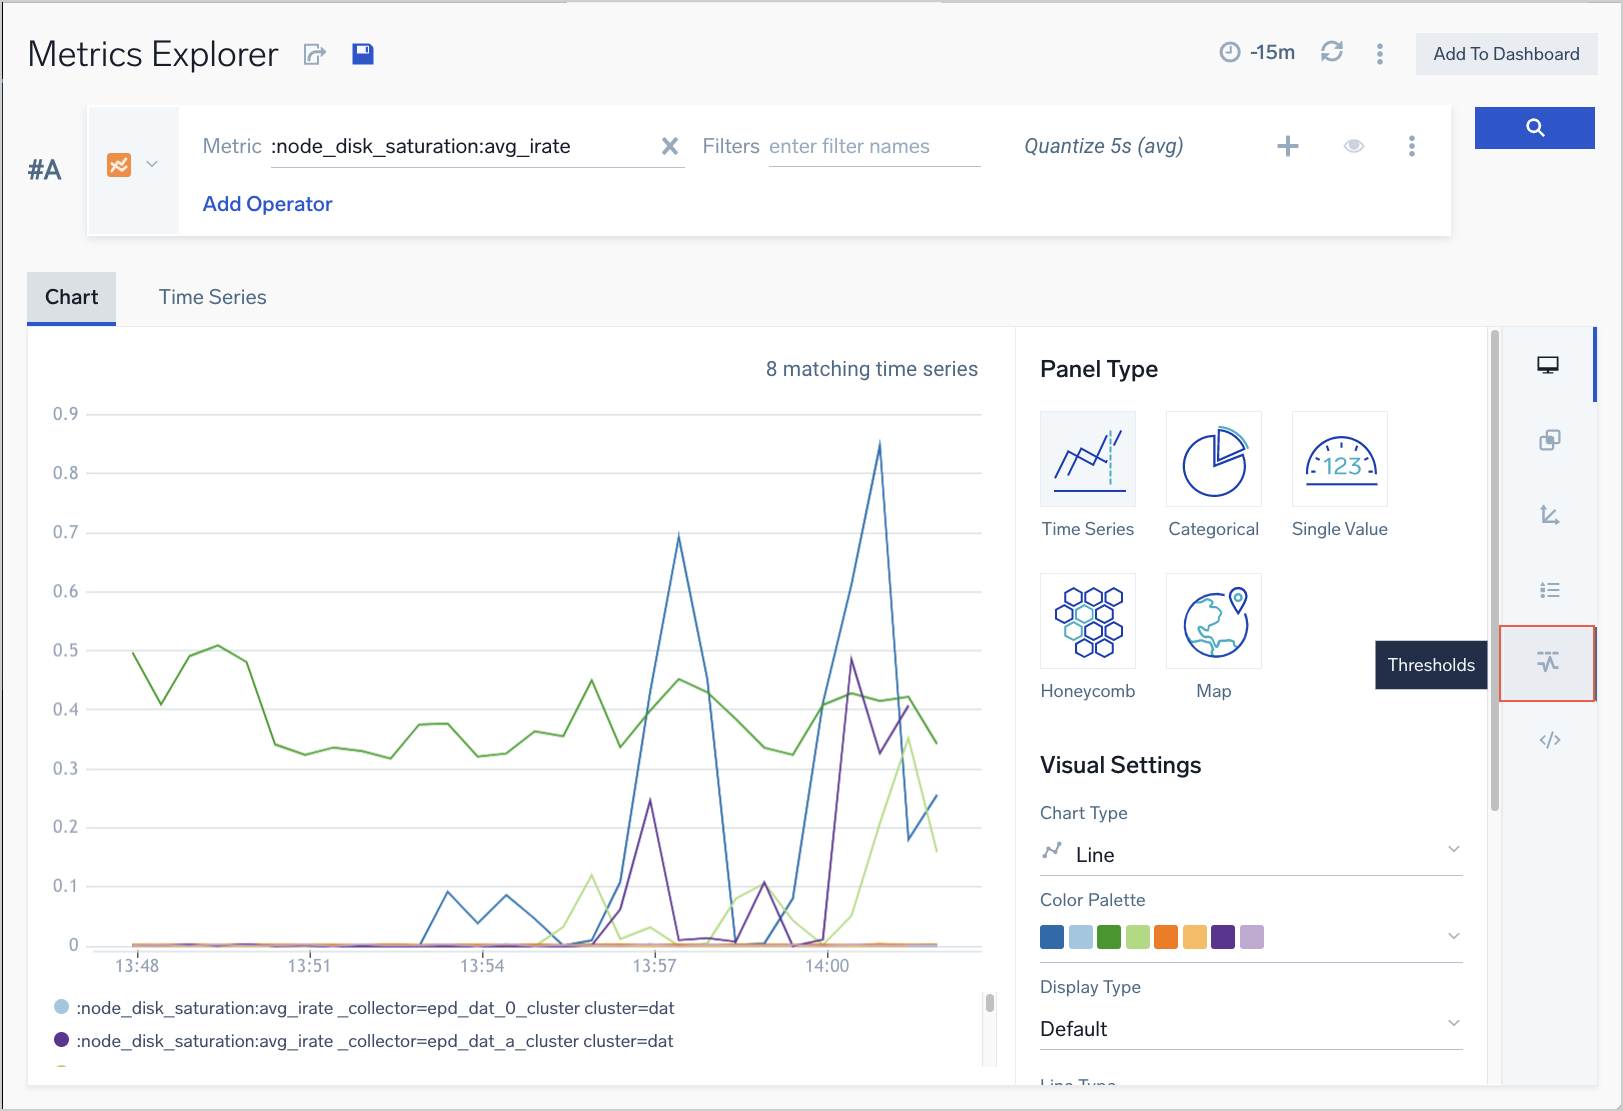
- After you enter your query, in the Chart view, click the Thresholds icon in the right-side pane of icons.
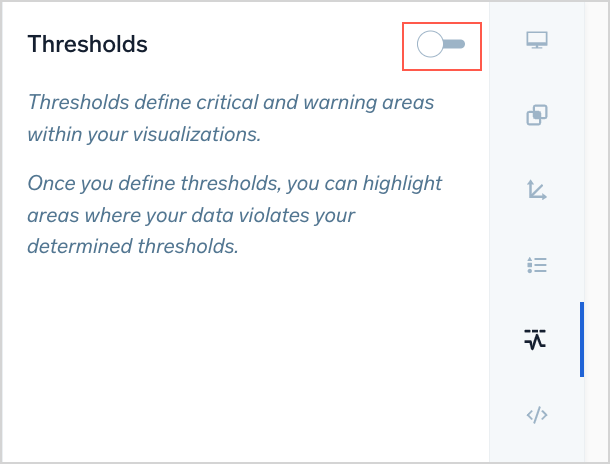
- Click the toggle in the Thresholds pane.
- The Thresholds area updates to display default settings.
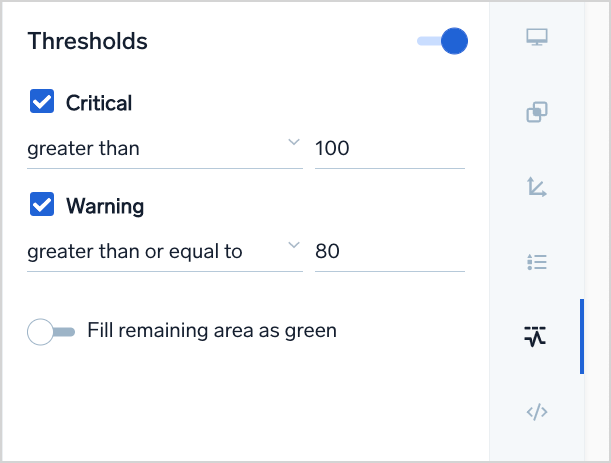
- Configure the appropriate comparator and threshold values, based on your data and requirements. You can choose from the following comparators.
- greater than. Any value greater than the value you specify will violate the threshold.
- greater than or equal to. Any value greater than or equal to the value you specify will violate the threshold.
- less than. Any value less than the value you specify will violate this threshold.
- less than or equal. Any value less than or equal to the value you specify will violate the threshold.
- includes. Any value between the two values you specify will violate the threshold.
- excludes. Every value NOT between the two values you specify will violate the threshold.
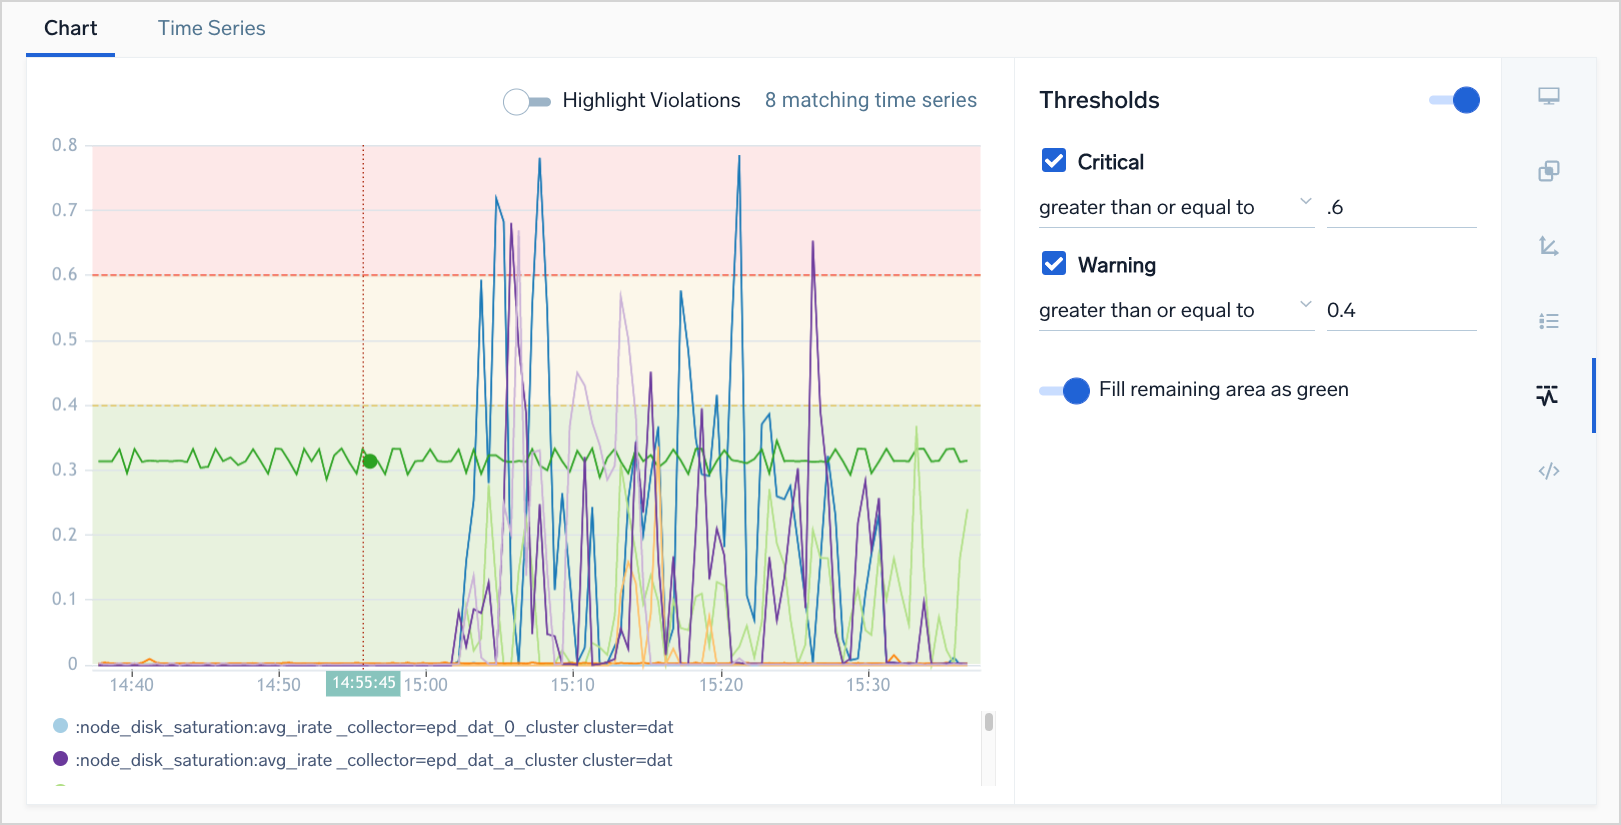
- Threshold bands appear on the chart. The red band shows the Critical threshold, the yellow band is Warning.
The chart type in the screenshot below is a line chart. For other chart types, the threshold visualization may vary. For example, in bar and column charts, the bars and columns are shaded yellow, red, and green in accordance with the thresholds defined.
The critical threshold has higher priority than the warning threshold. If the thresholds you define overlap, only the Critical shading (red) is applied to the overlapping area. fill-green.png - If you toggle the Fill remaining area as green option, the portion of the chart with no thresholds is shaded in green.
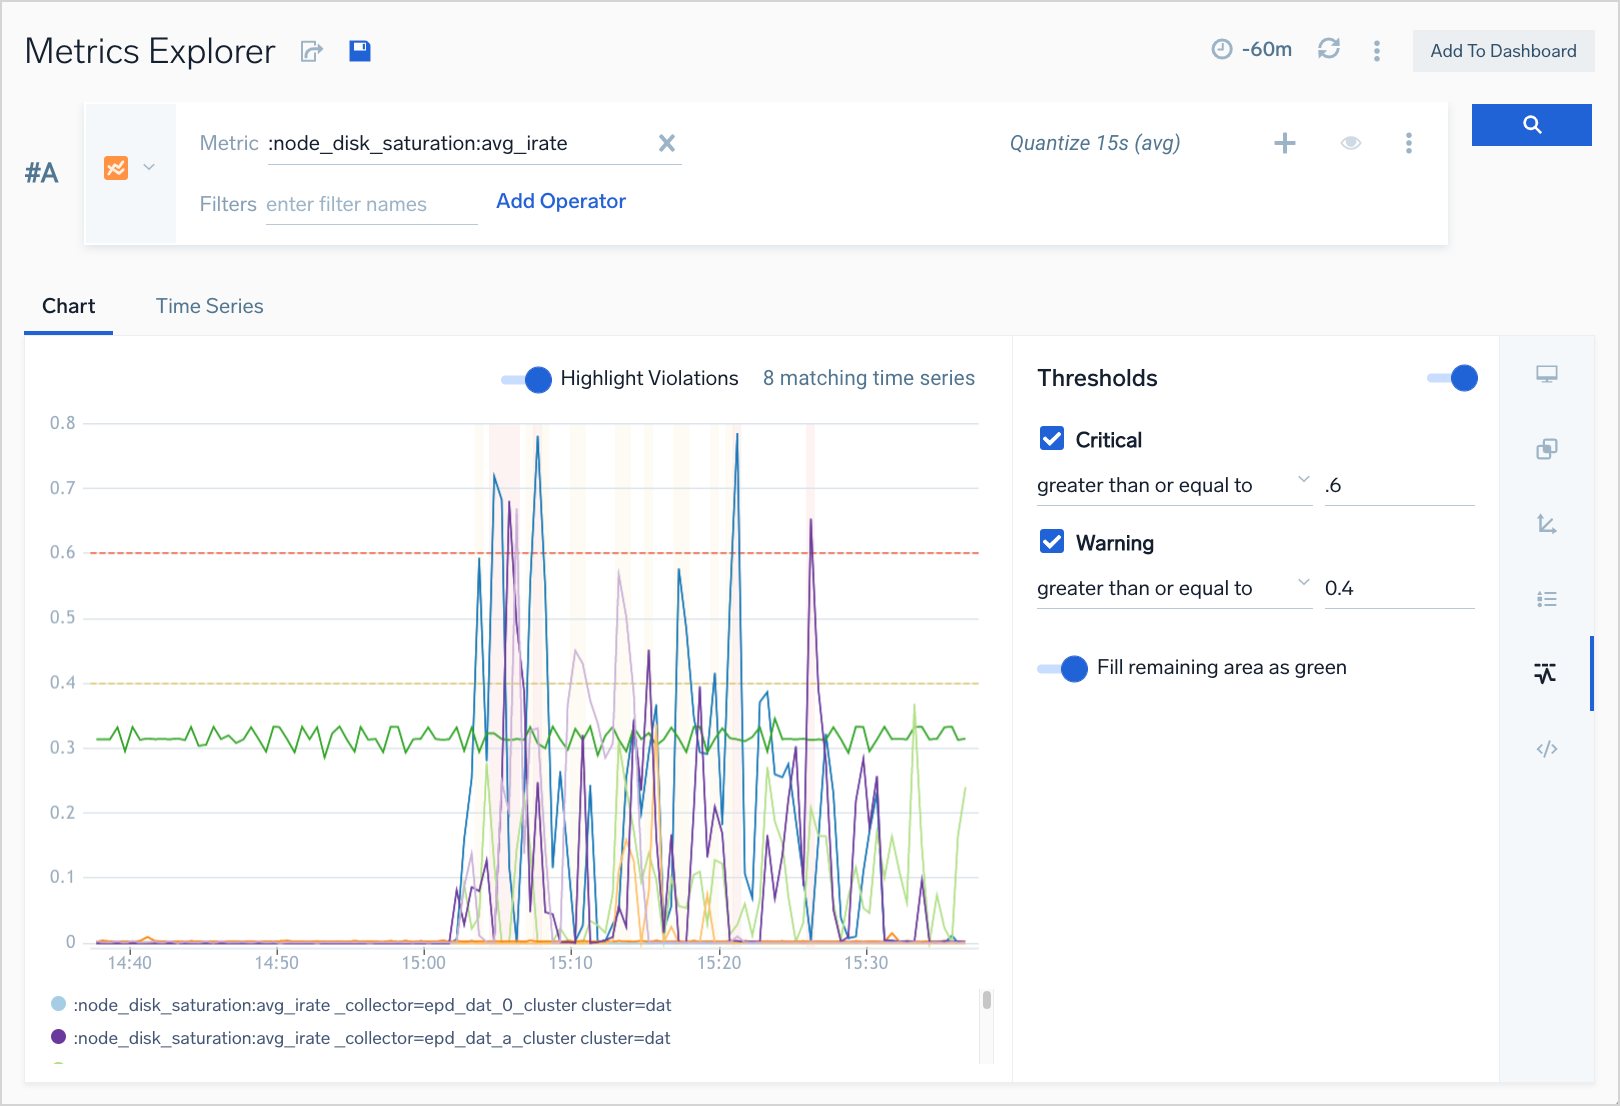
- If you toggle the Highlight Violations option, the horizontal threshold shading is removed. Instead you’ll see vertical red and yellow highlighting in the timelices where those thresholds were violated.
Add another metric query
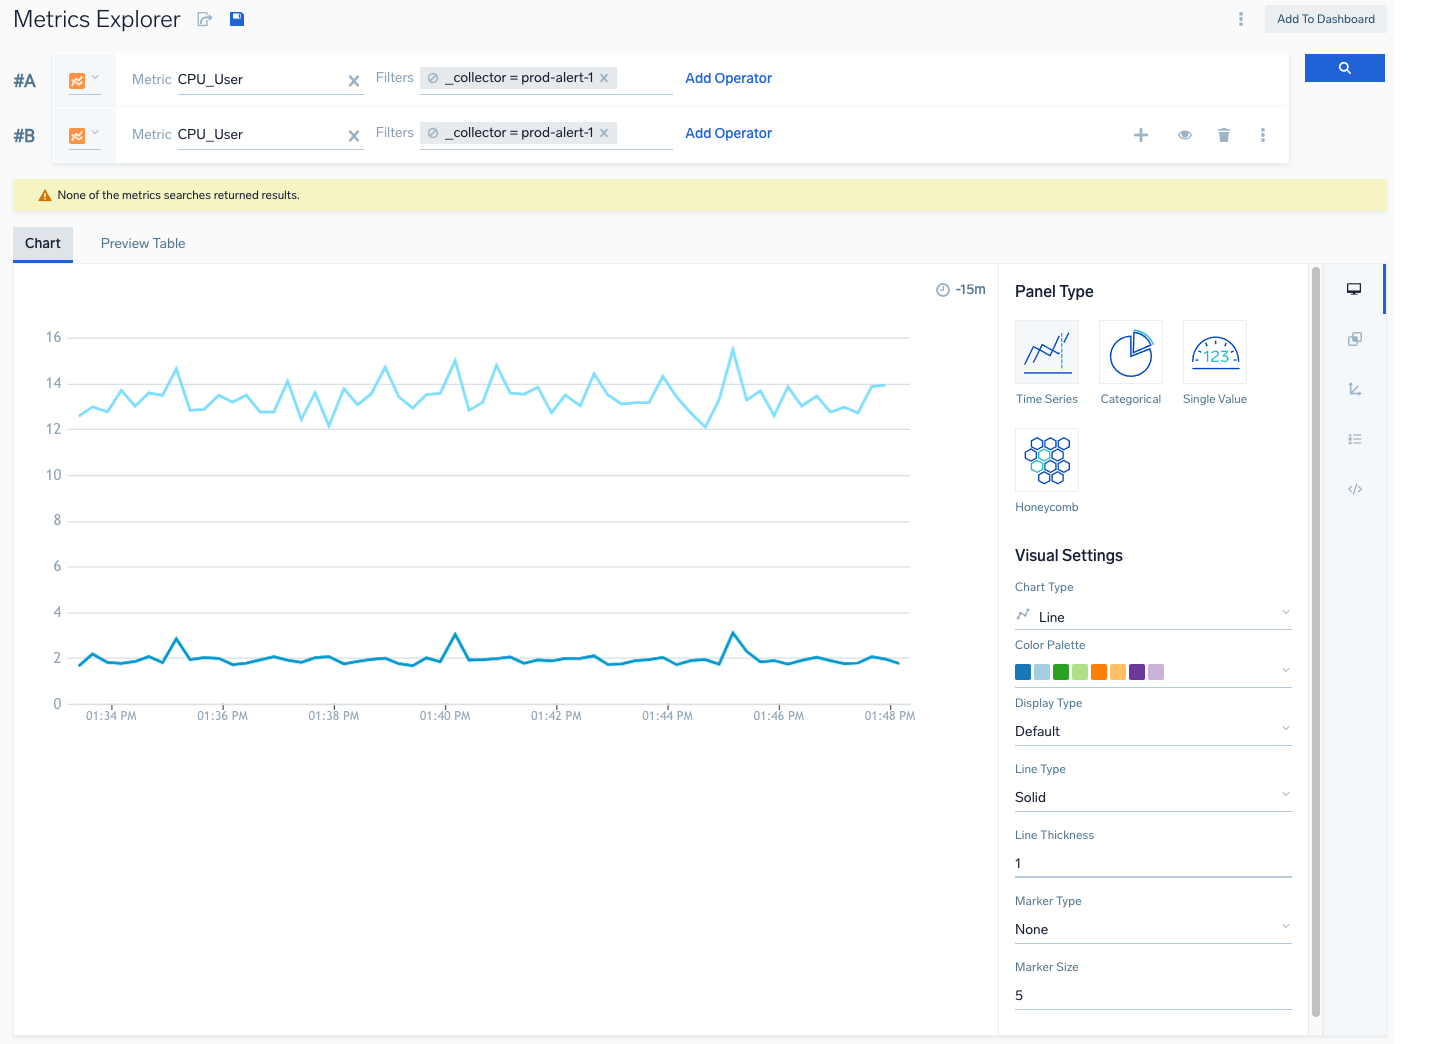
You can specify up to six queries in the same Metrics tab.
To add an additional query:
- Click Add Query to the right of the query builder area.
- A new row, labeled #B, is added to the query builder area.
- Follow the steps in Create a metric query to build another query, and click the run icon to run the query.
- Your visualization is updated to chart the additional query.
Join metric queries
Metric query joins are only supported in Advanced Mode. The instructions below show how to switch to Advanced mode and enter a join query.
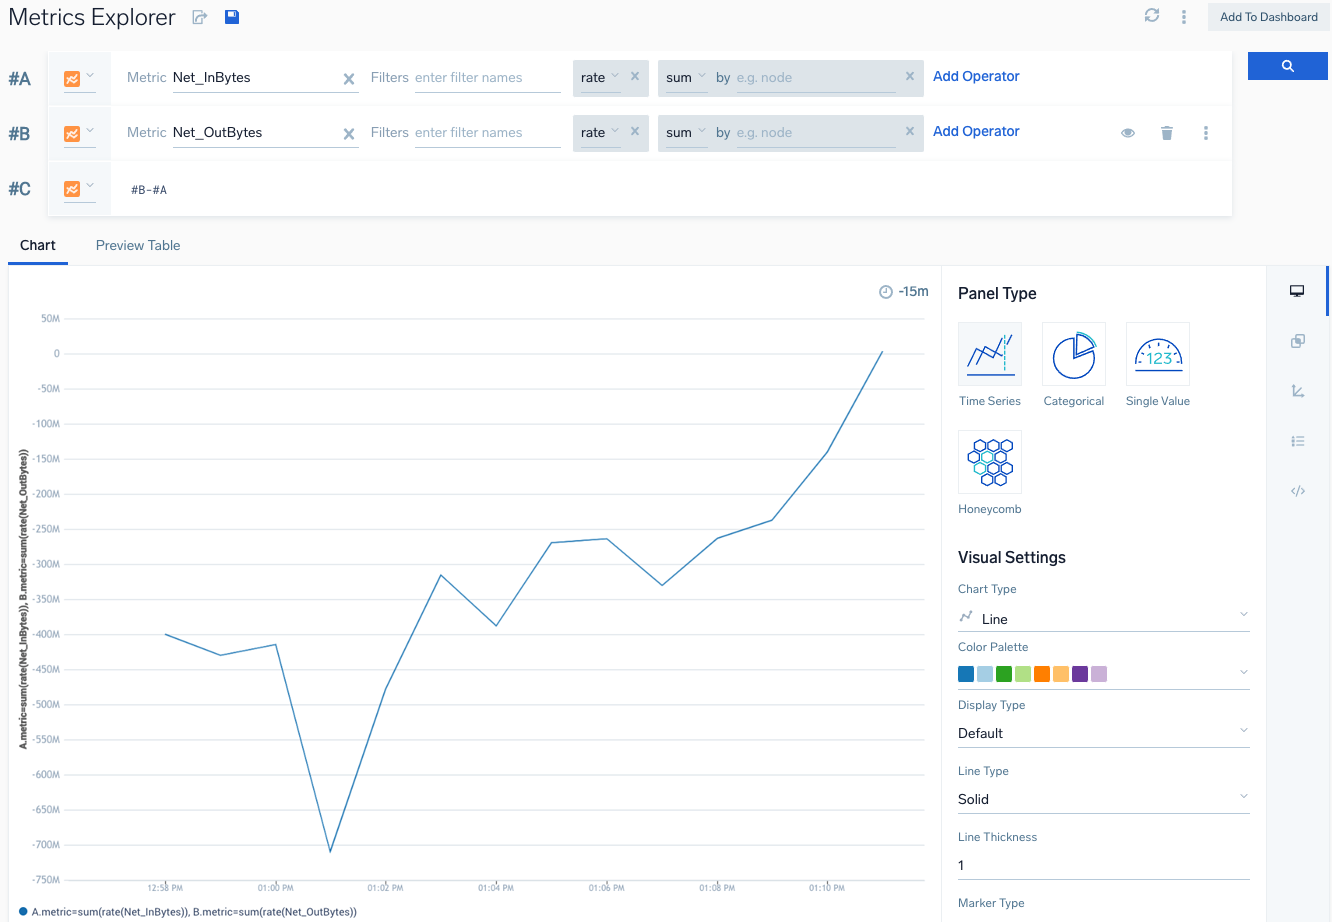
You can perform basic math operations (+, -, *, /) on two or more metrics queries, and use an additional query to apply an operation to the results of the other queries. For example, in the metric query tab below, the two queries return the incoming and outgoing network bytes.
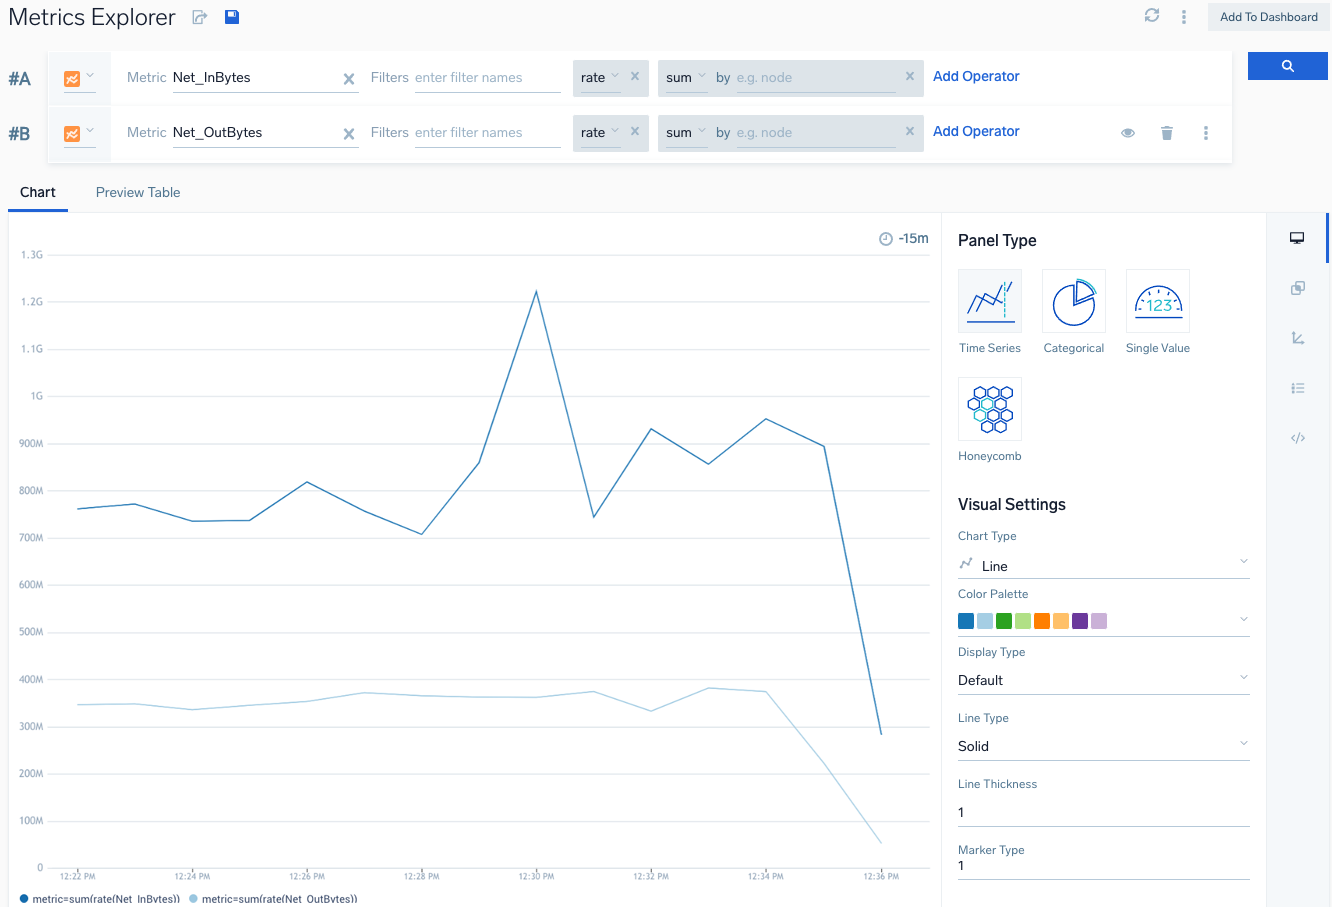
To join the queries, add a third query row, and then switch to Advanced mode, by choosing Advanced Mode from the three-dot menu in that row.
In Advanced mode, enter:
#B-#A
It returns the difference between the incoming rate and the outgoing rate. In the visualization, display of the first two queries is toggled off, so only the join results are shown.
Hide a query
You can hide a query so that it is not visualized in the chart.
- Click the eye icon to the right of the query builder area in the row that contains the query you want to hide.
- The visualization for the query is hidden. The query label for a hidden query is faded out.
- To make the query visible, click the eye icon again.
Add a monitor to a metric query
- Select Add Monitor from the more options menu.
- Follow the instructions to add a Monitor.
Convert query mode
The Metrics Explorer opens in Basic Mode by default. You can convert between Basic and Advanced anytime.
- Select Advanced Mode from the more options menu.
- Build your query in Advanced Mode.
- To convert to Basic, select Basic Mode from the more options menu.
- The query converts with each filter loaded for editing or removing as needed. You can also add more operators. If the query cannot be converted, a message displays.
Duplicate a metric query
- Select Duplicate Query from the more options menu.
- Your query will be copied to a new row in the query builder area.
Tailoring charts
For information about tailoring charts, see modify a chart.
Add a metric chart to a dashboard
To add a metric chart to a dashboard, click the Add to Dashboard button in the upper right corner of the Metric tab.
Metrics Explorer FAQs
Below are some FAQs about the Metrics Explorer.
What happens to the current metrics tab when the new Metrics Explorer comes out?
The Metrics Explorer replaces the Classic metrics UI. If you’re not ready to switch to the Metrics Explorer, you continue to use the Classic UI until you are. The option for switching between Classic metrics and Metrics Explorer is on the three-dot menu at the top right of the page, next to the Add to Dashboard button.
What value does Metrics Explorer provide?
The Metrics Explorer gives you more visualization types and makes your metrics easier to discover. Metrics Explorer provides the same visualizations available in Dashboards (New), from tables and category charts, to time series charts and honeycomb visualizations. The Metrics Explorer has richer and more comprehensive autocomplete support, providing suggestions for even very high cardinality queries. The structured query builder approach also makes the metrics experience friendlier to infrequent and inexperienced metrics users.
Can I put logs and metrics on the same panel in the Metrics Explorer?
Yes you can. The experience is consistent with the Dashboards (New) experience and has the same features.
I loved the ability to overlay log-based events and metrics on the classic metrics page. When will you be bringing that back?
Event overlay support is planned for a future release of Metrics Explorer.
How does autocomplete when searching metrics work?
Autocomplete in the Metrics Explorer works by taking what you type and looking for tokenized prefixes that match your input. We tokenize based on spaces, underscores, hyphens, and a variety of other special characters. For example, assume you have a metric metric_this_is. If you enter is in the Metric field, Sumo Logic will suggest metric_this_is because is is a token in the metric. Similarly, entering met will result in the same recommendation because met is a prefix for the token metric. However, if you enter ric, we won't suggest metric_this_is because ric isn’t a prefix of any of the tokens in token in that metric name.