Edit Monitor Settings and View Activity
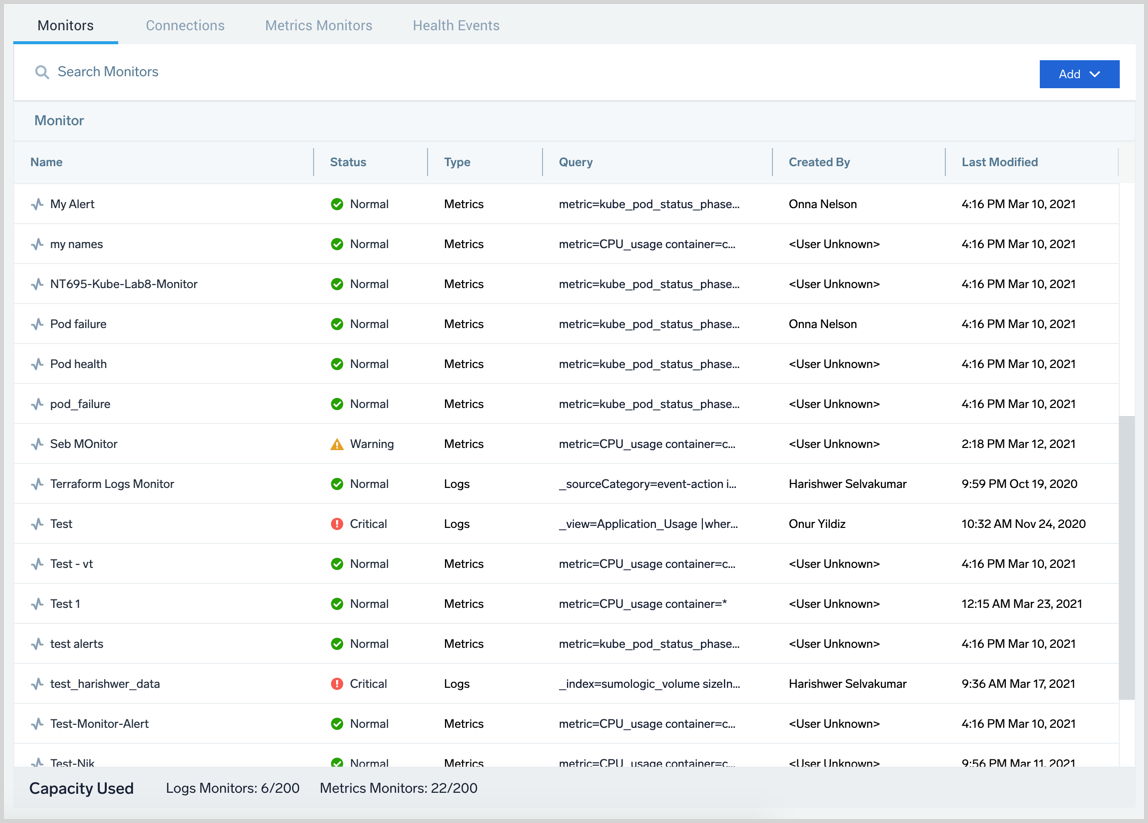
The Monitors page (Manage Data > Monitoring > Monitors) allows you to view, create, manage, and organize your Monitors. The page displays the following information:
- Name. Name of the Monitor.
- Status. A Monitor is considered Normal when none of the trigger conditions are met and your data is actively being monitored.
- Type. A Monitor type is either Logs or Metrics, based on the type of data being monitored.
- Query. The query the Monitor is running to track your data.
- Created By. The user that created the Monitor.
- Last Modified. The time the Monitor was last updated.
- Capacity Used. The bottom of the table shows the number of Log and Metric Monitors in your account.
To quickly open the Alert List to view all of the triggered alerts from a Monitor, hover your cursor over its Status and click the icon.

At the top of the page, you can:
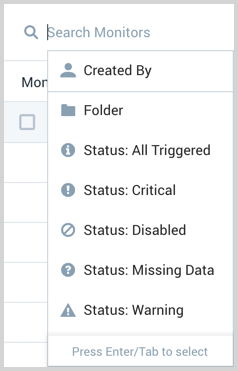
- Search Monitors. Use the search field to filter Monitors by name and status. For example, you can view all Monitors that are currently triggered in the system by clicking the Status: All Triggered.
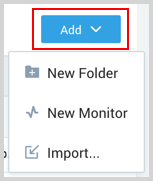
- Add > New Folder: create a folder to organize your Monitors.
- Add > New Monitor: create a new Monitor.
- Add > Import: import Monitors from the exported JSON you copied from the More Actions menu in the Details pane of the original monitor.
The Import function is provided for you to transfer data immediately. The Sumo Logic JSON format may change without notice. There is no guarantee that you will be able to import the JSON in the future.
Quick menu
The quick menu allows you to make changes to the Monitor without opening the Details pane. Find and hover your mouse over a Monitor in the Monitors table. A three-dot icon appears on the right of the row. Click the three-dot icon to view a menu with all of the options available in the Details pane.
Details pane
The details pane provides additional information about a selected Monitor, like its query, trigger conditions, and notification preferences. For the monitors listed, select a row to view its details. A details pane appears to the right of the table.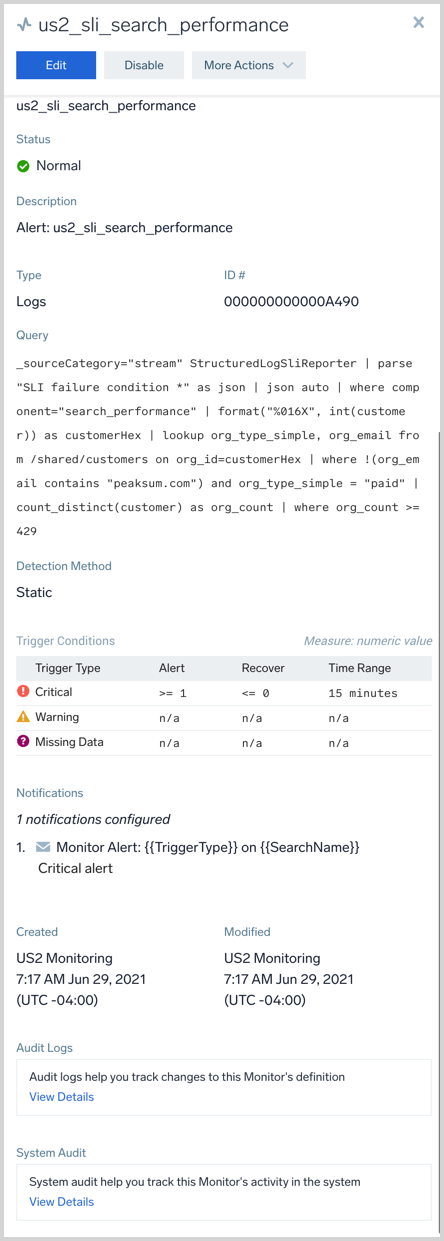
In the details pane, you'll see the following details for a Monitor:
- Name. Shows the name of the Monitor.
- Status. Shows the status of the Monitor - Normal, Critical, Warning, or Missing Data. A Monitor can be in multiple states at the same time.
- Description. Shows the description, if any.
- Type. Shows the type of Monitor, either Logs or Metrics.
- Path. Shows the Library location where the monitor is located.
- Query. It is used to track your data.
- Trigger Conditions Thresholds value that must met for Monitor to trigger an alert. These values are set when you create a monitor and can be based on a variety of metrics such as CPU usage, network latency, application response time. . Applicable values include Critical, Warning, and Missing Data.
- Notifications. These are configured on the Monitor.
- The timestamp and user that Created and last Modified the Monitor.
View in Metrics Explorer
The View in Metrics Explorer button on the Monitors Details page allows you to view the threshold values of a monitor in Metrics Explorer. When you click on this button, it takes you to the Metrics Explorer page with the same thresholds values applied. This helps you to see how your monitor's thresholds values are translating into the metrics, and easily compare the threshold values set in Monitor with the data displayed in the Metrics Explorer graph.
To view the thresholds translating values in your metrics explorer, follow the steps below:
- Select Monitor from the Monitoring page.
- On the Monitors Details pane, navigate to the Trigger Conditions section and note the thresholds values defined for Critical and Warning data conditions. All other parameters will be set to default, such as the window to 15 minutes and the "at all times" box checked.
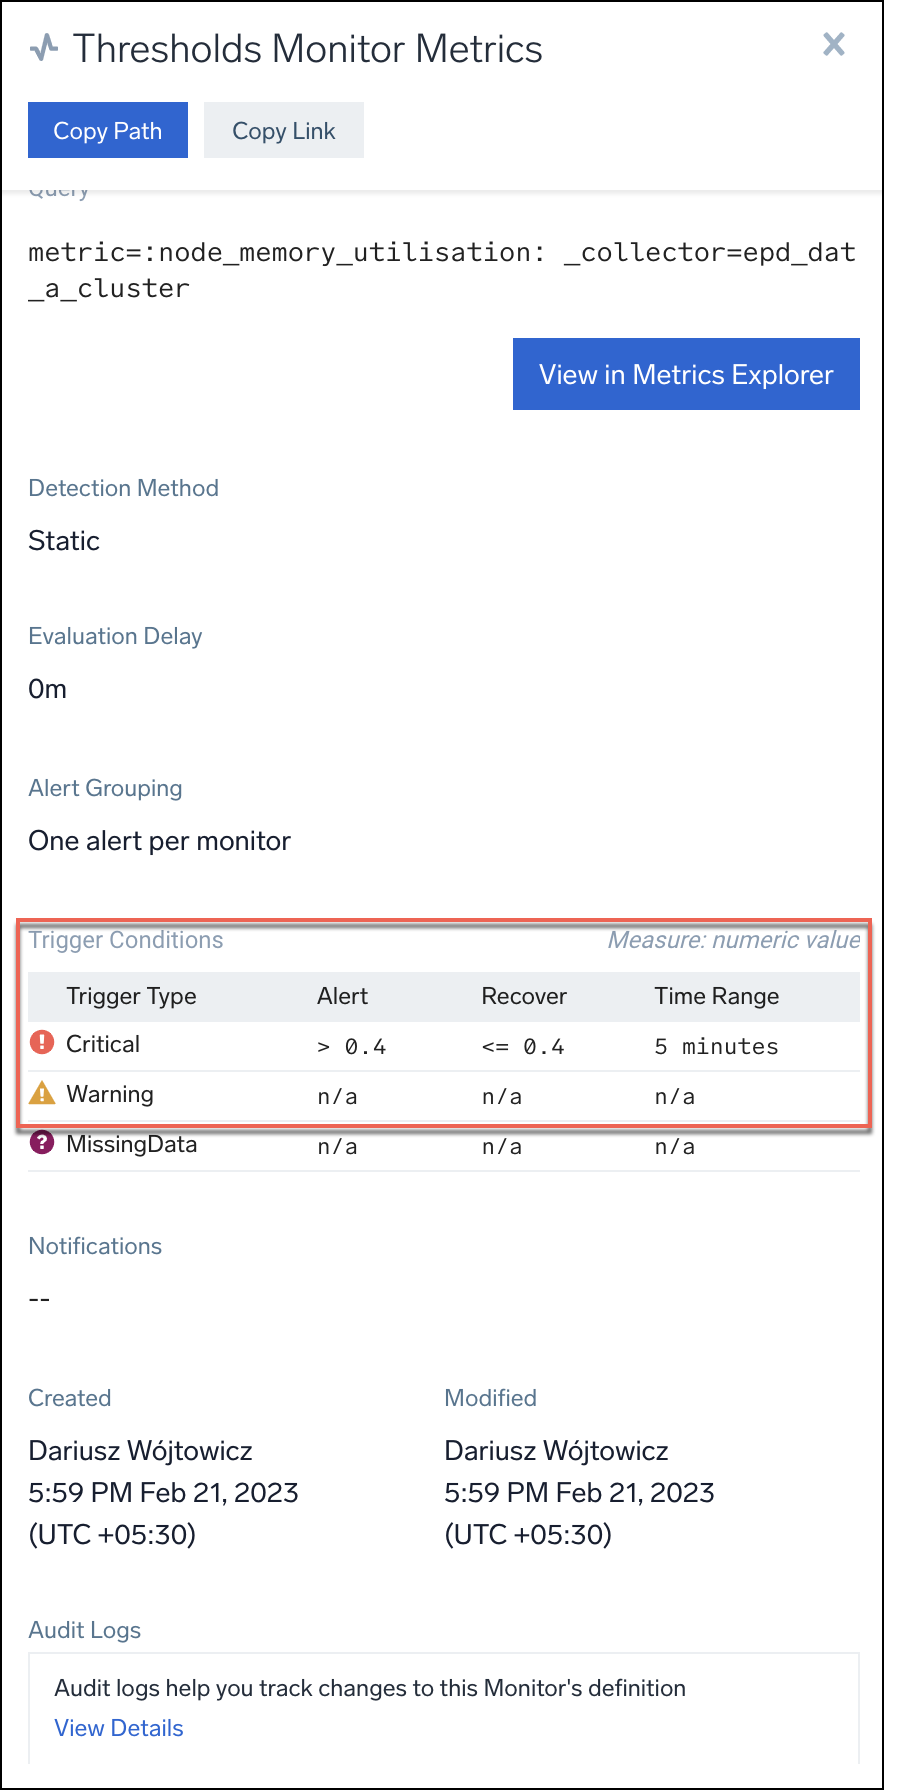
- Click the View in Metrics Explorer button
 . The Metrics Explorer page will display with the same threshold values applied to the panel and graph.
 - On the Panel settings page, click threshold
 icon to view the values that you have defined for the Monitor.
 - To view the values on chart, you may need to change the window time range in the graph to some other as the default is 15 minutes.
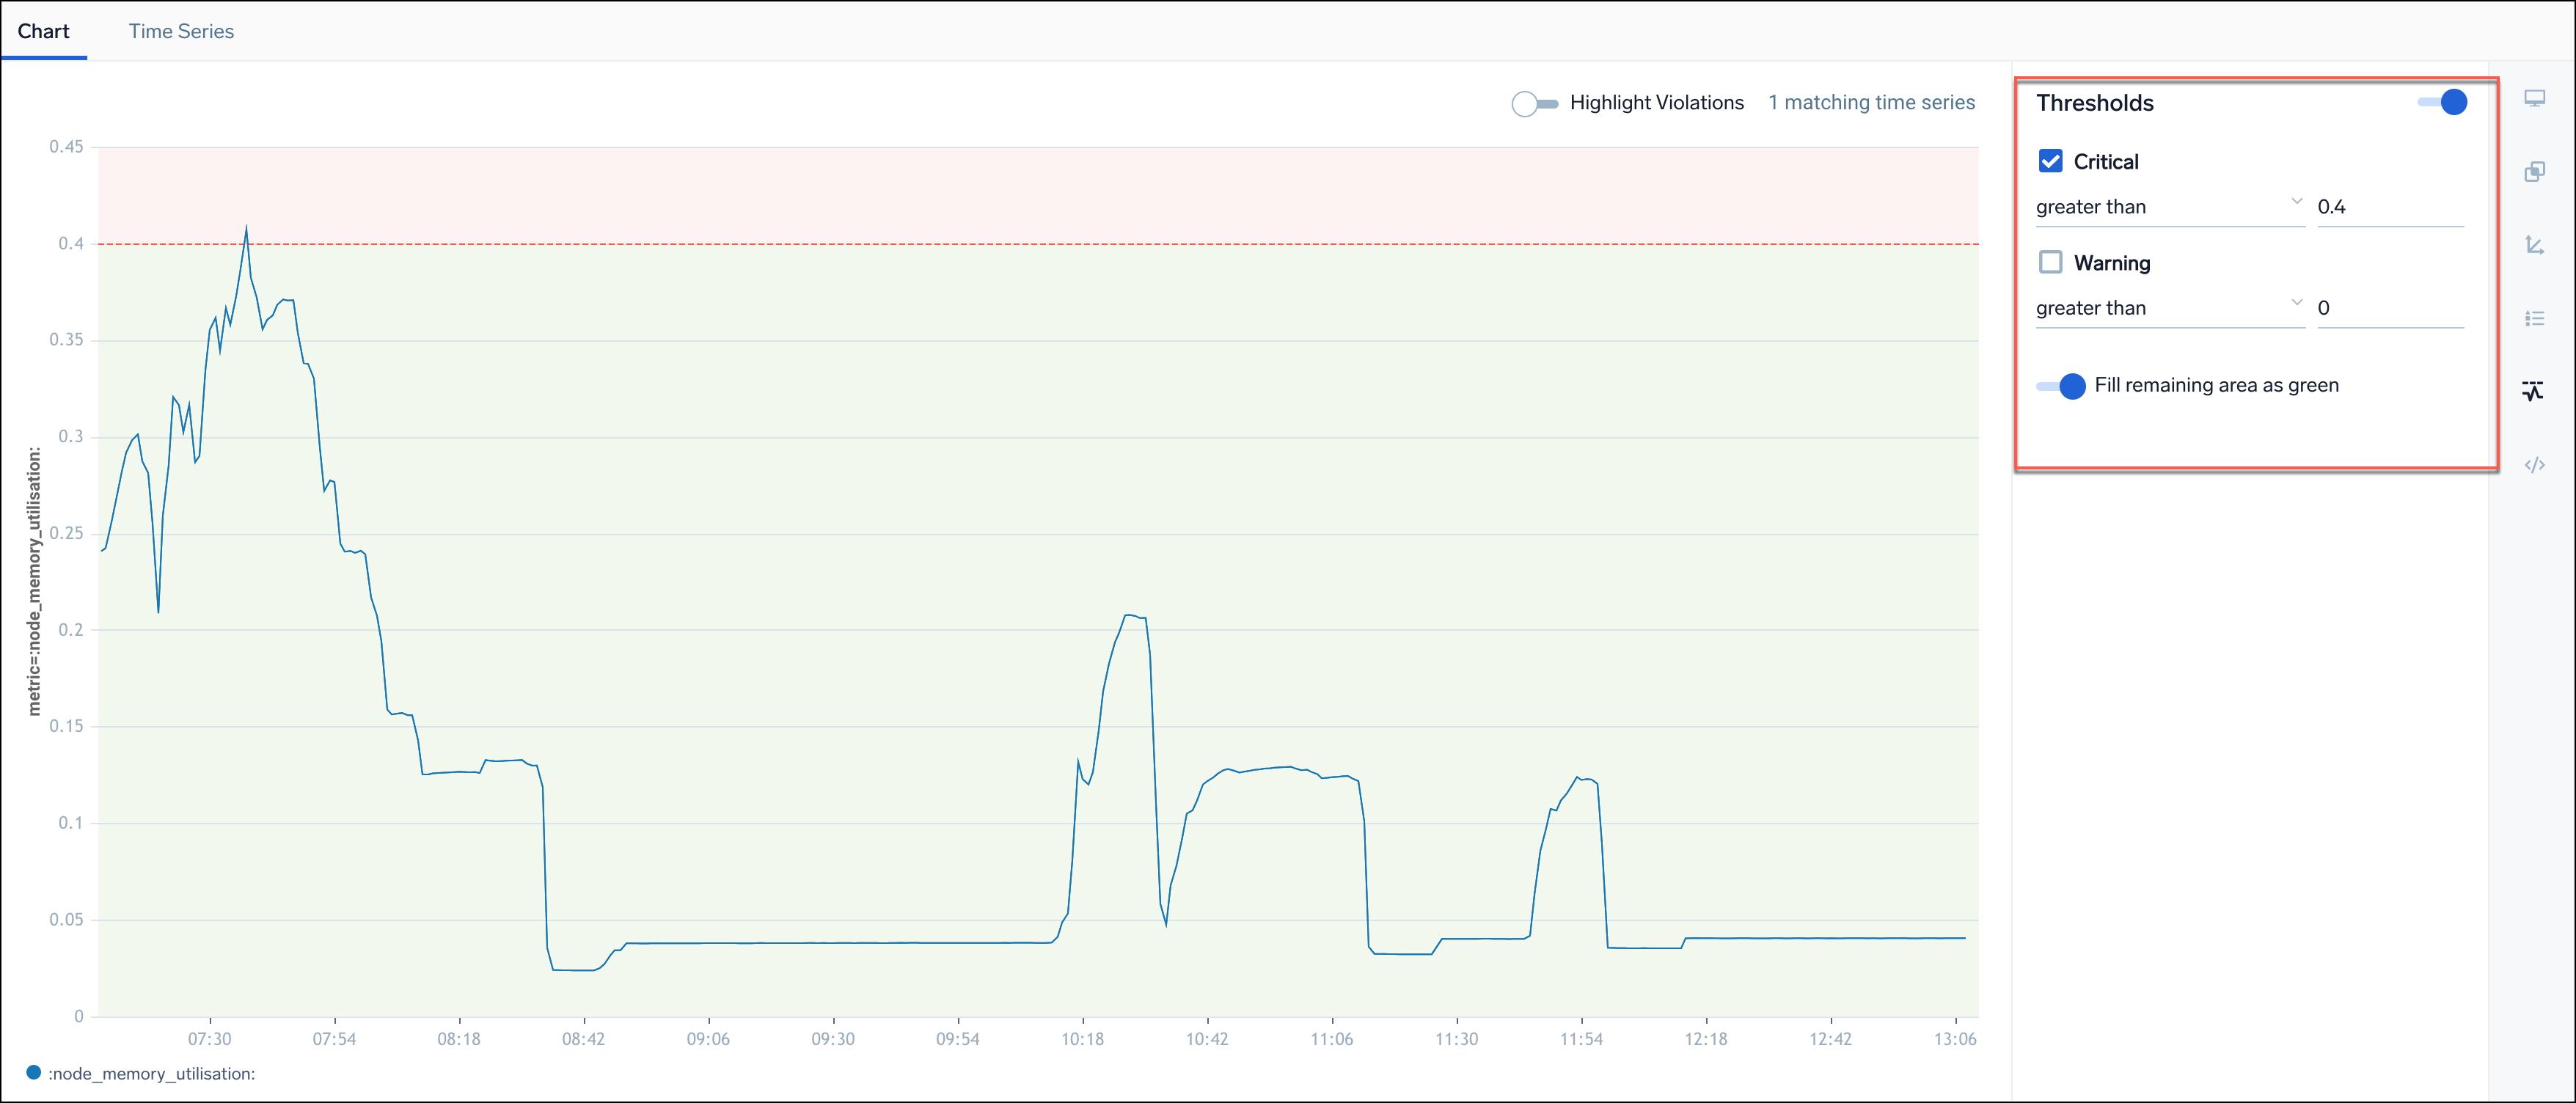
Note that the same threshold translating functionality supports to Creating Monitor from the Metrics Explorer and Opening Alerts Response Page in the Metrics Explorer
Edit, Disable, More Actions
- Edit button: Use this to make changes to the selected Monitor.
- Disable button: Puts the Monitor in a disabled state so it will not fire any notifications.
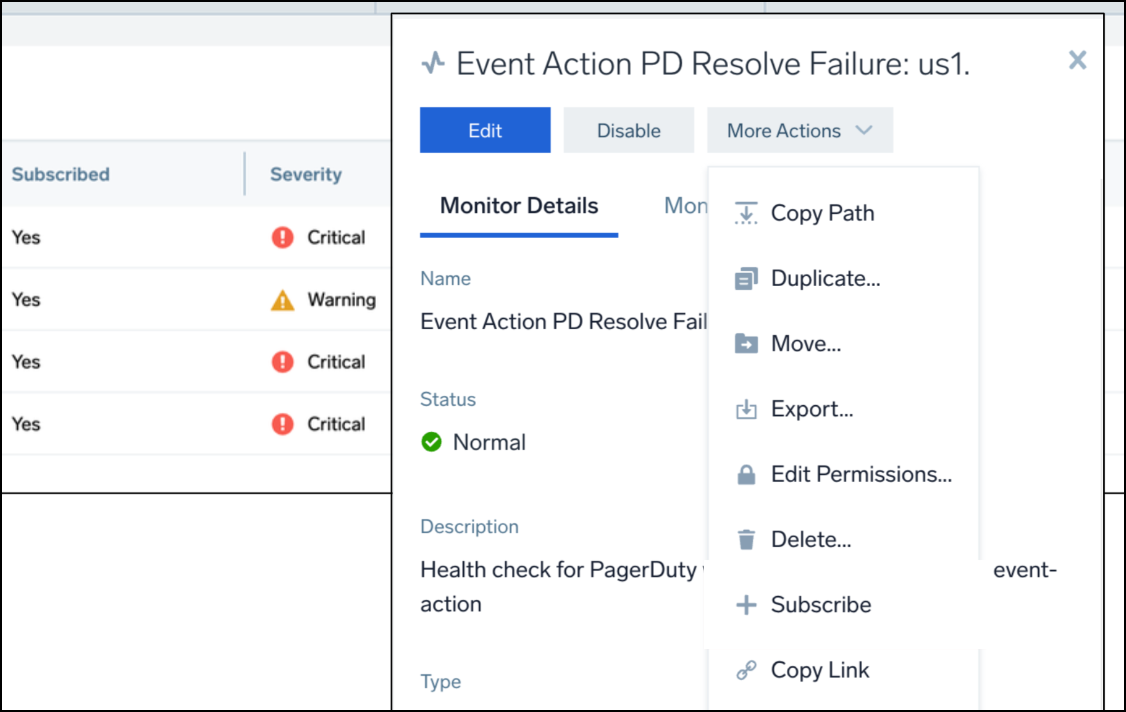
- More Actions menu:
- Disable and Enable. A Monitor that is in a disabled state will not fire any notifications.
- Copy Path. Copy the path of the Monitor to your computer clipboard.
- Duplicate. Make another Monitor based on the same settings.
- Move. Move the Monitor to a different path.
- Export. Provides JSON of the Monitor, allowing you to transfer content within Sumo Logic by copying this JSON, then pasting it into the import dialog in the Library location you choose. This JSON format may change without notice.
- Edit Permissions.
- Delete.
- Subscribe
- Copy Link.
Monitors folder permissions
This section describes permissions for folders that contain Monitors. This feature is not enabled by default in all accounts. If you would like access to this feature please contact Sumo Logic Support for assistance.
Access to folders that contain Monitors is controlled by permissions. If you have the Manage Monitors role capability, you can grant one or more roles permissions to folders that you have created. If you have the Admin Monitors capability you can manage permission to all folders on the Monitors page. The permissions you can set are:
- Read. View-only access to Monitors in the folder.
- Update. Ability to edit Monitors in the folder.
- Create. Ability to create new Monitors in the folder.
- Delete. Ability to delete Monitors from the folder.
- Manage. Ability to move folders and to grant other roles permissions to the folder. If you grant this permission, the permissions listed above will be granted as well.
To set permissions for a Monitors folder:
- Go to Manage Data > Monitoring > Monitors in the Sumo Logic UI.
- Right-click on the folder whose permissions you want to set, and click Edit Permissions. This option is present only if you have been granted Manage permission for the folder.
- On the edit popup, note that the user who created the folder, and roles with the Admin Monitors capability, automatically have all permissions to the folder.
- You can make the following edits:
- You can use the checkboxes to change the permissions currently assigned to a role that was explicitly added to the folder. (You can’t change the permissions to the Administrator and Monitors Admin role.)
- You can click Add Role to add a role to the folder. You’ll be prompted with the "Your Entire Organization" option, and a list of roles. Select "Your Entire Organization" or one or more more roles, and checkmark the permissions you want to grant. If you grant access to a specific role in addition to "Your Entire Organization" users of that role will be granted the least restrictive access defined by the two permission sets.
- You can remove a role that was explicitly added to the folder. To do so, mouse over the role in the edit popup, and click the X that appears.
The permissions you set for a folder are inherited by that folder’s subfolders. When a user views permissions for such subfolders, the inherited permissions will be grayed out. It is not possible to deselect inherited permissions, but you can add additional permissions. Inherited permissions can only be removed by removing them from the higher level folder where they were assigned.
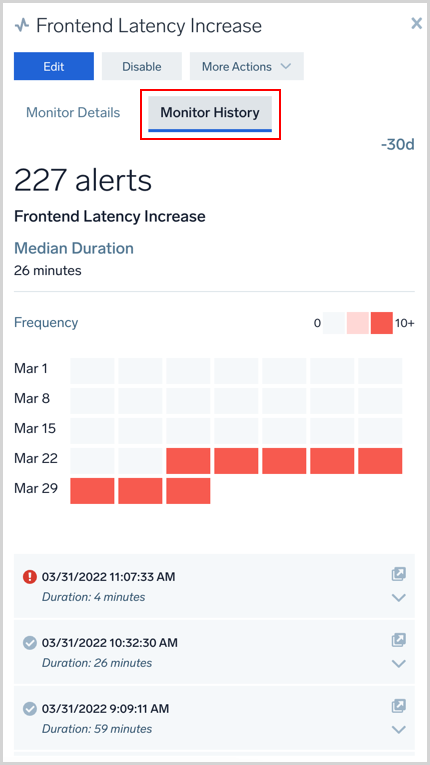
Monitor History
In the Monitor History tab, you can view the history of all triggered alerts of your selected Monitor.